In Situ
Data Provenance Capture in Spreadsheets
Hazeline Asuncion Computing and Software Systems University of Washington, Bothell
Bothell, WA USA [email protected] CSS Technical Report# UWB-CSS-11-01
August 2011 Abstract—The capture of data provenance is a fundamentally important task in eScience. While provenance can be captured using techniques such as scientific workflows, typically these techniques do not trace internal data manipulations that occur within off-the-shelf analysis tools. Yet it is still essential to capture data provenance within such environments. This paper discusses an in situ provenance approach for spreadsheet data in MS Excel, a commonly used analysis environment among scientists. We describe the design and implementation of an Excel tool that captures provenance unobtrusively in the background, allows for user annotations, provides undo/redo functionality at various levels of task granularity, and presents the captured provenance in an accessible format to support a range of provenance queries for analysis. We also present several motivating use case scenarios and a user evaluation which suggests that our approach is both efficient and useful to scientists.
Keywords: data provenance, in situ capture, spreadsheets I. INTRODUCTION
Data provenance encompasses the origin and history of data [20], including the series of processing steps used in the data analysis or experiment [7]. Provenance is typically captured using a scientific workflow approach, as demonstrated by the plethora of workflow tools and techniques developed over the years [4, 10, 19]. Scientific workflows allow scientists to codify the design of an experiment or data analysis and to capture provenance during workflow execution. Such an approach enables scientists to link together independent data processors in the form of executable code, scripts, or web services and to re-run this processing pipeline as needed [19].
In many research contexts, however, the bulk of data analysis occurs within off-the-shelf tools (such as MS Excel) which often fall out of the purview of standard workflow techniques. As an example, the Jaffe Atmospheric Science Research Group at the University of Washington, Bothell (UWB) [1] has generated and processed many hundreds of datasets in the form of Excel spreadsheets over the years (derived from data sources such as the NOA, EPA, and NASA), since Excel is one of the group’s primary data analysis tools. Later in this paper, we discuss motivating data provenance use cases tailored towards this research group.
In such situations, it becomes necessary to support internal provenance capture within the analysis tool itself. For instance, if a scientist engages in exploratory data analysis in Excel and discovers an important result, it would be crucial to have the ability to retrace the processing steps that led to the discovery. At the same time, the ideal provenance capture approach should be unobtrusive, with minimal overhead to the user. Furthermore, the captured provenance should be accessible, easy to analyze, and lightweight in terms of storage.
Our approach attempts to meet these ideal requirements in the following ways. Provenance capture within the Excel environment is performed by capturing the data processing in situ, as the user interacts with the data. As the provenance is automatically being captured in the background, the user can also provide high-level annotations which specify the current task being performed. The captured provenance is then stored and presented to the user as a chronologically-ordered task list in a tabular format that can be queried, analyzed, shared, and replayed in the future. One benefit of this approach is that the user can extract useful information from the provenance log without needing to learn a query language. In essence, the captured provenance serves both as a record of changes applied to a dataset as well as a means for the provenance tool to replay the data analysis either in its entirety or at various levels of granularity.
The main contributions of this paper are as follows:
We develop an unobtrusive in situ approach for capturing provenance within spreadsheets, as well as techniques for analyzing provenance and replaying user tasks.
We implement a provenance capture tool within MS Excel that operates in the background, has a wide range of functionality, and is easily accessible via a custom provenance ribbon menu in Excel.
We provide realistic use cases for our approach, an evaluation from a research group that has used our tool, and a feature comparison with related provenance systems.
In the next section, we describe the provenance capture technique. Section 3 provides implementation details. Section 4 presents a user evaluation of the technique, and Section 5 provides a brief overview of related work along with a feature
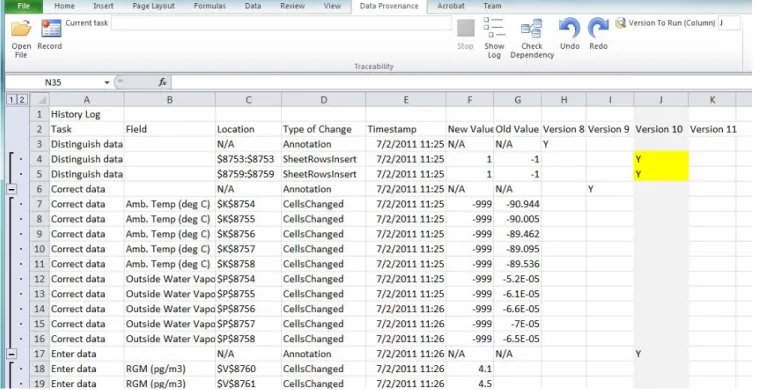
Figure 1. The top Excel screenshot shows the changes made to the dataset. The bottom screenshot shows the same dataset reverted to the previous version via the Undo button (which is accessible from our tool’s ribbon menu shown above). Note that highlighted cells mark the entries that have been reverted.
comparison to the implemented tool. Finally, we conclude with potential directions for future work.
II. TECHNIQUE
In this section, we present a framework for supporting the
in situ capture of data provenance. First, we discuss the rationale for building our framework on top of MS Excel and then we discuss the details of recording user interactions. Additional capabilities of our technique such as undo/redo functionality, dynamic version creation, and change dependency tracking are also discussed.
A. Building Provenance Support Within Scientific Tools
The main rationale for building provenance support on top of Excel is that Excel is already a key data analysis tool used by many scientists and researchers. In addition, since provenance capture resides within a familiar environment, the captured provenance log is at the same level of discourse as the tool, which enhances understandability. For instance, Excel users can understand that the label “$A$1” corresponds to a specific cell location within the spreadsheet.
In general, there are several ways provenance support can be built within the context of an existing tool. The first is to build a provenance user interface within the work environment using an adapter or software plug-in. Similar to the PReP
approach [12], one can also build a wrapper around the tools used by the scientist so that user interaction events can be intercepted. Another approach is to leverage any customization or extensibility support provided by the tool. If the tool supports logging of user activities, this log can be fed into a provenance component to be analyzed and rendered visually.
Our approach uses Excel’s public application programming interface (API) to support the following key functions: start/stop recording, enter user task, show log, and undo/redo data processing, and analyze change dependencies. For the analysis of provenance, we also take advantage of built-in Excel functionality that is familiar to casual Excel users, such as grouping, filtering, and sorting data.
B. Capturing Meaningful User Interactions in the Background
An analysis of existing provenance systems [5, 6] suggests that the level of event capture determines how well the provenance can be understood. The level of automatic semantic capture increases with the increased awareness of semantics in the framework of the provenance tool. For example, since the CAVES project is built on top of an existing data analysis tool [5], it is easy to infer the semantics of its generated provenance log. Meanwhile, the original PASS project was built to only capture operating system level events, and thus the events were difficult to map to high-level tasks [6].
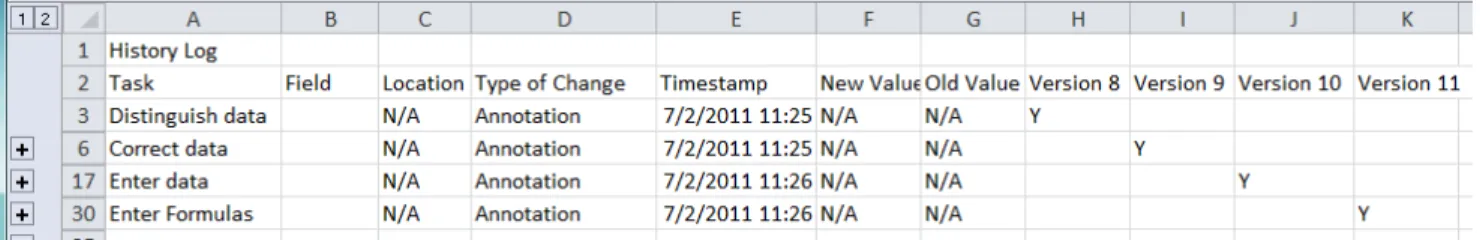
Figure 2 The History Log automatically groups low-level actions to their corresponding high-level tasks (see column A), enhancing interpretability. One can also perform task-level versioning.
Our technique seeks to strike a balance between low-level provenance capture and understandability by using background information from the user and from the structure of the data itself. During a recording session, the user can provide an annotation for the high-level task that the user will subsequently perform. A task consists of individual actions, or change events, that are recorded. As we see later, this type of user annotation on the recorded provenance helps the user understand the fine-grained changes which are at the spreadsheet cell level.
We also associate semantic meaning to the captured provenance by identifying each change with an attribute name. We assume that a dataset begins with headings and we extract these headings when we generate the provenance log.
In addition to capturing semantic information, the technique uses the following strategies to filter noise during an event capture. The simplest method is to allow the user to explicitly specify which interaction events to capture. This can be done
in situ with a start/stop record button, or after the fact via manual post-processing. A second strategy we use is to restrict the captured provenance to a pre-specified set of events (e.g. cell change event, sort event). For instance, we do not detect events relating to file management, since we are simply interested in tracking the changes within an Excel spreadsheet. In addition, we ignore some events, like the “SheetSelection” change event, if there is no subsequent “SheetChange” event.
Our technique could also incorporate the following automated filtering techniques. One technique is to automatically identify events that do not aid in reproducing the data analysis. For instance, events that indicate mouse movements across the screen are considered noise since they do not directly provide clues on how the data is being manipulated. We could also use an adaptive technique to automatically identify the noise. For example, machine learning techniques [11] can be used to automatically infer which events are noise and which events are valid.
C. Analyzing Captured Provenance
Once provenance has been captured, it is important for users to be able to understand the log and extract useful information. Understandability is supported by presenting the log in a tabular format, with each recorded event represented as a row in the table. Each event consists of the high-level task, the field name, the type of change (e.g. Annotation or CellChanged; see the next section for a discussion), timestamp, and the old and new values.
To extract useful information from the log, one can create different views of the log. For example, the logs can be presented as simply a list of high-level tasks or high-level tasks with low-level event details. Queries such as “What fields changed during a given time range?”, “What tasks were performed?”, and “What types of change occurred?” can be answered by filtering the provenance log at appropriate fields
D. Running Undo and Redo
The undo/redo functionality automates the reproducibility of data processing without requiring the user to record or edit Excel macros. This functionality uses the captured provenance as a means of reproducing user actions. Users can also flexibly specify the level of granularity to undo or redo actions.
We categorize the types of changes in a spreadsheet in terms of formatting changes, content changes, and structural changes. Formatting changes are changes to the presentation of content, as such setting a bold font or using a number format. Content changes include entering data or formulas in cells. Meanwhile, structural changes are changes to the structure of the data, such as inserting rows and sorting columns. Filtering or hiding data is not considered a change, since the content, format, and structure are intact but only hidden from view.
In the context of a spreadsheet, some changes are naturally reversible while others are not. For instance, if our framework captures a row insertion event (e.g., row 8756 in the top figure in Figure 1), the natural reverse action is to perform a row deletion event (e.g. the bottom figure in Figure 1). Meanwhile, other changes do not have natural reverse actions. For instance, the sort functionality does not have a reverse action.
Supporting undo for actions without natural reverse actions is still possible. One approach is to take a snapshot of the state of the data prior to a change. Specific content changes, for instance, can be reversed by logging the old and the new values. In general, this approach could be costly since it may require recording all the states or all of the contents of the cells in a spreadsheet. A related approach is to leverage Excel’s built-in undo functionality, which allows one to search through the current list of undo events and select the appropriate event.
E. Creating Different Versions on the Fly
Once we have the capability to undo/redo tasks or actions selectively, we now have the mechanism for dynamically creating different versions. This capability is useful in helping researchers to recall the changes from one version to the next and to explore different data processing paths. We now discuss our strategy for creating versions dynamically.
Figure 3. When the a user checks for dependencies, the tool automatically includes the dependencies of selected changes (highlighted and marked as "Y") as shown for Version 10.
Versions can be created using a standard or a selective approach. The standard approach is to save changes to a file as a different version, either automatically using a configuration management system, or manually in a file system. In this approach, versions are based on time. In other words, all the aggregated changes up to a given time t are represented by a version.
Another way a version can be created is through a selective determination of changes (i.e. tasks or actions) to assign to a given version. Thus, the user can create as many versions of the data processing as they like, using various permutations of the processing steps. Consequently, this allows researchers to reflect upon what they have done, replay parts of the processing that are of interest, and explore the processing space to determine which processing paths are successful or unsuccessful.
With this approach, however, we introduce the possibility that key actions, which may have causal effects to later processing steps, would be omitted from a given version. Take the following scenario. Assume we base a calculation on row 2 and we then insert a row above row 2. If our user-selected version only included the calculation on row 2 without including the insertion, we would have an inaccurate version of the spreadsheet. Consequently, being able to support different versions on the fly will require the ability to effectively handle change dependencies and to include key changes that have causal effects on downstream steps.
F. Handling Change Dependencies
Usually with workflow systems, task dependencies are manually specified by the researcher, as they connect the different processing modules together as a workflow. However, when the processing steps are recorded based on user actions, change dependencies must be detected and handled explicitly.
There are two types of change dependencies that may occur on spreadsheets. The first is temporal dependency where the sequence of changes imposes dependencies. This is often the case with structural changes. The series of insertions and deletions of rows or columns must be preserved to maintain the integrity of the data. One strategy for detecting these dependencies is to check the provenance log for structural changes. If there are structural changes, one would need to examine in the log whether the succeeding changes are affected by the structural change. For instance, if a row is inserted in row 3, changes to cells below row 3 are dependent on the row 3 insertion. We will refer to row 4 and the rows below as the “affected areas.” Thus, if the user wishes to re-execute the changes to these affected areas, the tool will notify the user that it will also re-execute the row 3 insertion to maintain the integrity of the data (e.g., see Figure 3). The same logic applies to row deletions. If a row is deleted, the affected cells include the current row and the subsequent rows. For column inserts and deletes, the affected cells are the cells residing to the right of the column that is inserted or deleted. If non-contiguous rows or columns are deleted, then the above steps will be applied to each row or column that is inserted or deleted. Finally, to undo a series of insertions or deletions, the undo must proceed in the reverse chronological order of the change.
Formula dependency, on the other hand, is not based on the sequence of changes. For instance, one may enter the formula first and then later enter the contents of the cell that will be calculated or one may enter the contents of the cell first and then the formula. The sequence of actions typically does not have bearing on the dependency. Rather, it is based on the fact that the formula uses the contents of a range of cells. Formula dependencies can be represented as dataflow graph [13]. These dependencies can be detected by scanning the spreadsheet for any formulas and extracting the range of cells in these formulas. We will also refer to these ranges of cells as “affected areas.” The next step is to check the provenance log to determine whether any of the affected areas have been changed. If these cells have been changed, the tool can inform the user that this formula may need to be recalculated.
III. TOOL SUPPORT
We built our provenance tool support as an Excel Add-In program. We designed the provenance tool to support the following goals: record user interaction with the data, analyze the captured provenance, and reproduce the provenance.
To capture useful user interactions, the tool was designed to capture changes to the data itself. In order to detect changes, the current implementation monitors the “SheetChange” and the “SheetSelectionChange” events. The tool also detects when commands are invoked from Excel’s ribbons.
To facilitate the analysis of captured provenance, the tool automatically generates a log in a tabular format and inserts it as one of the sheets within the current file. This increases the accessibility of the provenance log to the user. Moreover, the tool allows users to answer provenance queries by using Excel’s built-in filter mechanism. One can filter events according to one or more attributes.
To enable the reproducibility of data processing, the tool supports undo/redo actions on a set of actions or tasks specified by the user. To specify the sets of changes to analyze, the user can create a new version of changes by selecting a task or an individual action. Selections are made by entering “Y” at the appropriate version column (see Figure 2). If the user selects a task, all the individual actions mapped to that task will be replayed. If the user selects an individual action, only that selected action will be replayed. Once the composition for a version has been determined, and dependency checks are completed, the user can invoke undo/redo on the version specified in the ribbon (see Figure 5).
A. Tool Design
The functionality of our tool can be accessed via a custom provenance ribbon in Excel. Our tool supports the following functionalities: record, enter user tasks, show log, undo/redo, and check for dependencies.
The Excel Add-In consists of a custom ribbon for the user interface, a change event model, and a component for handling user interface events (e.g. button clicks). When the tool is in record mode, the recording methods are invoked whenever an applicable event is detected. When the tool is not in record mode, the functions are invoked via the ribbon.
We envision the tool being used in the following manner. Researchers record their data processing. Once they finish recording, they may examine the captured provenance log file. They may create different versions of the file to analyze their processing steps and add notes to the version columns. They can save their file, along with the provenance log and share it with their colleagues. Sometime later, researchers may also run the same processing steps on a different dataset.
B. State of Implementation
The provenance tool was implemented in C# and built on top of Excel 2010. Note that the tool is also compatible with Excel 2007. The current implementation supports recording content changes, selected formatting changes, and selected structural changes. In addition, provenance log generation, undo/redo functionality, dynamic creation of version, and temporal dependency tracking have been implemented.
We encountered a few implementation challenges. When listening for change events, the “SheetChange” event does not distinguish between a content change and insert/delete events. Thus, for the current implementation, we detect an insertion or deletion if these commands are invoked from Excel’s ribbon. In addition, it was difficult to determine certain aspects of the previous state of a cell to support the undo function since there was no API to fully obtain this information. However, this may be addressed by accessing Excel’s built-in undo list.
IV. EVALUATION
We provide realistic use cases for our approach as well as a user evaluation of the provenance capture tool in Excel.
A. Use Cases
Our techniques support a wide variety of use cases that typically arise in research settings. In this section, we present various questions that researchers might ask when working with spreadsheet data, and we discuss how our approach addresses these questions. In these scenarios, we use a published dataset supplied by the Jaffe Atmospheric Research Group at UWB [16, 9].
1) Use Case 1: How may I view the differences between version 7 and version 8 of dataset X?
The differences between two versions of a dataset can be visualized using the Undo/Redo buttons. After recording the user interactions with the data and storing them in the provenance log, we can easily see the previous state and the current state of the spreadsheet (see Figure 1). The original values are highlighted in yellow in the bottom figure. In fact, the differences between the two different versions can be tracked and persisted in the History Log worksheet
2) Use Case 2: Which tasks did I perform on dataset X?
A user can answer this question by simply grouping the log according to tasks, which hides all the actions (see Figure 2).
3) Use Case 3: What types of changes were made on the “Ambient Temperature” and “RGM” attributes?
To answer this question, the user simply filters the event log at the Field column (see Figure 4). Since the Field column
Figure 4. Filtered provenance log according to the Field column (column B). We leverage Excel’s built-in filter capabilities to enhance provenance analysis.
corresponds to the attribute name in the dataset, the user can easily locate the specified attributes.
4) Use Case 4: What can I do to view the incorrect processing I may have done?
This can be accomplished by stepping through the changes using the dynamic versioning in the system. Assume that we want to step through the changes according to task. Let us create the number of versions according to the number of tasks in our log (4 in this example). These versions can be represented in columns H, I, J, K. We assign a version for each task, denoted by “Y” in Figure 2. When we go back to our data, we can step through our processing by entering the appropriate column version in the “Version to Run” field in the ribbon menu. Doing so highlights the changes for the indicated version (see Figure 5). In addition, one can also view changes made at the action level or at both task and action levels.
B. User Evaluation
In addition to simulating use cases on the tool, we also asked a research member of the Jaffe Atmospheric Research group at UWB to use our Excel Add-In tool during actual data processing sessions. The task entailed processing a raw dataset to transform it into a format that can be analyzed by researchers in the group. The steps followed include checking the data, correcting entries, and using statistical formulas. The user, who is in charge of managing the data for the group, used our tool to capture his processing on a raw dataset with 26,500 rows and 30 columns, which is a typical dataset size in his group.
According to the user, the tool was effective in capturing his changes and also allowed him to easily revert to a previous version when needed. He stated that the tool answers a key provenance question for the research group: “What changed from the older version to the newer version of the dataset?” The ability to track fine-grained changes was also helpful as it helped him to quickly recall his data processing steps. In terms of efficiency, the provenance capture tool allowed him to save approximately 20-30 minutes per file.
The provenance log was also beneficial to the user. In particular, the user found the grouping of actions into high-level tasks to be helpful in understanding the log. In addition, the placement of the provenance log within the file was a benefit to him, as “only needing one file is a bonus and saves on disk space.”
The user did suggest some tool improvements. He would like to have a comment box so that he can enter miscellaneous notes and keep track of the rationale for his processing steps. In addition, he would prefer to have finer-grained distinctions for content changes. Data entry, data correction, and formula entries were all labeled as “CellsChanged” in the log, which was initially confusing to him.
It took the user, who has programming experience, about 20 minutes to learn the tool after seeing a demo of how it is used.
C. Discussion
The user feedback we obtained regarding the tool suggests that internal provenance support within an off-the-shelf analysis tool like Excel has utility. While there are requests for tool improvements, the user has expressed enthusiasm at the prospect of regularly using the tool during his data processing.
Since the user has programming experience, he may be favorably biased towards using new tools for his work. However, with the data processing workload he handles for the group, it seems unlikely that he will adopt a new tool unless he sees concrete benefits in using the tool. One advantage of our approach is that we leverage the user’s existing knowledge of Excel to lower the barrier to entry in using the tool. Another advantage is that our tool operates in the background in an unobtrusive manner; thus, the user’s normal work routines are not significantly altered.
It would be useful to conduct further evaluations on users with varied technical expertise. Moreover, fine-grained versioning could benefit from further testing, especially involving the interactions between structural changes (e.g. insert/delete columns). Nonetheless, this evaluation suggests that our provenance framework has utility and can save users a substantial amount of time.
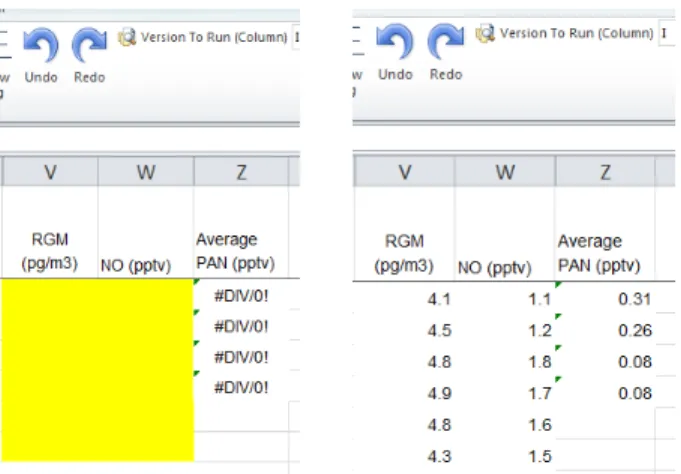
Figure 5. Fine-grained undo (left) and redo (right) allows researchers to visually step through the data processing.
V. RELATED WORK
We now discuss the current support for automated provenance capture and we present a feature comparison with other provenance tools.
A. Automatically Capturing Provenance
Scientific workflows have provided a means for capturing the series of transformations that have been applied to data [4, 10, 19]. These workflows have enabled scientists to first specify the flow of experiment or analysis (also referred to as the abstract workflow or the experiment design) and then to specify how elements in this workflow map to specific services, functions, or instances of data. When the workflow is executed, the series of processing on the data is automatically invoked and executed and an execution log is captured as a means of capturing provenance. Thus, scientific workflows enable the automatic capture of changes to the data or the capture of events between computational units in a workflow.
Other techniques capture provenance by capturing user interaction with the data. For example, VisTrails captures user events to automatically track the different versions of a workflow model [10]. Other related systems are PASS [6] and CAVES [5]. In PASS, user interactions with the data are captured at the operating system level. Because the captured provenance is at the level of operating system events (e.g. file open, file close), it is difficult to filter noise and map these events to specific user tasks or user steps in the processing of the data. Thus, a later version of PASS integrates operating system level events with workflow level events [18]. At the other end of the spectrum, CAVES captures explicit high-level user commands to manipulate the data within the CAVES environment.
Existing provenance tools also provide some level of support for Excel spreadsheets. Taverna’s support for Excel includes importing a spreadsheet into a workflow, running workflows from within Excel, saving results to an Excel spreadsheet, and transforming an Excel file into a .cvs file [2]. Kepler also supports accessing data stored in Excel files [3]. In contrast, our framework captures provenance internally within the Excel environment as users manipulate spreadsheet data.
There are also tools developed on top of Excel to capture provenance. One tool tracks provenance among different documents, including Excel spreadsheets, at the file level [15]. Another Excel-based tool automatically generates a dependency structure among cells based on formulas [13]. While these approaches are retrospective in nature, we take an
in situ approach to provenance capture; furthermore, in our approach, captured user interactions are coupled with user annotations to provide meaning for the recorded user actions.
Our approach has some similarities with recording a macro within Excel, but it is also distinctive in many respects. Our framework provides support for user annotations of high-level tasks, undo support at various levels of granularity, a provenance log at the end of a recording session, and a dependency analysis of the changes made to the spreadsheet. Moreover, our tool is accessible to casual Excel users, as it does not require the user to examine a macro script when the user needs to rerun a task.
B. Provenance Redo/Undo
Re-execution of data processing steps is supported by most tools. Scientific workflow tools [10, 17] support the re-execution of workflows. Taverna2 also supports the re-running or re-invoking of services to prevent the entire workflow from failing. The CAVES tool supports re-running commands automatically from the captured log. PASSv2 [18] has no explicit support for re-executing the processing, although the processing could be manually reproduced by following the captured logs. Meanwhile, our approach supports the re-execution of processing steps at the action and task level, as well as at the level of the entire captured provenance.
Undo functionality is generally not supported among provenance tools. A database-based provenance tool, Trio, provides limited support via its inverse transformation [8]. Kepler provides undo support for editing scripts [3]. Perhaps undo functionality is unnecessary in workflow systems since one can simply access the input data file to see the state of the output file prior to the processing. Our approach supports undoing content changes as well as a subset of formatting and structural changes.
C. Multi-level Versioning
Analyzing the types of changes made is a key goal that our approach has addressed. Our approach allows users to track the changes between different versions and to create different versions on the fly based on user-selected tasks or actions. Other systems [6, 10] provide one level of versioning support.
D. Provenance Queries
Most of the existing tools use a query language tool to enable users to extract information from the provenance log [5, 10, 14, 17]. Our tool does not require the use of a query language. Using standard Excel functionality, users may simply filter the log file in order to answer their provenance queries. This accessibility and ease of use of the captured provenance information is a key benefit of our approach.
TABLE I. FEATURE COMPARISON
Our in situ technique PASS v2 CAVES VisTrails Taverna2 / Kepler
Record Yes Yes Yes Yes Yes
Redo execution Yes, re-run tasks, actions or entire processing
No Yes, re-run commands
Yes, re-execute workflows
Yes, re-run services, actors, or entire
workflows Undo execution Some support No No No No
Multi-level versioning
Yes No No No No
Queries Yes, filter by task, data attribute, time, type of change
Yes, query log for files, processes, pipes,
file versions Yes, query database for logs stored Yes, specialized query – based on keyword search
Yes, query database
VI. CONCLUSION
This paper advances a novel approach for capturing provenance in situ as users manipulate spreadsheet data. We have discussed a variety of techniques for capturing, analyzing, and replaying provenance in this context, and we have implemented an efficient tool in MS Excel that supports these functionalities in an unobtrusive manner. Feature comparisons with related work and a user evaluation of the tool conducted by a UWB atmospheric science research group suggest that the approach can provide significant benefits to researchers who rely on spreadsheets to perform data processing or exploratory data analysis.
In the future, we aim to provide a graphical visualization of the captured provenance, which would allow scientists to visually step through the provenance log, using tasks as markers in this visualization. Another interesting avenue of future work is retrospectively analyzing multiple spreadsheets and automatically generating and visualizing dependency graphs among elements within these spreadsheets.
ACKNOWLEDGMENTS
Development support was provided by Alex Dioso. We thank Dan Jaffe and Jonathan Hee for useful feedback. This research was supported in part by the UWB Undergraduate Research Fund.
REFERENCES [1] http://www.atmos.washington.edu/jaffegroup/. [2] http://www.taverna.org.uk.
[3] https://kepler-project.org.
[4] Ilkay Altintas, Oscar Barney, and Efrat Jaeger-Frank. Provenance collection support in the Kepler Scientific Workflow System. In Proc of the Int’l Provenance and Annotation Workshop (IPAW), 2006.
[5] Dimitri Bourilkov. The CAVES project - Collaborative Analysis Versioning Environment System, the CODESH project — COllaborative DEvelopment SHell. Int’l Journal of Modern Physics, A20(16):3889– 3892, 2005.
[6] Uri Braun, Simson Garfinkel, David A. Holland, Kiran-Kumar Muniswamy-Reddy, and Margo I. Seltzer. Issues in automatic provenance collection. In Proc of the Int’l Provenance and Annotation Workshop (IPAW), 2006.
[7] S. Cohen, S. Cohen-Boulakia, and S. Davidson. Towards a model of provenance and user views in scientific workflows. In Data Integration in the Life Sciences, 2006.
[8] Yingwei Cui and Jennifer Widom. Lineage tracing for general data warehouse transformations. VLDB Journal, 12:41–58, 2003.
[9] E. V. Fischer, D. A. Jaffe, and E. C. Weatherhead. Free tropospheric peroxyacetyl nitrate (PAN) and ozone at Mount Bachelor: causes of variability and timescale for trend detection. Atmospheric Chemistry and Physics Discussions, 11(2):4105–4139, 2011.
[10] J. Freire, C. T. Silva, S. P. Callahan, E. Santos, C. E. Scheidegger, and H. T. Vo. Managing rapidly-evolving scientific workflows. In Proc of the Int’l Provenance and Annotation Workshop (IPAW), 2006.
[11] Mark Grechanik, Kathryn S. McKinley, and Dewayne E. Perry. Recovering and using use-case-diagram-to-source-code traceability links. In Proc of 6th Joint Meeting of the ESEC/FSE, Dubrovnik, 2007. [12] Paul Groth, Simon Miles, Weijian Fang, Sylvia. C. Wong, Klaus-Peter
Zauner, and Luc Moreau. Recording and using provenance in a protein compressibility experiment. In Proc of the 14th Int’l Symp on High Performance Distributed Computing, Research Triangle Park, NC, 2005. [13] Felienne Hermans, Martin Pinzger, and Arie van Deursen. Supporting professional spreadsheet users by generating leveled dataflow diagrams. In Proc of the Int’l Conference on Software Engineering, 2011.
[14] David A. Holland, Margo I. Seltzer, Uri Braun, and Kiran-Kumar Muniswamy-Reddy. PASSing the provenance challenge. Concurrency and Computation: Practice & Experience, 20:531–540, April 2008. [15] Carlos Jensen, Heather Lonsdale, Eleanor Wynn, Jill Cao, Michael
Slater, and Thomas G. Dietterich. The life and times of files and information: a study of desktop provenance. In Proc Int’l Conference on Human Factors in Computing Systems, 2010.
[16] Ambrose J. L., Reidmiller D.R., and Jaffe D.A. Causes of high O3 in the lower free troposphere over the Pacific Northwest as observed at the Mt. Bachelor Observatory. Atmospheric Environment, June 2011.
[17] Paolo Missier, Stian Soiland-Reyes, Stuart Owen, Wei Tan, Alexandra Nenadic, Ian Dunlop, Alan Williams, Tom Oinn, and Carole Goble. Taverna, reloaded. In Proc of Scientific and Statistical Database Management. 2010.
[18] Kiran-Kumar Muniswamy-Reddy, Uri Braun, David A. Holland, Peter Macko, Diana Maclean, Daniel Margo, Margo Seltzer, and Robin Smogor. Layering in provenance systems. In Proc of the USENIX Annual Technical Conference, 2009.
[19] Tom Oinn, Mark Greenwood, Matthew Addis, M. Nedim Alpdemir, Justin Ferris, Kevin Glover, Carole Goble, Antoon Goderis, Duncan Hull, Darren Marvin, Peter Li, Phillip Lord, Matthew R. Pocock, Martin Senger, Robert Stevens, Anil Wipat, and Chris Wroe. Taverna: Lessons in creating a workflow environment for the life sciences. Concurrency and Computation: Practice & Experience, 18(10):1067–1100, 2006. [20] Robert Stevens, Jun Zhao, and Carole Goble. Using provenance to
manage knowledge of in silico experiments. Briefings in Bioinformatics, 8(3):183–194, May 2007.