www.caymanchem.com
Customer Service 800.364.9897
Technical Support 888.526.5351
1180 E. Ellsworth Rd · Ann Arbor, MI · USACorticosterone ELISA Kit
3
GENERAL INFORMATIONTABLE OF CONTENTS
GENERAL INFORMATION 3 Materials Supplied 4 Safety Data 4 Precautions
5 If You Have Problems 5 Storage and Stability
5 Materials Needed but Not Supplied
INTRODUCTION 6 About This Assay
7 Description of AChE Competitive ELISAs
9 Biochemistry of Acetylcholinesterase 11 Definition of Key Terms
PRE-ASSAY PREPARATION 12 Buffer Preparation 13 Sample Preparation 15 Sample Purification
ASSAY PROTOCOL 20 Preparation of Assay-Specific Reagents 22 Plate Set Up
23 Performing the Assay
ANALYSIS 26 Calculations 28 Performance Characteristics RESOURCES 32 Troubleshooting 33 References 34 Plate Template 35 Notes
35 Warranty and Limitation of Remedy
GENERAL INFORMATION
Materials Supplied
Item Number Item 96 wells
Quantity/Size
480 wells Quantity/Size 401322 Corticosterone ELISA Antiserum 1 vial/100 dtn 1 vial/500 dtn 401320 Corticosterone AChE Tracer 1 vial/100 dtn 1 vial/500 dtn 400657 Corticosterone ELISA Standard 1 vial 1 vial 400060 ELISA Buffer Concentrate (10X) 2 vials/10 ml 4 vials/10 ml 400062 Wash Buffer Concentrate (400X) 1 vial/5 ml 1 vial/12.5 ml 400035 Polysorbate 20 1 vial/3 ml 1 vial/3 ml 400004/400006 Mouse Anti-Rabbit IgG Coated
Plate
1 plate 5 plates
400012 96-Well Cover Sheet 1 cover 5 covers 400050 Ellman’s Reagent 3 vials/100 dtn 6 vials/250 dtn If any of the items listed above are damaged or missing, please contact our Customer Service department at (800) 364-9897 or (734) 971-3335. We cannot
4
GENERAL INFORMATION GENERAL INFORMATION5
!
WARNING: THIS PRODUCT IS FOR RESEARCH ONLY - NOT FORHUMAN OR VETERINARY DIAGNOSTIC OR THERAPEUTIC USE.
Safety Data
This material should be considered hazardous until further information becomes
available. Do not ingest, inhale, get in eyes, on skin, or on clothing. Wash
thoroughly after handling. Before use, the user must review the complete Safety
Data Sheet, which has been sent via email to your institution.
Precautions
Please read these instructions carefully before beginning this assay.
The reagents in this kit have been tested and formulated to work exclusively with Cayman Chemical’s AChE ELISA Kits. This kit may not perform as described if any reagent or procedure is replaced or modified.
When compared to quantification by LC/MS or GC/MS, it is not uncommon for immunoassays to report higher analyte concentrations. While LC/MS or GC/MS analyses typically measure only a single compound, antibodies used in immunoassays sometimes recognize not only the target molecule, but also
structurally related molecules, including biologically relevant metabolites. In
many cases, measurement of both the parent molecule and metabolites is more representative of the overall biological response than is the measurement of a short-lived parent molecule. It is the responsibility of the researcher to understand the limits of both assay systems and to interpret their data accordingly.
If You Have Problems
Technical Service Contact Information
Phone: 888-526-5351 (USA and Canada only) or 734-975-3888
Fax: 734-971-3641
Email: [email protected]
Hours: M-F 8:00 AM to 5:30 PM EST
In order for our staff to assist you quickly and efficiently, please be ready to supply the lot number of the kit (found on the outside of the box).
Storage and Stability
This kit will perform as specified if stored as directed at -20°C and used before the expiration date indicated on the outside of the box.
Materials Needed But Not Supplied
1. A plate reader capable of measuring absorbance between 405-420 nm.
2. Adjustable pipettes and a repeating pipettor.
3. A source of ‘UltraPure’ water. Water used to prepare all ELISA reagents and buffers must be deionized and free of trace organic contaminants (‘UltraPure’). Use activated carbon filter cartridges or other organic scavengers. Glass distilled water (even if double distilled), HPLC-grade water, and sterile water (for injections) are not adequate for ELISA. NOTE: UltraPure water is available for purchase from Cayman (Item No. 400000).
6
INTRODUCTION INTRODUCTION7
INTRODUCTION
About This Assay
Corticosterone is a steroid hormone produced by the adrenal cortex in response to stress. The production of glucocorticoids is increased in stress, and corticosterone is frequently measured as an indicator of stress.1 Corticosterone
can be measured in a variety of sample matrices including plasma, serum, feces, urine, eggs, and feathers.1-8
Cayman’s Corticosterone ELISA Kit is a competitive assay that has been developed for the measurement of corticosterone in serum, feces and other sample matrices. The assay has a range of 8.2-5,000 pg/ml and a sensitivity (80% B/B0) of approximately 30 pg/ml.
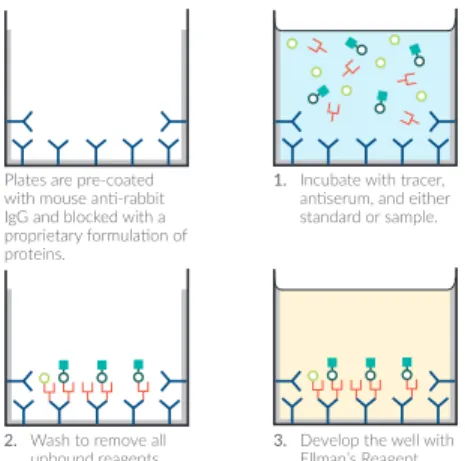
Description of AChE Competitive ELISAs
11,12This assay is based on the competition between corticosterone and a
corticosterone-acetylcholinesterase (AChE) conjugate (Corticosterone Tracer) for a limited amount of Corticosterone Antiserum. Because the concentration of the Corticosterone Tracer is held constant while the concentration of corticosterone varies, the amount of Corticosterone Tracer that is able to bind to the Corticosterone Antiserum will be inversely proportional to the concentration
of corticosterone in the well. This antiserum-corticosterone (either free or tracer) complex binds to the mouse anti-rabbit IgG that has been previously attached to
the well. The plate is washed to remove any unbound reagents and then Ellman’s
Reagent (which contains the substrate to AChE) is added to the well. The product of this enzymatic reaction has a distinct yellow color and absorbs strongly at 412 nm. The intensity of this color, determined spectrophotometrically, is proportional to the amount of Corticosterone Tracer bound to the well, which is
inversely proportional to the amount of free corticosterone present in the well during the incubation; or
Absorbance ∝ [Bound Corticosterone Tracer] ∝ 1/[Corticosterone] A schematic of this process is shown in Figure 1, on page 8.
8
INTRODUCTION INTRODUCTION9
Biochemistry of Acetylcholinesterase
The electric organ of the electric eel, E. electricus, contains an avid AChE capable
of massive catalytic turnover during the generation of its electrochemical discharges. The electric eel AChE has a clover leaf-shaped tertiary structure consisting of a triad of tetramers attached to a collagen-like structural fibril. This stable enzyme is capable of high turnover (64,000 s-1) for the hydrolysis of
acetylthiocholine.
A molecule of the analyte covalently attached to a molecule of AChE serves as the tracer in AChE enzyme immunoassays. Quantification of the tracer is
achieved by measuring its AChE activity with Ellman’s Reagent. This reagent
consists of acetylthiocholine and 5,5’-dithio-bis-(2-nitrobenzoic acid). Hydrolysis of acetylthiocholine by AChE produces thiocholine (see Figure 2, on page 10). The non-enzymatic reaction of thiocholine with 5,5’-dithio-bis-(2-nitrobenzoic acid) produces 5-thio-2-nitrobenzoic acid, which has a strong absorbance at 412 nm (ε = 13,600).
AChE has several advantages over other enzymes commonly used for enzyme-linked immunosorbent assays. Unlike horseradish peroxidase, AChE does not self-inactivate during turnover. This property of AChE also allows redevelopment of the assay if it is accidentally splashed or spilled. In addition, the enzyme is highly stable under the assay conditions, has a wide pH range (pH 5-10), and is not inhibited by common buffer salts or preservatives. Since AChE is stable during the development step, it is unnecessary to use a ‘stop’ reagent, and the
plate may be read whenever it is convenient. 1. Incubate with tracer,
anserum, and either standard or sample.
2. Wash to remove all
unbound reagents. 3. Develop the well with Ellman’s Reagent. Plates are pre-coated
with mouse an-rabbit IgG and blocked with a proprietary formulaon of proteins.
= Mouse An-Rabbit IgG = Blocking proteins
= AChE linked to Corcosterone (tracer) = Specific anserum to Corcosterone = Free Corcosterone
10
INTRODUCTION INTRODUCTION11
O S N + Acetylthiocholine O O- -S N + Thiocholine S S NO2 O2N COO--OOC 5,5'-dithio-bis-(2-Nitrobenzoic Acid) S S O2N -OOC N+ NO2 COO--S 5-thio-2-Nitrobenzoic Acid λmax: 412 nm ε: 13,600Figure 2. Reaction catalyzed by acetylcholinesterase
Definition of Key Terms
Blank: background absorbance caused by Ellman’s Reagent. The blank absorbance should be subtracted from the absorbance readings of all the other wells, including NSB wells.
Total Activity: total enzymatic activity of the AChE-linked tracer. This is analogous to the specific activity of a radioactive tracer.
NSB (Non-Specific Binding): non-immunological binding of the tracer to the well. Even in the absence of specific antibody a very small amount of tracer still binds to the well; the NSB is a measure of this low binding. Do not forget to subtract the Blank absorbance values.
B0 (Maximum Binding): maximum amount of the tracer that the antibody can bind in the absence of free analyte.
%B/B0 (%Bound/Maximum Bound): ratio of the absorbance of a particular sample or standard well to that of the maximum binding (B0) well.
Standard Curve: a plot of the %B/B0 values versus concentration of a series of wells containing various known amounts of analyte.
Dtn: determination, where one dtn is the amount of reagent used per well.
Cross Reactivity: numerical representation of the relative reactivity of this assay towards structurally related molecules as compared to the primary analyte of interest. Biomolecules that possess similar epitopes to the analyte can compete with the assay tracer for binding to the primary antibody. Substances that are superior to the analyte in displacing the tracer result in a cross reactivity that is greater than 100%. Substances that are inferior to the primary analyte in displacing the tracer result in a cross reactivity that is less than 100%. Cross reactivity is calculated by comparing the mid-point (50% B/B0) value of the tested molecule to the mid-point (50% B/B0) value of the primary analyte when each is measured in assay buffer using the following formula:
% Cross Reacvity = 50% B/B0 value for the primary analyte
50% B/B0 value for the potenal cross reactant x 100%
12
PRE-ASSAY PREPARATION PRE-ASSAY PREPARATION13
PRE-ASSAY PREPARATION
NOTE: Water used to prepare all ELISA reagents and buffers must be deionized and free of trace organic contaminants (‘UltraPure’). Use activated carbon filter cartridges or other organic scavengers. Glass distilled water (even if double distilled), HPLC-grade water, and sterile water (for injections) are not adequate for ELISA.
UltraPure water may be purchased from Cayman (Item No. 400000).
Buffer Preparation
Store all diluted buffers at 4°C; they will be stable for about two months.
1. ELISA Buffer Preparation
Dilute the contents of one vial of ELISA Buffer Concentrate (10X) (Item No. 400060) with 90 ml of UltraPure water. Be certain to rinse the vial to remove
any salts that may have precipitated. NOTE: It is normal for the concentrated
buffer to contain crystalline salts after thawing. These will completely dissolve upon dilution with water.
2. Wash Buffer Preparation
5 ml vial Wash Buffer Concentrate (400X) (96-well kit; Item No. 400062): Dilute to a total volume of 2 liters with UltraPure water and add 1 ml of Polysorbate 20 (Item No. 400035).
OR
12.5 ml vial Wash Buffer Concentrate (400X) (480-well kit; Item No. 400062): Dilute to a total volume of 5 liters with UltraPure water and add 2.5 ml of Polysorbate 20 (Item No. 400035).
Smaller volumes of Wash Buffer can be prepared by diluting the Wash Buffer Concentrate 1:400 and adding Polysorbate 20 (0.5 ml/liter of Wash Buffer).
NOTE: Polysorbate 20 is a viscous liquid and cannot be measured by a regular pipette. A positive displacement pipette or a syringe should be used to deliver small quantities
accurately.
Sample Preparation
This assay has been validated for rodent serum and feces. Other sample types should be checked for interference before embarking on a large number of sample measurements. To test for interference, dilute one or two test samples to obtain at least two different dilutions of each sample between approximately 30 and 1,500 pg/ml (i.e., between ~20-80% B/B0). If the two different dilutions of the sample show good correlations (differ by 20% or less) in the final calculated corticosterone concentration, purification is not required. If you do not see good correlation of the different dilutions, purification is advised. Proper sample storage and preparation are essential for consistent and accurate results. Please read this section thoroughly before beginning the assay.
General Precautions
• All samples must be free of organic solvents prior to assay.
• Samples should be assayed immediately after collection; samples that cannot be assayed immediately should be stored at -80°C.
• Samples of rabbit origin may contain antibodies which interfere with the assay by binding to the mouse anti-rabbit IgG plate. We recommend that all sheep and rabbit samples be purified prior to use in this assay. • AEBSF (Pefabloc SC®) and PMSF inhibit AChE. Samples containing these
14
PRE-ASSAY PREPARATION PRE-ASSAY PREPARATION15
Serum
Collect blood in vacutainers that do not contain anticoagulant. Allow samples
to clot undisturbed for 30-60 minutes. Remove the clot by centrifugation at 1-2,000 x g for 15 minutes. Samples should be assayed immediately after
collection; samples that cannot be assayed immediately should be stored at
-20°C. Process following the Sample Purification methods beginning on page 15.
Feces
NOTE: This kit has been validated for use with mouse fecal samples. The antiserum
in this kit does not recognize the fecal metabolites of corticosterone found in deer and elk. If you wish to use this kit for fecal material from other species, it is strongly
recommended that you perform a biological validation before proceeding with the analysis of a large number of samples.
Fecal samples should be frozen immediately after collection. Process following
the Fecal Sample Extraction methods beginning on page 18.
Sample Purification
Purification Protocol
Materials Needed1. Tritium-labeled corticosterone (optional) 2. Methylene chloride (for plasma samples) 3. 80% Methanol (for fecal samples)
Serum Sample Extraction
The following protocol is a suggestion only. You may choose a different protocol based on your own requirements, sample type, and expertise. If desired, recovery may be tracked by spiking samples with tritium-labeled corticosterone ([3
H]-corticosterone) and follow the Spiked-Sample Recovery Calculations in the
Analysis section on page 27. Otherwise, omit step 2.
NOTE: We do not recommend the use of plastic vials or caps for this procedure. The methylene chloride may extract interfering compounds from the plastic.
1. Aliquot a known amount of each sample into a clean test tube.
2. Add 10,000 cpm of [3H]-corticosterone. Use a high specific activity tracer to
minimize the amount of radioactive cortico-sterone as the ELISA will be able to detect the added corticosterone. Follow the procedure below for both
spiked and unspiked samples.
3. Add methylene chloride (approximately four times the sample volume) to each tube. Vortex to mix thoroughly. Allow the layers to separate. Transfer the methylene chloride (lower) layer into a clean test tube using a transfer
pipette. Repeat this step three times.
NOTE: If it is necessary to stop during this purification, samples may be stored in the methylene chloride solution at -20°C or -80°C.
4. Evaporate the methylene chloride under a gentle stream of nitrogen. 5. Dissolve the extract in ELISA Buffer. If the samples were spiked with
[3H]-corticosterone to track recovery, remove 10% of the resuspended
volume for scintillation counting. The remainder is available for use in the ELISA.
16
PRE-ASSAY PREPARATION PRE-ASSAY PREPARATION17
Level Average (ng/ml) %CV Intra-assay variation Average (ng/ml) %CV Inter-assay variation High 654 9.3 714 7.0 Medium 372 7.4 406 7.0 Low 123 4.9 147 8.8Table 1. Mouse serum sample validation
Mouse serum samples containing a high, medium, or low level of corticosterone were measured 60 times each using a single set of reagents. The calculated %CV is reported as intra-assay variance. A separate series of mouse serum samples containing a high, medium, or low level of corticosterone were measured four times each using eight independent sets of reagents. The calculated %CV is
reported as inter-assay variance. 0 2,000 4,000 6,000
0 2,000 4,000 6,000 8,000
Concentration of Corticosterone added (ng/ml)
Co rtic os te ro ne m easured by ELIS A( ng /m l) Slope = 1.062 y-intercept = 453 ng/ml R2 = 0.994
Figure 3. Recovery of corticosterone from mouse serum
Mouse serum samples were spiked with corticosterone, purified as described
in the Sample Preparation and Sample Purification sections and analyzed using
the Corticosterone ELISA Kit. The y-intercept corresponds to the amount of corticosterone in unspiked mouse serum. Error bars represent standard deviations obtained from multiple dilutions of each sample.
18
PRE-ASSAY PREPARATION PRE-ASSAY PREPARATION19
Fecal Sample Extraction
The following protocol is a suggestion only. You may choose a different protocol based on your own requirements and expertise. NOTE: It is important to transfer
supernatants to clean tubes immediately after completing the extraction procedure, as some fecal metabolites will continue to elute into the methanol as long as there is
contact between the two materials. 1. Lyophilize samples to remove water.
2. Sift lyophilized samples through a stainless steel mesh to remove large particles. Mix each sample thoroughly to ensure homogeneity.
3. Place 50 mg of each sample into clean test tubes. 4. Add 1 ml of 80% methanol to each sample. 5. Vortex at high speed for thirty minutes. 6. Centrifuge at 2,500 x g for 20 minutes. 7. Transfer each supernatant to a clean test tube.
8. Evaporate methanol under a gentle stream of nitrogen. Alternatively,
samples can be measured without drying provided that they will be diluted
at least 1:50 in ELISA Buffer prior to assay.
9. Suspend dried samples in 500 µl of ELISA Buffer. The samples are now ready for use in the ELISA.
Level Average (pg/mg) %CV Intra-assay variation Average (pg/mg) %CV Inter-assay variation High 723 3.8 739 6.7 Medium 271 4.8 286 8.6 Low 178 5.4 201 9.8
Table 2. Mouse fecal sample validation
Mouse fecal samples containing a high, medium, or low level of corticosterone were measured 60 times each using a single set of reagents. The calculated %CV is reported as intra-assay variance. A separate series of mouse fecal samples containing a high, medium, or low level of corticosterone were measured four times each using eight independent sets of reagents. The calculated %CV is
20
ASSAY PROTOCOL ASSAY PROTOCOL21
ASSAY PROTOCOL
Preparation of Assay-Specific Reagents
Corticosterone ELISA Standard
Equilibrate a pipette tip in ethanol by repeatedly filling and expelling the tip with ethanol several times. Using the equilibrated pipette tip, transfer 100 µl of the Corticosterone ELISA Standard (Item No. 400657) into a clean test tube, then dilute with 900 µl UltraPure water. The concentration of this solution (the bulk standard) will be 50 ng/ml. Store this solution at 4°C; it will be stable for at least six weeks.
NOTE: If assaying culture medium samples, culture medium should be used in place of ELISA Buffer for dilution of the standard curve and samples.
To prepare the standard for use in ELISA: obtain eight clean test tubes and number them #1 through #8. Aliquot 900 µl ELISA Buffer to tube #1 and 750 µl ELISA Buffer to tubes #2-8. Transfer 100 µl of the bulk standard (50 ng/ml) to tube #1 and mix thoroughly. Serially dilute the standard by removing 500 µl from tube #1 and placing in tube #2; mix thoroughly. Next, remove 500 µl from tube #2 and place it into tube #3; mix thoroughly. Repeat this process for tubes #4-8. These diluted standards should not be stored for more than 24 hours.
500 ng/ml Standard 100 µl 500 µl 500 µl 500 µl 500 µl 500 µl 500 µl 900 µl ELISA Buffer 750 µl ELISA Buffer Final 5,000 pg/ml S1 S2 S3 S4 S5 S6 S7 S8 2,000 pg/ml pg/ml800 pg/ml320 pg/ml128 pg/ml51.2 pg/ml20.5 pg/ml8.2 750 µl ELISA Buffer 750 µl ELISA Buffer 750 µl ELISA Buffer 750 µl ELISA Buffer 750 µl ELISA Buffer 750 µl ELISA Buffer 500 µl 100 µl 900 µl UltraPure H2O 50 ng/ml Bulk Standard
Figure 4. Preparation of the corticosterone standards
Corticosterone AChE Tracer
Reconstitute the Corticosterone AChE Tracer as follows:
100 dtn Corticosterone AChE Tracer (96-well kit; Item No. 401320): Reconstitute with 6 ml ELISA Buffer.
OR
500 dtn Corticosterone AChE Tracer (480-well kit; Item No. 401320): Reconstitute with 30 ml ELISA Buffer.
Store the reconstituted Corticosterone AChE Tracer at 4°C (do not freeze!) and
use within four weeks. A 20% surplus of tracer has been included to account for
any incidental losses.
Corticosterone ELISA Antiserum
Reconstitute the Corticosterone ELISA Antiserum as follows:
100 dtn Corticosterone ELISA Antiserum (96-well kit; Item No. 401322): Reconstitute with 6 ml ELISA Buffer.
OR
500 dtn Corticosterone ELISA Antiserum (480-well kit; Item No. 401322): Reconstitute with 30 ml ELISA Buffer.
Store the reconstituted Corticosterone ELISA Antiserum at 4°C. It will be stable for at least four weeks. A 20% surplus of antiserum has been included to account for any incidental losses.
22
ASSAY PROTOCOL ASSAY PROTOCOL23
Plate Set Up
The 96-well plate(s) included with this kit is supplied ready to use. It is not necessary to rinse the plate(s) prior to adding the reagents. NOTE: If you do not
need to use all the strips at once, place the unused strips back in the plate packet and store at 4°C. Be sure the packet is sealed with the desiccant inside.
Each plate or set of strips must contain a minimum of two blanks (Blks), two non-specific binding wells (NSBs), two maximum binding wells (B0s), and an
eight point standard curve run in duplicate. NOTE: Each assay must contain this
minimum configuration in order to ensure accurate and reproducible results. Each sample should be assayed at two dilutions and each dilution should be assayed in duplicate. For statistical purposes, we recommend assaying samples in triplicate.
A suggested plate format is shown in Figure 5, below. The user may vary the location and type of wells present as necessary for each particular experiment. The plate format provided below has been designed to allow for easy data analysis using a convenient spreadsheet offered by Cayman (on page 26, for more details). We suggest you record the contents of each well on the template sheet provided (on page 34). Blk - Blank TA - Total Activity NSB - Non-Specific Binding B0 - Maximum Binding S1-S8 - Standards 1-8 1-24 - Samples A B C D E F G H 1 2 3 4 5 6 7 8 9 10 11 12 S1 S2 S3 S4 S5 S6 S7 S8 S8 S7 S6 S5 S4 S3 S2 S1 8 7 6 5 4 3 2 1 8 7 6 5 4 3 2 1 8 7 6 5 4 3 2 1 16 15 14 13 12 11 10 9 16 15 14 13 12 11 10 9 16 15 14 13 12 11 10 9 24 23 22 21 20 19 18 17 24 23 22 21 20 19 18 17 17 24 23 22 21 20 19 18 Blk Blk NSB NSB B0 B0 B0 TA
Figure 5. Sample plate format
Performing the Assay
Pipetting Hints
• Use different tips to pipette each reagent.
• Before pipetting each reagent, equilibrate the pipette tip in that reagent (i.e., slowly fill the tip and gently expel the contents, repeat several times).
• Do not expose the pipette tip to the reagent(s) already in the well(s).
Addition of the Reagents
1. ELISA Buffer
Add 100 µl ELISA Buffer to NSB wells. Add 50 µl ELISA Buffer to B0 wells.
If culture medium was used to dilute the standard curve, substitute 50 µl of culture medium for ELISA Buffer in the NSB and B0 wells (i.e., add 50 µl
culture medium to NSB and B0 wells and 50 µl ELISA Buffer to NSB wells). 2. Corticosterone ELISA Standard
Add 50 µl from tube #8 to both of the lowest standard wells (S8). Add 50 µl from tube #7 to each of the next two standard wells (S7). Continue with this
procedure until all the standards are aliquoted. The same pipette tip should
be used to aliquot all the standards. Before pipetting each standard, be sure
to equilibrate the pipette tip in that standard.
3. Samples
Add 50 µl of sample per well. Each sample should be assayed at a minimum of two dilutions. Each dilution should be assayed in duplicate (triplicate recommended).
4. Corticosterone AChE Tracer
Add 50 µl to each well except the TA and the Blk wells.
5. Corticosterone ELISA Antiserum
24
ASSAY PROTOCOL ASSAY PROTOCOL25
Well ELISA Buffer Standard/
Sample
Tracer Antiserum
Blk - - -
-TA - - 5 µl (at devl. step)
-NSB 100 µl - 50 µl
-B0 50 µl - 50 µl 50 µl
Std/Sample - 50 µl 50 µl 50 µl
Table 3. Pipetting summary
Incubation of the Plate
Cover each plate with plastic film (Item No. 400012) and incubate overnight at
4°C.
Development of the Plate
1. Reconstitute Ellman’s Reagent immediately before use (20 ml of reagent is sufficient to develop 100 wells):
100 dtn vial Ellman’s Reagent (96-well kit; Item No. 400050): Reconstitute
with 20 ml of UltraPure water.
OR
250 dtn vial Ellman’s Reagent (480-well kit; Item No. 400050): Reconstitute
with 50 ml of UltraPure water.
NOTE: Reconstituted Ellman’s Reagent is unstable and should be used the same day it
is prepared; protect the Ellman’s Reagent from light when not in use. Extra vials of the
reagent have been provided should a plate need to be re-developed or multiple assays be run on different days.
2. Empty the wells and rinse five times with Wash Buffer. 3. Add 200 µl of Ellman’s Reagent to each well.
4. Add 5 µl of tracer to the TA well.
5. Cover the plate with plastic film. Optimum development is obtained by
using an orbital shaker equipped with a large, flat cover to allow the plate(s)
to develop in the dark. This assay typically develops (i.e., B0 wells ≥0.3 A.U. (blank subtracted)) in 90-120 minutes.
Reading the Plate
1. Wipe the bottom of the plate with a clean tissue to remove fingerprints, dirt,
etc.
2. Remove the plate cover being careful to keep Ellman’s Reagent from
splashing on the cover. NOTE: Any loss of Ellman’s Reagent will affect the
absorbance readings. If Ellman’s Reagent is present on the cover, use a pipette
to transfer the Ellman’s Reagent into the well. If too much Ellman’s Reagent has
splashed on the cover to easily redistribute back into the wells, wash the plate
three times with wash buffer and repeat the development with fresh Ellman’s Reagent.
3. Read the plate at a wavelength between 405 and 420 nm (usually 412 nm). The absorbance may be checked periodically until the B0 wells
have reached a minimum of 0.3 A.U. (blank subtracted). The plate should be read when the absorbance of the B0 wells are in the range of 0.3-1.5 A.U. (blank subtracted). If the absorbance of the wells exceeds 2.0, wash the plate, add fresh Ellman’s Reagent and let it develop again.
26
ANALYSIS ANALYSIS27
ANALYSIS
Many plate readers come with data reduction software that plot data automatically. Alternatively a spreadsheet program can be used. The data should be plotted as either %B/B0 versus log concentration using a four-parameter logistic fit or as logit B/B0 versus log concentration using a linear fit. NOTE: Cayman has a computer spreadsheet available for data analysis. Please contact Technical Service or visit our website (www.caymanchem.com/analysis/elisa) to obtain a free copy of this convenient data analysis tool.
Calculations
Preparation of the Data
The following procedure is recommended for preparation of the data prior to
graphical analysis.
NOTE: If the plate reader has not subtracted the absorbance readings of the blank
wells from the absorbance readings of the rest of the plate, be sure to do that now.
1. Average the absorbance readings from the NSB wells. 2. Average the absorbance readings from the B0 wells.
3. Subtract the NSB average from the B0 average. This is the corrected B0 or
corrected maximum binding.
4. Calculate the B/B0 (Sample or Standard Bound/Maximum Bound) for the remaining wells. To do this, subtract the average NSB absorbance from the S1 absorbance and divide by the corrected B0 (from Step 3). Repeat for S2-S8 and all sample wells. (To obtain %B/B0 for a logistic four-parameter fit, multiply these values by 100.)
NOTE: The TA values are not used in the standard curve calculations. Rather, they are used as a diagnostic tool; the corrected B0 divided by the actual TA (10X measured absorbance) will give the %Bound. This value should closely approximate the %Bound that can be calculated from the Sample Data (see page 28). Erratic absorbance values and a low (or no) %Bound could indicate the presence of organic solvents in the buffer
or other technical problems (see page 32 for Troubleshooting).
Plot the Standard Curve
Plot %B/B0 for standards S1-S8 versus corticosterone concentration (usually in pg/ml) using linear (y) and log (x) axes and perform a 4-parameter logistic fit. Alternative Plot - The data can also be lineraized using a logit transformation. The equation for this conversion is shown below. NOTE: Do not use %B/B0 in this calculation.
logit (B/B0) = ln [B/B0/(1 - B/B0)]
Plot the data as logit (B/B0) versus log concentrations and perform a linear regression fit.
Determine the Sample Concentration
Calculate the B/B0 (or %B/B0) value for each sample. Determine the concentration of each sample using the equation obtained from the standard curve plot. NOTE: Remember to account for any concentration or dilution of the sample prior to the addition to the well. Samples with %B/B0 values greater than 80% or less than 20% should be re-assayed as they generally fall out of the linear range of the standard curve. A 20% or greater disparity between the apparent concentration of two different dilutions of the same sample indicates interference which could be eliminated by purification.
Spiked-Sample Recovery Calculation
Corticosterone (pg) in purified sample = Value from ELISA (pg/ml)
Corticosterone in sample (pg/ml) = Recovery Factor
]
[
x reconstituted volume of sample - added [3H]-Corticosterone (pg)Corticosterone (pg) in purified sample Volume of sample used for purification (ml) Recovery Factor = 10X cpm of sample
28
ANALYSIS ANALYSIS29
Performance Characteristics
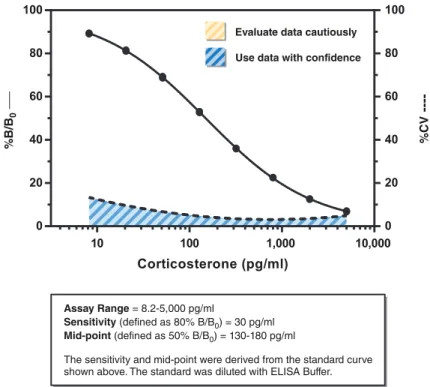
Sample Data
The standard curve presented here is an example of the data typically produced with this kit; however, your results will not be identical to these. You must run a
new standard curve. Do not use the data below to determine the values of your samples. Your results could differ substantially.
Raw Data Average Corrected
Total Activity 0.419 0.351 0.385
NSB 0.001 0.001 0.001
B0 1.456 1.463
1.476 1.445 1.460 1.459
Dose (pg/ml) Raw Data Corrected %B/B0
5,000 0.099 0.107 0.098 0.106 6.7 7.2 2,000 0.184 0.187 0.183 0.186 12.5 12.7 800 0.329 0.333 0.328 0.332 22.4 22.7 320 0.528 0.525 0.527 0.524 36.1 35.9 128 0.777 0.769 0.776 0.768 53.2 52.6 51.2 1.014 1.003 1.013 1.002 69.4 68.7 20.5 1.192 1.183 1.191 1.182 81.7 81.0 8.2 1.301 1.307 1.300 1.306 89.1 89.5
Table 4. Typical results
%B/B 0 ____ %CV ----Assay Range = 8.2-5,000 pg/ml Sensitivity (defined as 80% B/B0) = 30 pg/ml Mid-point (defined as 50% B/B0) = 130-180 pg/ml
The sensitivity and mid-point were derived from the standard curve shown above. The standard was diluted with ELISA Buffer.
0 20 40 60 80 100 0 20 40 60 80 100 Corticosterone (pg/ml) 10 100 1,000 10,000
Evaluate data cautiously Use data with confidence
30
ANALYSIS ANALYSIS31
Precision:
The intra-assay CVs have been determined at multiple points on the standard curve. These data are summarized in the graph on page 29 and in the table below.
Dose (pg/ml) %CV* Intra-assay variation 5,000 6.0 2,000 2.1 800 2.7 320 4.3 128 4.9 51.2 5.7 20.5 11.6 8.2 12.3
Table 5. Intra-assay variation
*%CV represents the variation in concentration (not absorbance) as determined using a reference standard curve.
Cross Reactivity:
Compound Cross Reactivity
Corticosterone 100% 11-Deoxycorticosterone 15.8% Prednisolone 3.4% 11-Dehydrocorticostone 2.9% Cortisol 2.5% Progesterone 1.4% Aldosterone 0.47% 17α-Hydroxyprogesterone 0.21% 11-Deoxycortisol 0.14% Androstenedione 0.11% Testosterone 0.07% Pregnenolone 0.03% DHEA sulfate 0.0005% 5α-DHT <0.01% 17α-Hydroxypregnenolone <0.01% Androstenediol <0.01% DHEA <0.01% Estradiol <0.01% Estriol <0.01% Estrone sulfate <0.01% Ethynylestradiol <0.01% Dexamethasone <0.01%
32
RESOURCES RESOURCES33
RESOURCES
Troubleshooting
Problem Possible Causes Recommended Solutions
Erratic values; dispersion
of duplicates A. Trace organic contaminants in the water source B. Poor pipetting/technique
A. Replace activated carbon filter or change source of UltraPure water High NSB (>10% of B0) A. Poor washing
B. Exposure of NSB wells to specific antibody
A. Re-wash plate and redevelop Very low B0 A. Trace organic contaminants
in the water source B. Plate requires additional
development time C. Dilution error in preparing
reagents A. Replace activated carbon filter or change source of UltraPure water B. Return plate to
shaker and re-read later
Low sensitivity (shift in
dose response curve) Standard is degraded Replace standard Analyses of two dilutions
of a biological sample do not agree (i.e., more than 20% difference)
Interfering substances are
present Purify sample prior to analysis by ELISA13
Only Total Activity (TA)
wells develop Trace organic contaminants in the water source Replace activated carbon filter or change source of UltraPure water
References
1. Goymann, W., Möstl, E., and Gwinner, E. The Auk119(4), 1167-1173 (2002).
2. Washburn, B.E., Morris, D.L., Millspaugh, J.J. , et al.The Condor104, 558-63
(2002).
3. Evans, M.R., Roberts, M.L., Buchanan, K.L., et al.J. Evol. Biol.19(2), 343-52
(2005).
4. Martínex-Cué, C., Rueda, N., Garcia, E., et al.Genes Brain Behav.5, 413-422
(2006).
5. Meijer, M.K., Lemmens, A.G., and Van Zutphen, B.F.M. J. Appl. Anim. Welf. Sci. 8(4), 279-283 (2005).
6. Möstl, E., Rettenbacher, S., and Palme, R. Ann. N. Y. Acad. Sci.1046, 17-34
(2005).
7. Bortolotti, G.R., Marchant, T.A., Blas, J., et al.Funct. Ecol.22, 494-500 (2008). 8. Vázquez-Palacios, G., Retana-Márquez, S., Bonilla-Jaime, H., et al.Pharmacol.
Biochem. Behav.70, 305-310 (2001).
10. Miller, W.L. and Tyrrell, J.B. Chapter 12, in Endocrinology and Metabolism.
Felig, P., Baxter, J.D., and Frohman, L.A., editors, 3rd edition, McGraw-Hill, Inc. Health Professions Division, New York, 555-711 (1995).
11. Maclouf, J., Grassi, J., and Pradelles, P. Chapter 5, in Prostaglandin and Lipid Metabolism in Radiation Injury. Walden, T.L., Jr. and Hughes, H.N., editors, Plenum Press, Rockville, 355-364 (1987).
12. Pradelles, P., Grassi, J. and Maclouf, J. Anal. Chem.57, 1170-1173 (1985). 13. Maxey, K.M., Maddipati, K.R. and Birkmeier, J. J. Clin. Immunoassay 15,
34
A
RESOURCESB
C
D
RESOURCES35
E
F
G
H
12
34
56
78
91
01
11
2
NOTES
Warranty and Limitation of Remedy
Buyer agrees to purchase the material subject to Cayman’s Terms and Conditions. Complete Terms and Conditions including Warranty and Limitation of Liability information can be found on our website.
This document is copyrighted. All rights are reserved. This document may not, in whole or part, be copied, photocopied, reproduced, translated, or reduced to any
electronic medium or machine-readable form without prior consent, in writing, from Cayman Chemical Company.
©07/07/2016, Cayman Chemical Company, Ann Arbor, MI, All rights reserved. Printed in U.S.A.