DEPARTMENT OF ECONOMICS AND FINANCE
COLLEGE OF BUSINESS AND ECONOMICS
UNIVERSITY OF CANTERBURY
CHRISTCHURCH, NEW ZEALAND
Wolves in the Hen-House? The Consequences
of Formal CEO Involvement in the Executive
Pay-Setting Process
Glenn Boyle and Helen Roberts
WORKING PAPER
No. 45/2010
Department of Economics and Finance
College of Business and Economics
University of Canterbury
Private Bag 4800, Christchurch
Wolves in the Hen-House? The Consequences
of Formal CEO Involvement in the Executive
Pay-Setting Process
∗
Glenn Boyle
†Department of Economics and Finance University of Canterbury
Helen Roberts
Department of Finance and Quantitative Analysis University of Otago
July 29, 2010
∗For helpful comments on earlier versions of this paper, we are grateful to Henk Berkman, Rick Boebel,
Stu Gillan, seminar attendees at Otago University, and session participants at the 2009 New Zealand Finance Colloquium and the 2010 Finance and Corporate Governance Conference (Melbourne). Thanks also to Richa Jain for valuable research assistance, to the Targeted Research Development Assistance programme at the University of Otago for funding part of the data collection, and to the New Zealand Institute for the Study of Competition and Regulation for additional financial support. Any remaining errors or ambiguities are solely our responsibility.
†Corresponding author: Private Bag 4800, Christchurch 8140, New Zealand. Phone: 64-3-364-3479;
Wolves in the Hen-House? The
Consequences of Formal CEO Involvement
in the Executive Pay-Setting Process
Abstract
New Zealand firms exhibit significant variation in the extent to which they formally involve CEOs in the executive pay-setting process: a considerable number sit on the compensation committee, while others are excluded from the board altogether. Using 1997-2005 data, we find that CEOs who sit on the compensation committee obtain generous annual pay rewards that have low sensitivity to poor performance shocks. By contrast, CEOs who are not board members receive pay increments that have low mean and high sensitivity to firm performance. Moreover, the greater the pay increment attributable to CEO involvement in the pay-setting process, the weaker is subsequent firm performance over one, three- and five-year periods.
JEL classification: G34, J33
Wolves in the Hen-House? The
Consequences of Formal CEO Involvement
in the Executive Pay-Setting Process
1
Introduction
How important is Chief Executive Officer (CEO) participation in the executive pay-setting process? For example, CEO membership of the firm’s compensation committee would seem to represent a significant departure from the ‘arms-length bargaining’ model envisaged by agency theory, and hence create the potential for opportunistic CEO behaviour. On the other hand, Jensen et al. (2004) claim that even when not a member, CEOs tend to be fully involved in most compensation committee discussions. Viewed in this light, explicit membership of the compensation committee might seem to be of only minor importance. Similarly, CEOs who are not part of the board of directors would appear to be in a relatively weak bargaining position when it comes to negotiating their personal remuneration, but other internal chains of communication may compensate for this lack of direct influence. An obvious question of interest is whether such formal distinctions in participation have real consequences for pay outcomes, or whether they simply reflect titles that lack any significant economic substance. In short, does the extent of formal CEO involvement in boardroom discussions of executive remuneration influence eventual pay outcomes?
Any attempt to address this question empirically requires data containing mean-ingful variation in the extent of formal CEO involvement in the pay-setting process. Such heterogeneity is not always present: in the United States, for example, CEO board mem-bership is virtually automatic, while memmem-bership of the compensation committee is ex-tremely rare.1 One country where the required variation in CEO involvement clearly exists
is New Zealand (NZ): CEO membership of the compensation committee is by no means uncommon in NZ firms while, at the other end of the spectrum, a significant number of CEOs are excluded from the board altogether. The end result is a setting where the range of formal CEO involvement in boardroom discussions about pay is wide, thus permitting a relatively powerful test of the importance of such involvement in the executive pay-setting process.
1See, for example, Anderson and Bizjak (2003), Klein (1998), Newman and Mozes (1999) and Vafeas
(2003). As a result, most studies (e.g., Anderson and Bizjak; Daily et al., 1998; Newman and Mozes; Sun and Cahan, 2009) focus on the governance and pay-setting implications of broader measures of compensation committee makeup and independence.
In our sample of NZ listed firms during the 1997–2005 period, approximately 1/3 ap-point their CEO to the compensation committee, while slightly less than 1/4 are excluded from the board altogether. Relative to firm performance, CEOs in the former group are generously rewarded, and are well insulated from poor performance. By contrast, firms in the latter group receive compensation increments that are both less generous on average and more sensitive to firm performance. Moreover, these differences appear to matter for subsequent firm performance – the greater the predicted quantity of CEO pay growth attributable to formal CEO involvement in the pay-setting process, the lower are future firm stock returns over one-, three- and five-year horizons. Overall, these results provide evidence that differences in the extent of formal CEO participation in the pay-setting process can have real economic consequences.
In the next section, we describe our data sources and properties. Section 3 con-tains our results linking CEO pay outcomes to participation in the pay-setting process, while section 4 considers the impact of such participation on subsequent firm performance. Finally, section 5 offers some concluding remarks.
2
Data
Our initial sample consists of companies listed on the NZ Stock Exchange (NZX) between 1997 and 2005. We begin in 1997 because NZ firms were not required to disclose executive compensation details prior to that time.2 Compensation and governance information come from a hand-collected dataset obtained from company annual reports. Older reports were obtained from the annual reports collection in the now-defunct Commerce Resource Li-brary at Otago University; more recent report information comes from the NZX Company Research database. Stock return data, including adjustment factors, were sourced from the Otago University Sharemarket Database, with supplementation from NZX. In each year, firms were excluded from the sample if (i) there was missing information, (ii) they were only listed on the secondary board, (iii) they delisted during the year, or (iv) the CEO was not in office for the entire current and previous year. The final sample consists of 502 firm-year observations for 114 different NZX firms over the nine year period be-tween 1997 and 2005. With 55 such observations in 1997, this leaves 447 ‘first-difference’ observations over the sample period.
We focus on what Newman and Mozes (1999) call ‘firm-awarded’ compensation, i.e., remuneration that is under the direct control of the firm. This has two components: (i) salary, bonus and allowances, and (ii) new stock and option grants. NZ annual reports directly provide, in a manner to be described below, data on the first component. They also report information on any stock or option grants made during the year, which in
principle allows estimation of the second. However, stock and option awards occur infre-quently in NZ firms during the sample period (11% of firm-years) and are of minor value (approximately 6.4% of the value of component (i) for the firms where we are able to value option grants). Moreover, 36 option grants in our sample are unable to be valued due to insufficient information being reported. Given the relatively low importance of such grants in NZ, we avoid any further reduction in sample size by henceforth confining our attention to component (i). We examine the importance of this restriction in section 3
NZ compensation disclosure requires that the sum of salary, bonus, superannuation, health insurance coverage, and motor vehicle allowance be reported in the following ways. For executives who are members of the board of directors, the exact value of this remu-neration appears in a separate table of the annual report. For other employees, individual details are not reported, only the number of workers receiving remuneration lying within each $10,000 interval over and above $100,000 per annum. Consequently, we record com-pensation for any CEO not on the board of directors as being equal to the midpoint of the highest payment band.3 For example, if the CEO is not a member of the board of
directors and the maximum remuneration band in the annual report is $150,000-160,000, then CEO compensation for that firm-year is estimated to be $155,000.4
For each firm–year, we collect performance and governance data. To proxy for performance, we employ two measures. First, the firm’s one-year market-adjusted stock return — the difference between the firm’s stock return over the year and the aggregate stockmarket return (calculated using the broad-based All Ordinaries Index). Second, because the relatively small and illiquid nature of NZ capital markets means that NZ firms may reward factors other than stock market performance, we also use the firm’s one-year return on assets (ROA) – the ratio of after-tax profit to total assets. We also record the extent of the CEO’s formal involvement in the pay-setting process: a member of the compensation committee as well as the board (157 firm-years), a member of the board only (186), not a board member (104). CEOs who sit on the compensation committee might be expected to have a particularly strong influence on the compensation process, while those who are excluded from the board may be in the opposite situation.
Some summary statistics for various pay and performance variables appear in Table 1. Across the whole sample, firms on average achieve an annual stock return of 17%, while CEOs receive compensation that grows by 11.34% per annum. By contrast, the average ROA is a miserable -16%, an outcome that is largely due to a sizable number of asset write-downs during the middle part of our sample period. More interesting are the differences between the three categories of formal CEO involvement in the pay-setting 3Exceptions to this rule occasionally occur when when there are identifiable employees who receive
special retirement or redundancy payments that take them into the top band.
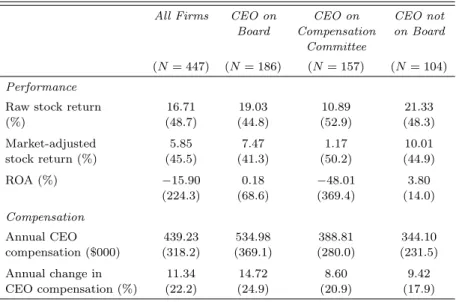
Table 1: Summary Statistics
This table reports means and standard deviations (in parentheses) for pay and performance measures from listed New Zealand firms between 1997 and 2005. Raw stock return is the annual percentage change in firm value; market-adjusted stock return is raw stock return minus the return on the market index; ROA is after-tax profits divided by total assets. Annual compensation is the sum of salary, bonus, superannuation, health insurance coverage, and motor vehicle allowance. The first column reports statistics based on all firm-years appearing in the sample, while the remaining columns focus on three subsets: CEOs who sit on the board of directors, but not the compensation committee, CEOs who sit on both the board and the compensation committee, and CEOs who sit on neither.
All Firms CEO on CEO on CEO not Board Compensation on Board
Committee
(N= 447) (N= 186) (N= 157) (N= 104)
Performance
Raw stock return 16.71 19.03 10.89 21.33 (%) (48.7) (44.8) (52.9) (48.3) Market-adjusted 5.85 7.47 1.17 10.01 stock return (%) (45.5) (41.3) (50.2) (44.9) ROA (%) −15.90 0.18 −48.01 3.80 (224.3) (68.6) (369.4) (14.0) Compensation Annual CEO 439.23 534.98 388.81 344.10 compensation ($000) (318.2) (369.1) (280.0) (231.5) Annual change in 11.34 14.72 8.60 9.42 CEO compensation (%) (22.2) (24.9) (20.9) (17.9)
process. CEOs who sit on the compensation committee receive thelowestannual growth in compensation, but the firms they lead also perform significantly less well. Indeed, the pay differences are small relative to the performance differences, suggesting that CEOs who sit on the compensation committee may be successful in decoupling their pay from firm performance. At the other end of the scale, CEOs who are not on the board lead the best-performing firms, but receive relatively little reward for doing so. Both these observations suggest that formal CEO participation in the pay-setting process can influence the eventual outcome. In order to shed more light on this issue, we must estimate the link between pay and performance for each of the different classes of firm, a task to which we now turn.
3
Results
CEOs who sit on their own compensation committees have the potential to advance their own interests at the expense of stockholders, either by achieving greater overall pay, or by decoupling their pay from firm performance in a self-beneficial manner, or both. Even
when such CEOs are excluded from discussions relating to their own remuneration, their compensation committee membership can still be advantageous: for example, by the ne-gotiation of favorable pay structures and packages for their subordinate executives – which then need to be passed on to CEOs in order to maintain ‘relativity’. By contrast, CEOs who are excluded from the board altogether would seem to have little ability to influence the pay-setting process in their favor.
To investigate the possibility that greater CEO involvement in the pay-setting pro-cess has implications for compensation structure, we regress annual CEO pay increments on firm performance and allow for different intercept and slope coefficients reflecting the extent of CEO involvement. Because NZ firms are relatively small, we estimate the pay-performance sensitivity in elasticity form so as to counter the observed tendency for the dollar sensitivity to decline with firm size – see, for example, Jensen and Murphy (1990), Gibbons and Murphy (1992), and Schaefer (1998). Thus, our regression models have the general form:
∆P ay = α0+α1R +α2DH+α3DL+α4(DH∗R) +α5(DL∗R) + (1)
where:
∆P ay= annual change in the natural log of CEO pay;
R = annual firm performance, defined either as ROA or as the natural log of (firm value/stock market index);
DH = 1 if the CEO sits on the compensation committee and 0 otherwise;
DL= 1 if the the CEO does not sit on the board of directors and 0 otherwise.
In equation (1), α1 is the performance-related growth in pay for CEOs who are on the
board, but not the compensation committee;α4andα5represent the incremental effects of
being on the compensation committee and not being on the board respectively. Similarly,
α0is the component of pay growth that is unrelated to performance for board-only CEOs,
andα2andα3are the corresponding incremental effects associated with the other two
sub-groups. Our primary interest is in the estimates of these incremental-variable coefficients. The results obtained from estimating equation (1) appear in Table 2. All reported models also include a full set of time dummies (1998 being the excluded year), and because some CEOs appear in the data multiple times we estimate robust standard errors that allow for clustering at the firm level. In the first two columns, we suppress the dummy variablesDH andDL and include only firm performance as an explanatory variable. The
resulting coefficient estimates are statistically significant (at the 1% level for the stock market measure and at the 7% level for ROA), but are economically small compared to those previously obtained from US data. For example, three representative US-based studies that estimate the elasticity form of the pay-stockmarket performance sensitivity
– Murphy (1985), Hall and Liebman (1998) and Zhou (1999) – report estimates ranging from 0.16 to 0.23, two to three times the NZ value. A lower average sensitivity is what would be expected if the sub-group of CEOs on the compensation committee behave opportunistically to divorce their remuneration from firm performance.
Table 2: Pay, Performance and CEO Influence: Regression Results
The dependent variable is the annual change in the natural logarithm of CEO pay. Firm performance is either the annual change in the natural logarithm of firm value minus the annual change in the natural logarithm of the stock market index (‘Market’ columns) or the ratio of after-tax profits to total assets (‘ROA’ columns). All regressions include a full set of year dummies (1998 being the omitted year). Terms in parentheses arep-values based on robust standard errors clustered at the firm level.
Firm Performance Measure
Market ROA Market ROA Market ROA Variable (1) (2) (3) (4) (5) (6) Intercept 0.107 0.108 0.131 0.140 0.139 0.140 (0.00) (0.00) (0.00) (0.00) (0.00) (0.00) Firm performance 0.079 0.006 0.122 0.045 0.122 0.045 (0.01) (0.07) (0.00) (0.00) (0.00) (0.00) CEO on Compensation −0.042 −0.055 −0.084 −0.070 Committee (0.01) (0.01) (0.00) (0.01) CEO not on Board −0.040 −0.062 −0.044 −0.038 of Directors (0.04) (0.00) (0.04) (0.20) Firm performance −0.074 −0.042
*CEO on Compensation (0.23) (0.00) Committee
Firm performance −0.057 0.228 *CEO not on Board (0.38) (0.03)
Firm performance≥0 0.103 0.218 *CEO on Compensation (0.19) (0.39) Committee Firm performance<0 −0.164 −0.042 *CEO on Compensation (0.06) (0.00) Committee Firm performance≥0 −0.033 −0.097 *CEO not on Board (0.74) (0.78) Firm performance<0 −0.069 0.329 *CEO not on Board (0.50) (0.00) R2 0.04 0.02 0.06 0.05 0.07 0.05 Year Fixed Effects Yes Yes Yes Yes Yes Yes
The third and fourth columns in Table 2 explores this idea more directly by esti-mating the full version of equation (1), i.e., with separate coefficient estimates conditioned on CEO involvement in the pay-setting process. This modification reveals some interest-ing phenomena. First, the estimated intercept coefficients are significantly lower for both CEOs who are on the compensation committee and those who are not on the board at
all, consistent with both groups having a larger fraction of their average pay increments linked to firm performance in some way. Second, for CEOs who are on the board but not the compensation committee (the typical US situation), the estimated sensitivity of pay to stock market performance is 0.122, much closer to the US-based estimates noted above. Third, the estimated sensitivity of CEO pay to ROA (but not to stock market returns) is significantly lower for CEOs who sit on the compensation committee and significantly
higher for CEOs who are excluded from the board altogether. These latter differences are economically large: the average pay-performance sensitivity of CEOs who sit on the compensation committee is essentially zero, while those who are excluded from the board have an average sensitivity that is approximately five times as great as those who are board members.5 Thus, high- and low-influence CEOs appear to face very different levels
of exposure to firm accounting performance.6
More detailed insights into the differences between the three groups can be obtained by considering some quantitative implications of Table 2. First, to highlight ‘excess’ expected pay differences between the three categories of formal CEO involvement, we set
Requal to its respective sample mean for each category, calculate the pay growth predicted by columns (3) or (4) of Table 2, and then subtract the corresponding mean value ofR. Second, we compare the performance sensitivities of each category by calculating the change in predicted pay growth resulting from a common performance shock (plus or minus one standard deviation of the corresponding performance measure). Finally, as we are primarily interested in the ‘incremental’ effect of high or low participation in the pay-setting process, we normalise each category’s value of these statistics by the corresponding value for the CEO-on-board category.
The results of these exercises appear in Table 3. Compared to CEOs who sit only on the board, CEOs who are also compensation committee members receive annual pay increments that are up to four times more generous relative to average performance, and only 39-45% as sensitive to fluctuations in firm performance. By contrast, the average non-board CEO obtains annual pay increments that are only half as generous relative to average performance and are more sensitive to fluctuations in firm ROA (but not to fluctuations in market-adjusted stock returns).
In summary, the impression created by Tables 2 and 3 is that, relative to ‘normal’-participation CEOs (i.e., those who sit on the board but not the compensation committee) (i) high-involvement CEOs obtain annual pay rewards that have high mean (at least relative to the performance of such firms) and low performance-sensitivity, and (ii) low-5For the stock return performance measure, the sensitivity differences across the three groups are
economically large, but very imprecisely estimated.
6The overall explanatory power of these models – as measured byR2– is low, suggesting that relatively
little of the total variation in CEO pay can be attributed to performance issues. This is similar to the findings of Jensen and Murphy (1990), Schaefer (1998) and Zhou (1999).
involvement CEOs receive pay increments that have low mean and high performance-sensitivity.7
To investigate these issues further, we re-estimate equation (1) allowing for differ-ent performance coefficidiffer-ents in good- and bad-performance states. For rational, risk-averse executives, a lower sensitivity of pay to performance is strictly attractive only when firm performance is poor; when performance is strong, CEOs will prefer as high a sensitivity as possible. Columns (5) and (6) of Table 2 reveal two striking asymmetries of exactly this kind, particularly for the more precisely-estimated ROA-based models. First, the incre-mental effect of compensation committee membership on the pay-performance sensitivity is significantly negative when returns are negative, but is insignificantly different from zero when returns are positive. Summing the point estimates in column (6), CEOs who sit on the compensation committee receive on average an extra 0.263 percentage point pay increment for every additional percentage point of positive ROA, but the corresponding penalty for negative ROA is only 0.003 percentage points. This result provides further evidence that compensation committee membership may allow CEOs to reap the benefits of good performance while avoiding the costs of poor performance.
Second, CEOs who do not sit on the board find themselves in the opposite position: the incremental effect of board exclusion on the pay-performance sensitivity is significantly positive when returns are negative, but is insignificantly different from zero when returns are positive. That is, compared to CEOs with a seat on the board, non-board CEOs are penalized for poor performance but receive no additional reward for good performance. Thus, having no input at all into the pay-setting process may be a significant disadvantage when it comes to negotiating remuneration.8
One possible problem with these results is that they may be due to within-sample correlation between the extent of formal CEO involvement in the pay-setting process and other firm attributes that have an effect on compensation structure. For example, Holm-strom and Milgrom (1987) show, with supporting evidence from Aggarwal and Samwick (1999), that the optimal sensitivity of pay to performance is a decreasing function of firm risk – if the firm is high risk, then realised firm performance is a noisy indicator of CEO effort and high-powered incentives are economically inefficient. Similarly, John and John 7We also experimented with other specifications. For example, a small number of CEOs on occasions
attend meetings of the compensation committee despite not being committee members, so we re-defined
DH using this ‘de facto’ measure of involvement. We also tried using the firm’s raw stock return as an
alternative measure of firm performance. None of these adjustments had any significant impact on our results.
8As noted in the discussion of Table 1, the average ROA of our sample firms is low due to a proliferation
of asset write-downs during the middle part of our sample period. When the firm-years corresponding to the most extreme write-downs are excluded, some of the coefficient estimates in Table 2 become larger and/or more precisely estimated, some become smaller and/or less precisely estimated, but the overall tenor of our results is unaffected.
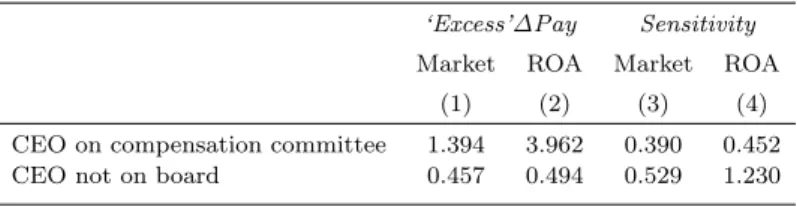
Table 3: CEO pay and participation in the pay-setting process: Quantitative evidence
This table provides, for the average CEO in each pay-setting participation group, some quan-titative implications of the results in column (2) of Table 2. Column (1) reports the difference between ∆Pay and firm performance for each incremental participation level, normalised by the corresponding difference for CEOs who are board members. So the first cell in column (1) indicates that, on average, CEOs who have membership of the compensation committee achieve 39% more ‘excess’ annual pay growth than do CEOs who sit only on the board. Column (2) reports the absolute value of a one standard deviation change in performance on annual pay growth for each incremental participation level, normalised by the corresponding value for CEOs who are board members.
‘Excess’∆Pay Sensitivity
Market ROA Market ROA (1) (2) (3) (4) CEO on compensation committee 1.394 3.962 0.390 0.452 CEO not on board 0.457 0.494 0.529 1.230
(1993) show that the optimal sensitivity is a decreasing function of firm leverage due to the risk-shifting incentives induced by debt. Thus, if either risk or leverage is significantly correlated in our sample with CEO participation in the pay-setting process, then some of our results above may be spurious.
To assess this possibility, we estimate firm risk as the annualised standard deviation of stock returns over the previous five years and leverage as the ratio of debt book value to the sum of debt book value and equity market value.9 Note that due to the
non-independence of annual observations from the same firm, we calculate and compare these variables at the firm level. For example, the leverage observation for a firm that is in our sample for the six years from 1998 to 2004 is calculated as the average of that firm’s leverage over those six years. If the firm changes categories during that period (e.g., from having its CEO on the compensation committee to not), then a separate calculation is made for each category. We then compare the median values (preliminary analysis indicated the presence of skewness) of these two variables for each of the three categories of CEO involvement in the pay-setting process.
Table 4 contains the results of this exercise. Relative to firms in which the CEO sits on the board only, firms that appoint their CEO to the compensation committee have slightly higher risk while firms whose CEO is not on the board have slightly lower risk. However, these differences are economically and statistically insignificant. Differences in leverage are greater, but both high and low participation groups have significantly lower leverage. That is, their leverage choices differ from those of the board-only participation 9Estimating firm risk as the annualised standard deviation of ROA over the previous five years, or
using equity book value in the calculation of leverage, yields virtually identical results to those appearing in Table 4.
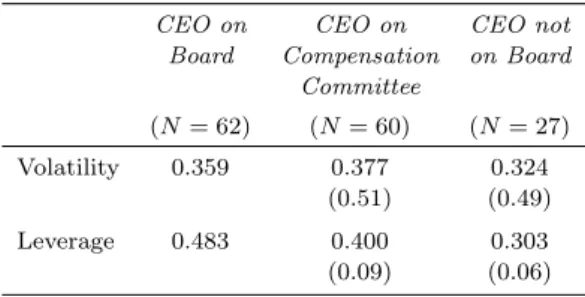
Table 4: Volatility, leverage and CEO participation in the pay-setting process
For each category of CEO participation in the pay-setting process, this table reports medians for two variables known to affect the structure of CEO remuneration. Volatility is the annualised standard deviation of stock returns over the previous five years; Leverage is the ratio of debt book value to the sum of debt book value and equity market value. Both variables are calculated at the firm level as an average over the years the firm appears in the sample. Terms in parentheses are Mann-Whitney p-values for a test of the hypothesis that the median value in the corresponding participation category is the same as in the ‘normal’ participation category.
CEO on CEO on CEO not Board Compensation on Board
Committee (N= 62) (N= 60) (N= 27) Volatility 0.359 0.377 0.324 (0.51) (0.49) Leverage 0.483 0.400 0.303 (0.09) (0.06)
group in the same direction, whereas the results in Tables 2 and 3 indicate that their remuneration structures differ in opposite directions. Thus, it seems unlikely that our principal results above can be attributed to differences in volatility or leverage.10
Finally in this section, we consider the possibility that our results are at least partly an artifact of our focus on cash, as opposed to total, compensation. It could be, for example, that our finding of a significantly negative pay-performance sensitivity in low-return states for CEOs who sit on their firm’s compensation committee is driven by the subset of firms that also award equity-based remuneration to their CEOs. For such firms, the cash pay-performance sensitivity will substantially understate the full effects of low returns on CEO remuneration, and thus the estimated negative coefficient may provide a misleading picture of the true incentives faced by CEOs. We therefore re-estimate the models appearing in Table 2 using the sub-sample of firms that never pay equity-based remuneration during the period covered by our data, i.e., the group of firms that pay only cash compensation. If our earlier results are simply the result of low cash pay-performance sensitivities in firms that also provide equity-based remuneration, then the same patterns should not show up in the ‘cash-only’ sub-sample. However, the results obtained from using this sub-sample are very similar to those appearing in Table 2: although some coefficients are less precisely estimated than previously due to the smaller sample sizes, our principal results are unaffected – CEOs who sit on the compensation committee are 10In unreported regressions, we include volatility and leverage as additional explanatory variables in our
earlier models, but, unsurprisingly in the light of Table 4, this has little effect on the results reported in Table 2.
treated generously relative to performance, and have a lower pay-performance sensitivity, particularly in low-return states. Thus, our results do not seem to be due to CEO pay mis-measurement.
4
Endogeneity, self-selection and subsequent firm
per-formance
We have thus far assumed that CEO involvement in the pay-setting process is exogenous, but this may not be the case. For example, the level of CEO involvement may be chosen by firms on the basis of perceived CEO talent or ability. In this case, the apparently generous treatment of CEOs who sit on their firms’ compensation committee may simply indicate an equilibrium response to a more difficult or complex job. Alternatively, CEOs of firms that are expected to perform poorly may demand both a more attractive remuneration package and greater powers and responsibilities, including board and committee seats, as compensation for the greater risk. In this case, the results above may be evidence only of optimal contracting by risk-averse CEOs.
To address these issues, we undertake two additional sets of tests. First, to check the possibility that the CEO involvement dummies DH and DL are simply proxying for
some unobservable aspect of CEO ability, we follow the two-stage procedure of Core et al (1999) in which subsequent firm performance is related to the component of CEO pay growth associated with the level of formal CEO involvement in the pay-setting process. More specifically, the first stage consists of using the estimated coefficients from models (5) and (6) in Table 3 to compute:
formal-involvement pay growth = αˆ2DH+ ˆα3DL+ ˆα4(DH∗R≥0)
+ ˆα5(DH∗R <0) + ˆα6(DL∗R≥0)
+ ˆα7(DL∗R <0) (2)
The second stage then involves estimating
subsequent firm = β0+β1(formal-involvement pay growth) +φX+µ (3)
performance
where subsequent firm performance is the average market-adjusted stock return for the one-, three-, or five-year period following the year in which compensation is received, and
Xis a vector of control variables that potentially affect subsequent firm performance. For the latter, we employ the same set of variables as used by Core et al: risk – equal to the standard deviation of the firm’s annual stock returns over the five-year period prior to the award of compensation; size – equal to the firm’s stock market value in the year prior to
the receipt of compensation; and the market-to-book ratio prevailing at the end of the year immediately prior to the awarding of compensation.11
The idea underlying this two-step procedure is that equation (2) calculates the predicted level of CEO pay growth directly attributable to formal CEO involvement in the pay-setting process. If greater involvement allows CEOs to benefit themselves at the expense of stockholders, then this variable should be negatively associated with the firm’s subsequent stock market performance, i.e., our estimate of β1 in equation (3) should be
negative. On the other hand, if greater CEO involvement is merely proxying for a more complex job and hence for higher equilibrium remuneration, then theβ1 estimate should
be zero or positive.
In applying equation (2), we use both the ROA and market-adjusted stock return measures ofR. For each resulting computation of involvement-based pay growth, we then estimate equation (3) over each of the three performance periods and report the results in Table 5. Both short-term (one-year) and medium-term (three-year) subsequent firm performance are negatively related to the formal-involvement component of pay growth at at least the 3% significance level, regardless of whether ROA or stock market returns are used to compute the formal-involvement pay growth variable. Quantitatively, a one stan-dard deviation increase in formal-involvement pay growth lowers subsequent performance by approximately 4% per year on average. The five-year performance case is more ambigu-ous: for formal-involvement pay growth computed from ROA, there is again a strongly significant negative relationship, but the relationship between five-year performance and the stock return version of formal-involvement pay growth is, while negative and of similar magnitude, statistically insignificant at conventional levels.
Overall, the results in Table 5 indicate that the portion of CEO pay growth at-tributable to formal CEO involvement in the pay-setting process has a significantly ad-verse effect on subsequent firm performance. This provides further evidence that CEO board and compensation committee membership is indicative of CEO self-interest, and is not, for example, simply proxying for CEO ability.
Finally, we examine the possibility that our results are an artifact of self-selection by risk-averse CEOs. For this, we use the two-stage model of Heckman (1979), in which the first stage estimates two selection equations for the choice of CEO participation in the pay-setting process (one each for the high- and low-influence categories), and the second stage uses the inverse Mills ratios generated by the first stage models as additional exogenous variables in the regression equation given by (1).12 That is, the second stage estimates
11We also include a full set of year dummies, with 1998 being the omitted year.
12See Li and Prabhala (2007) for a detailed discussion of applications of the Heckman procedure in
Table 5: CEO Involvement in the Pay-Setting Process and Subsequent Firm Performance
The dependent variable is the average market-adjusted stock return for the one-, three-, or five-year period following the year in which compensation is received. Involvement-based pay growth is the predicted level of CEO pay growth directly attributable to CEO involvement in the pay-setting process, and is computed from models (5) and (6) in Table 3 as:
involvement-based pay growth = αˆ2DH+ ˆα3DL+ ˆα4(DH∗R≥0) + ˆα5(DH∗R <0)
+ ˆα6(DL∗R≥0) + ˆα7(DL∗R <0)
In columns (1)-(3) below, Ris ROA; in columns (4)-(6), R is the annual change in the natural logarithm of firm value minus the annual change in the natural logarithm of the stock market index. Risk is the standard deviation of the firm’s annual stock returns over the five-year period prior to the award of compensation. Size is the firm’s stock market value and market-to-book is the firm’s ratio of market value to book value, both measured at the end of the year immediately prior to the awarding of compensation All regressions include a full set of year dummies (1998 being the omitted year). Terms in parentheses arep-values based on robust standard errors clustered at the firm level.
Measure ofRused in equation (2)
ROA ROA ROA Market Market Market
Duration of subsequent firm performance
1-year 3-year 5-year 1-year 3-year 5-year Variable (1) (2) (3) (4) (5) (6) Intercept 0.017 −0.475 −0.213 −0.025 −0.527 −0.274 (0.93) (0.11) (0.61) (0.90) (0.08) (0.53) Involvement-based −0.511 −0.463 −0.472 −1.346 −1.647 −1.411 pay growth (0.01) (0.00) (0.00) (0.03) (0.02) (0.14) Risk −0.317 −0.377 −0.823 −0.294 −0.348 −0.776 (0.01) (0.00) (0.00) (0.01) (0.00) (0.01) Size 0.014 0.043 0.036 0.015 0.044 0.038 (0.35) (0.05) (0.25) (0.31) (0.04) (0.22) Market-to-book −0.010 −0.013 −0.017 −0.009 −0.011 −0.015 (0.24) (0.18) (0.17) (0.27) (0.18) (0.22) R2 0.10 0.14 0.23 0.10 0.15 0.23
Year Fixed Effects Yes Yes Yes Yes Yes Yes N 437 394 241 437 394 241 the model: ∆P ay = α0+α1R +α2DH+α3DL+α4(DH∗R) +α5(DL∗R) +α6λ+α7γ+η (4) where: λ=DHλ1+ (1−DH)λ2,
andλ1 andλ2 are the inverse Mills ratios corresponding, respectively, to the CEO being
γ =DLγ1+ (1−DL)γ2,
andγ1 and γ2 are the inverse Mills ratios corresponding, respectively, to the CEO being
on and not being on the board.
Because the results from estimating equation (4) reinforce those appearing in section 3, we do not tabulate them. Nevertheless, it is worth noting the principal findings. First, bothλandγhave coefficient estimates that are statistically significant at the 5% level or better in some specifications, suggesting that self-selection effects are potentially important in explaining the relationship between CEO pay and influence. Second, however, this has no effect on the estimated coefficients for the CEO-involvement variables. Indeed, some of the regression variables of interest becomemore economically and statistically significant following the inclusion of the self-selection variables. For example, in column (3) of Table 2, theα3estimate becomes−0.253 with a p-value of 0.01, compared with the original values
of -0.04 and 0.04 respectively. Thus, accounting for self-selection appears, if anything, to provide even stronger support for our conclusions concerning the differences in pay structures across the three CEO participation categories.
5
Concluding Remarks
Much has been written about executive compensation, but surprisingly little is known about how this is affected by formal CEO involvement in the pay-setting process. We examine this issue using data from New Zealand, where there exists considerable variation in the extent of formal CEO involvement. We find that: (i) the average pay-performance sensitivity is relatively low in New Zealand, (ii) the sensitivity is lower in low-return years for CEOs who sit on the compensation committee, thus insulating them from poor firm performance, (iii) CEOs who do not sit on the board of directors are paid less generously on average and face a performance sensitivity that is higher in low-return years, and (iv) subsequent performance is weaker in firms where the predicted component of pay growth attributable to CEO involvement in the pay-setting process is high. Although any one part of this evidence is not necessarily compelling, together they form a picture of greater CEO involvement being associated with pay structures that benefit the CEO and hurt the stockholders. A potential implication is that jurisdictions which discourage CEO membership of the compensation committee and board may be better positioned to maximize stockholder wealth
Our focus has been on the implications of a particular governance arrangement for the efficiency of CEO pay structures. Another issue of interest is the effect of this arrange-ment on firm investarrange-ment and performance. Does, for example, CEO membership of the compensation committee, and the consequent ability to insulate one’s remuneration from firm performance, encourage the taking on of riskier investment projects and, hence, result
in more volatile firm performance? And perhaps more fundamentally, what determines the firm’s choice of CEO involvement in the board and compensation committee in the first place? Although such questions are beyond the scope of this paper, they may well be worthy of further research.
References
Aggarwal, Rajesh K. and Andrew A. Samwick, 1999, The other side of the trade-off: the impact of risk on executive compensation,Journal of Political Economy 107, 65–105. Anderson, Ronald C. and John M. Bizjak, 2003, An empirical examination of the role
of the CEO and the compensation committee in structuring executive pay, Journal of Banking and Finance 27, 1323–1348.
Andjelkovic, Aleksandar, Glenn Boyle, and Warren McNoe, 2002, Public disclosure of executive compensation: Do shareholders need to know? Pacific-Basin Finance Journal
10, 97–117.
Core, John E., Robert W. Holthausen, and David F. Larcker, 1999. Corporate gover-nance, chief executive officer compensation, and firm performance. Journal of Financial Economics 51, 371–406.
Daily, Catherine M., Jonathan L. Johnson, Alan E. Ellstrand, and Dan R. Dalton, 1998, Compensation committee composition as a determinant of CEO pay,Academy of Man-agement Journal41, 209–220.
Gibbons, Robert, and Kevin J. Murphy, 1992, Optimal incentive contracts in the presence of career concerns: theory and evidence,Journal of Political Economy 100, 468-505. Hall, Brian J., and Jeffrey B. Liebman, 1998, Are CEOs really paid like bureaucrats?,
Quarterly Journal of Economics113, 653–691.
Heckman, James, 1979, Sample selection bias as a specification error, Econometrica 47, 153–61.
Holmstrom, Bengt, and Paul R. Milgrom, 1987, Aggregation and linearity in the provision of intertemporal incentives,Econometrica 55, 303–328.
Jensen, Michael C. and Kevin J. Murphy, 1990, Performance pay and top-management incentives,Journal of Political Economy 98, 225–264.
Jensen, Michael C., Kevin J. Murphy and Eric G. Wruck, 2004, Remuneration: where we’ve been, how we got to here, what are the problems, and how to fix them, Available atSSRN: http://papers.ssrn.com/sol3/papers.cfm?abstract=561305.
John, Teresa A. and Kose John, 1994, Top-management compensation and capital struc-ture,Journal of Finance 48, 949–974.
Klein, April, 1998, Firm performance and board committee structure,Journal of Law and Economics 41, 275–303.
Li, Kai and N.R. Prabhala, 2007. Self-selection models in corporate finance,Handbook of Corporate Finance: Empirical Corporate Finance Vol. I (chapter 2), ed. B. E. Eckbo, Elsevier Science.
Murphy, Kevin J., 1985, Corporate performance and managerial remuneration,Journal of Accounting and Economics 7, 11–42.
Newman, Harry A., and Haim A. Mozes, 1999, Does the composition of the compensation committee influence CEO compensation practices? Financial Management 28, 41–53. Schaefer, Scott, 1998, The dependence of pay-performance sensitivity on the size of the
firm,Review of Economics & Statistics80, 436–443.
Sun, Jerry, and Steven Cahan, 2009, The effect of compensation committee quality on the association between CEO cash compensation and accounting performance, Corporate Governance: An International Review 17, 193–207.
Vafeas, Nikos, 2003, Further evidence on compensation committee composition as a de-terminant of CEO compensation,Financial Management 32, 53–70.
Zhou, Xianming, 1999, Executive compensation and managerial incentives: a comparison between Canada and the United States,Journal of Corporate Finance5, 277–301.