April 2015
Resources and Energy
Major Projects
Further Information
For more information on other Department initiatives please see the Department’s website at:
www.industry.gov.au/OCE Acknowledgements Project team: John Barber Kate Penney Ben Witteveen Kieran Bernie Gayathiri Bragatheswaran Kate Martin Tom Willcock Thomas Redmond
Cover image source:
Thinkstock
© Commonwealth of Australia 2015 ISSN 978-1-921812-77-4 [ONLINE] Vol. 5, no. 1
This work is copyright. Apart from any use as permitted under the Copyright Act 1968, no part may be reproduced or altered by any process without prior written permission from the Australian Government. Requests and inquiries concerning reproduction and rights should be addressed to:
Department of Industry and Science GPO Box 9839, Canberra ACT 2601
or by emailing chiefeconomist@industry.gov.au
Creative Commons licence
With the exception of the Coat of Arms, this publication is licensed under a Creative Commons Attribution 3.0 Australia Licence. Creative Commons Attribution 3.0 Australia Licence is a standard form license agreement that allows you to copy, distribute, transmit and adapt this publication provided that you attribute the work. A summary of the licence terms is available from:
http://creativecommons.org/licenses/by/3.0/au/deed.en The full licence terms are available from:
http://creativecommons.org/licenses/by/3.0/au/legalcode
The Commonwealth’s preference is that you attribute this publication (and any material sourced from it) using the following wording: Source: Licensed from the Commonwealth of Australia under a Creative Commons Attribution 3.0 Australia Licence.
Foreword
The Resource and Energy Major Projects is a biannual snapshot of the stock of investment in Australia’s resources and energy sectors. The downturn in commodity prices has pushed many companies to implement cost cutting programs to remain profitable and shifted their focus from developing new projects to ensuring the commercial viability of existing assets.
The outlook for resources investment in Australia remains broadly unchanged since the October edition of the Resources and Energy Major Projects Report. The value of committed projects is about to start declining, substantially, and it is clear that this will not be offset by new investments coming through the pipeline which are being increasingly delayed due to adverse market conditions. As a result of these market conditions, the number of resources projects being developed in Australia is now reverting back to pre-investment boom levels. As such, we expect investment in mineral and energy
commodities to be subdued relative to the high levels seen in recent years.
In the longer term, continued advances in technology and demand growth in highly populated emerging economies will continue to support higher consumption of commodities such as base metals, rare earth elements, gold, silver and uranium. With its rich resource endowment, there is still significant potential for Australia to attract further investment in its resources industry.
Mark Cully Chief Economist
Contents
Foreword 2
Executive Summary 4
Background to the Resources and Energy Major Projects Report 5
Exploration 7
Projects at the Publicly Announced Stage 10
Projects at the Feasibility Stage 12
Projects at the Committed Stage 14
Projects at the Completed Stage 19
Executive Summary
This release of the Resources and Energy Major Projects Report provides an update on resource and energy project developments over the period November 2014 to April 2015. It comes at a time when the investment boom has clearly ended and Australia is transitioning to the production phase of the mining boom.
The downturn in commodity prices has pushed many companies to implement cost cutting programs to remain profitable. Reducing exploration expenditure has clearly been one of the principal ways savings have been delivered. In 2014 Australia’s total exploration expenditure, including both minerals and petroleum exploration, decreased 6.7 per cent, compared to 2013, to $6.6 billion.
The outlook for resources investment in Australia remains broadly unchanged since the October edition of the Resources and Energy Major Projects Report. The value of committed projects is about to start declining, substantially, and it is clear that this will not be offset by new investments coming through the pipeline which are being increasingly delayed due to adverse market conditions. Two of the large LNG projects in Queensland have already started initial production but remain on the major projects list as the project is yet to be fully completed. This is providing some support to the value of projects that are underway but it is likely that by the end of 2015 they will be moved to the Completed Stage in the major projects list. There was a small rebound in the number of projects that received a positive final investment decisions in the past six months. In the six months from October 2014 to April 2015, seven projects worth $2.2 billion were identified as receiving a positive Final Investment Decision and progressed to the Committed Stage. However, these were more than offset by 13 projects worth $7.8 billion progressing to the completed stage. In total, there were 39 projects worth $226.3 billion at the committed stage as at the end of April 2015.
The impact of the downturn in commodity prices and market conditions is also visible in projects that are still being developed. The total number of uncommitted project (projects at both the Feasibility and Publicly Announced stages) is also decreasing and is now back to pre-investment boom levels.
Background to the Resources and
Energy Major Projects Report
The Resources and Energy Major Projects is a biannual report released by the Department of Industry and Science (DIS) that provides a review of the mining, infrastructure and processing facilities projects that increase, extend or improve the output of mineral and energy commodities in Australia. This edition of the report is an update on project developments over the six months from May 2014 to October 2014 (inclusive). Its purpose is to measure the value of the current and potential investment in the mining and energy sectors and provide an analysis of the key trends and issues underpinning the level of investment. The value of this ‘stock’ of investment is an important economic indicator for Australia. The annual capital expenditure that flows from it has been a major source of economic activity over the past five years and it supports expectations of resources and energy commodity output growth. DIS gathers information on major projects from a number of sources including company websites, ASX quarterly activity reports and media releases, and in some cases, from direct contact with company representatives. Although there is substantial investment by mining and energy companies in replenishing equipment, plant and other property, the focus of this report is on ‘major’ investments that are greater than $50 million. Smaller scale operations that cost less than $50 million are also an important contributor to the sector and the broader Australian economy; however gathering data on such projects is challenging as many are undertaken by private companies with fewer obligations to report progress and they often have shorter development cycles.
Developers of resources and energy projects often use different planning processes and assessment methods to support a Final Investment Decision (FID). Thus, there is no standard project development model with clearly defined stages and terminology that can be applied to every resources and energy project. To broadly represent the general lifecycle of a project DIS use a four-stage model of the investment pipeline to measure the potential investment in Australia’s resources and energy sectors.
To be included on the major projects list that accompanies this report, there must be evidence of project activities that support the project progressing to an FID within the next five years.
The four stages in DIS investment pipeline model are:
1. Publicly Announced Stage. Projects at this stage are either at a very early stage of planning (i.e. undertaking their first pre-feasibility study), have paused in progressing their pre-feasibility studies or have an unclear development path. As a result, not all projects will progress from the Publicly Announced Stage to become operational facilities. To include a project on the major projects list at this stage, preliminary information on project schedule, planned output or cost must be publicly available.
2. The Feasibility Stage. This stage of the project development cycle is where the initial feasibility study for a project has been completed and the results support further development. This stage is characterised by further studies being undertaken to finalise project scope, complete engineering designs, assess environmental impacts and develop commercial plans. Projects at the Feasibility Stage are less uncertain than those at the Publicly Announced Stage, but are still not guaranteed to progress further as evaluations of commercial prospects have not yet been finalised and all regulatory approvals are yet to be received.
3. Committed Stage. Projects at this stage of the development cycle have completed all commercial, engineering and
environmental studies, received all required regulatory approvals and finalised the financing for the project. Such projects are considered to have received a positive FID from the owner, or owners, and are either under construction or preparing to commence construction. Typically, projects at the Committed Stage have cost estimates, schedules and mine output that are well defined and often publicly released. Nevertheless, plans are subject to change due to schedule delays, scope changes and cost overruns even after construction has commenced.
4. Completed Stage. The period of time that a project undertakes commissioning or ramps up to full production varies; however, DIS first classifies a project as being at the Completed Stage when they have substantially finished their construction and commissioning activities to the point where full commercial level production has commenced.
Earlier stages of developing mining and energy projects, such as identifying deposits and exploration activities, are not included in the model. While these activities remain important, it is beyond the scope of this report to assess exploration activities on a project by project basis. Instead, a summary and analysis of aggregate exploration expenditure is provided.
Exploration
Overview
Exploration is a key stage in the mining project development cycle. It is an investment in knowledge about the location, type, quantity and quality of deposits to potentially support future development. Before making the decision to undertake exploration activities, resources and energy companies consider a range of factors to ensure the benefits of exploration activities exceed the costs. These include prevailing and expected commodity prices; regulatory environments; geological prospects and fiscal arrangements.
The recent downturn in commodity prices has pushed many
companies to implement cost cutting programs to remain profitable. Reducing exploration expenditure has clearly been one of the principal ways savings have been delivered.
Exploration Expenditure
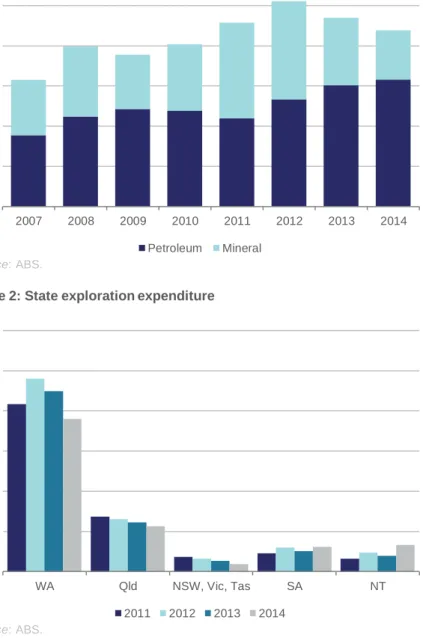
In 2014 Australia’s total exploration expenditure, including both minerals and petroleum exploration, decreased 6.7 per cent, compared to 2013, to $6.6 billion. Market conditions such as lower commodity prices and an oversupply of material in most markets reduced the incentive to undertake exploration activities. Minerals exploration expenditure totalled $1.8 billion, down 27 per cent; however, petroleum exploration expenditure increased 4.6 per cent to $4.7 billion.
In Western Australia total exploration expenditure decreased 15 per cent ($689 million), to $3.8 billion in 2014. Expenditure in
Queensland was down 7.9 per cent to $1.1 billion and the combined expenditure of New South Wales, Victoria and Tasmania decreased 30 per cent to $187 million. However, exploration expenditure in South Australia and the Northern Territory increased 20 per cent and 67 per cent, respectively.
1.5 3 4.5 6 7.5 9 2007 2008 2009 2010 2011 2012 2013 2014 A$b
Figure 1: Australia’s exploration expenditure
Petroleum Mineral Source: ABS. 1 2 3 4 5 6 WA Qld NSW, Vic, Tas SA NT A$b
Figure 2: State exploration expenditure
2011 2012 2013 2014 Source: ABS.
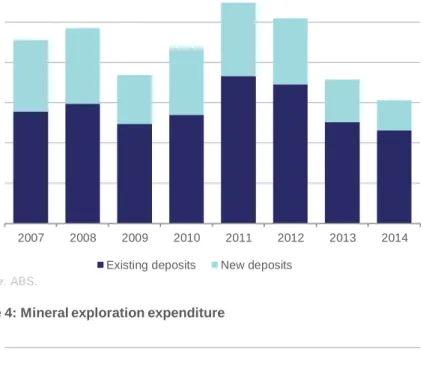
Minerals exploration activity, as measured by the number of metres drilled, fell in line with the drop in expenditure. In 2014 the total metres drilled decreased 14 per cent, year-on-year, and totalled 6125 thousand metres. Metres drilled at new deposits and existing deposits decreased 29 per cent and 8.2 per cent, respectively. As a result of this drop in activity, exploration expenditure on new deposits decreased 37 per cent to $545 million and expenditure on existing deposits decreased 22 per cent to $1.3 billion.
Exploration expenditure decreased across all types of mineral commodities in 2014. Expenditure on base metals decreased 27 per cent, compared to 2013, to $607 million. After peaking in 2011, base metals exploration expenditure has now declined 59 per cent. Although iron ore and coal export volumes increased over 2014, exploration expenditure for both commodities decreased by 31 per cent and 23 per cent, respectively, in 2014. Gold exploration expenditure decreased 32 per cent with other minerals expenditure decreasing 8 per cent.
Both onshore and offshore petroleum exploration increased in 2014 compared to 2013. Onshore exploration increased 7 per cent to $1.4 billion and offshore exploration increased 3.7 per cent to $3.3 billion. Offshore exploration accounted for nearly half of Australia’s total exploration expenditure in 2014. However, the recent downturn in petroleum prices is likely to result in lower exploration in the short term. 2000 4000 6000 8000 10000 12000 2007 2008 2009 2010 2011 2012 2013 2014 km
Figure 3: Mineral exploration – metres drilled
Existing deposits New deposits Source: ABS. 1000 2000 3000 4000 5000 2007 2008 2009 2010 2011 2012 2013 2014 A$m
Figure 4: Mineral exploration expenditure
Existing deposits New deposits Source: ABS.
400 800 1200 1600 2000
Iron ore Base Metals Gold Coal Other
A$m
Figure 6: Exploration by mineral
2010 2011 2012 2013 2014 Source: ABS. 1000 2000 3000 4000 5000 2007 2008 2009 2010 2011 2012 2013 2014 A$m
Figure 5: Petroleum exploration expenditure
Offshore Onshore Source: ABS.
Projects at the Publicly
Announced Stage
Overview
Projects at the Publicly Announced Stage are usually very early in their development and are typically undergoing an initial feasibility study to assess the commercial aspects of developing an identified resource. Projects that have stalled in progressing towards an FID and are investigating alternative development options are also classified as Publicly Announced to reflect their longer planning times.
As they are still in early planning stages, projects at the Publicly Announced Stage may not have finalised engineering designs or construction costs. To reflect this uncertainty project costs are quoted as a cost band in the major projects list when they have not been announced by the project proponent. In most cases this is based upon an estimate developed by DIS using industry averages for similar construction activities. The cost bands used by DIS in this report for Publicly Announced projects are:
• $0 – $249m • $250m – $499m • $500m – $999m • $1 000m – $1 499m • $1 500m – $2 499m • $2 500m – $4 999m • $5 000m+
Summary of projects at the Publicly Announced
Stage
Slowing demand growth in key markets and increasing supply of most commodities led to lower commodity prices through the second half of 2014 and into 2015. This trend has in turn impacted the development of resource and energy projects in Australia. At the end of April 2015, DIS has identified 55 projects at the Publicly
Announced Stage with a collective value of between $62 billion and over $81 billion (see Table 1). This is four less than reported in October 2014. Seven projects were removed from the major projects list after extended periods of inactivity or announcements that they are on hold, four projects were added to the list, four advanced up the investment pipeline and three were moved back from the Feasibility Stage to reflect delays in their progress.
At the end of April there were eight iron ore projects worth over $11 billion at the Publicly Announced Stage. The decline in iron ore prices through 2014 and into 2015 appears to have stalled the development of several iron ore projects. Three iron ore projects have been removed from the major projects list since October 2014 (worth a total of around $10 billion) and none were added to the list or progressed to the Feasibility Stage.
There are nine coal projects at the Publicly Announced Stage with a combined value of more than $10.7 billion. While the number of coal projects at the Publicly Announced Stage has remained the same since October 2014 the overall value of those projects has fallen by around $1 billion.
Following the fall in the price of oil and gas there has been a general slowdown in project investment in these commodities. However, in terms of total value, LNG, oil and gas projects account for the largest share of projects at the Publicly Announced Stage. There are seven LNG, gas and oil projects at the Publicly Announced Stage with a combined value of over $67 billion. This high value is underpinned by offshore gas projects including Browse floating LNG, Crux LNG and Cash Maple Development projects, each estimated at over $5 billion.
At the end of April 2015 there were six gold projects with a combined value of between $730 million and $1.5 billion in the Publicly
Announced Stage. There have been no changes to the number and value of gold projects at the Publicly Announced Stage since October 2014. Given the ongoing fall in the price of gold recorded over the past 24 months the number and value of gold projects at the Publicly Announced Stage is a positive result.
At the end of April 2015 there were seven metals projects, including copper, nickel, zinc, lead and aluminium at the Publicly Announced Stage. The number of projects has increased by one since October 2014, the net effect of removing one project from the major projects list, three moving back to the Publicly Announced Stage and one project advancing up the development pipeline. The project removed from the list fell below the $50 million threshold following a re-appraisal of the development. The metals projects have a combined value of over $5.8 billion, mainly due to BHP Billiton’s Olympic Dam expansion.
The fall in most metal prices through 2014 and into 2015 has slowed the development of many projects in the early stages of planning. Many major producers have indicated through their quarterly reports that they are cutting, or intend to cut, capital expenditure (particularly exploration and project development) in an attempt to reduce costs.
Table 1: Publicly Announced Stage project summary
Number of projects Indicative cost range $m
Aluminium, Bauxite, Alumina 1 0 – 250
Coal 9 10 769 – 12 019+
Copper 2 5 070+
Gold 6 730 – 1 480
Infrastructure 6 10 500 – 15 000+
Iron ore 8 11 019 – 15 019+
Lead, Zinc, Silver 1 67
LNG, Gas, Oil 7 20 500 – 25 000+
Nickel 3 660 – 1 160
Other commodities 7 1 289– 2 039
Uranium 5 1 750 – 3 500
Projects at the Feasibility Stage
Overview
Projects that have progressed to the Feasibility Stage have undertaken initial project definition studies and commenced more detailed planning such as Front-End Engineering Design studies, Bankable Feasibility Studies and environmental surveys in support of finalising an Environmental Impact Statement. While there is an opportunity to progress projects at the Feasibility Stage to the Committed Stage, this is not guaranteed to occur. Projects at the Feasibility Stage have not been committed to and are only potential investments that may occur under the appropriate conditions. Therefore, the total value of projects at the Feasibility Stage cannot be directly compared to the value of the projects at the Committed Stage to forecast the future of capital investment in Australia’s resources and energy sectors.
Summary of projects at the Feasibility Stage
The progress of projects at the Feasibility Stage has been affected by the down-turn in commodity prices. Since the generally
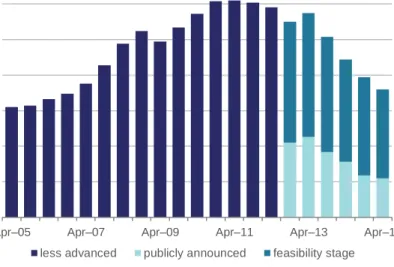
acknowledged peak in commodity prices in 2011, the number of uncommitted projects (comprising those at both the Feasibility and Publicly Announced stages) has declined from a peak of 305 in April 2011 to 180 in April 2015.
At the end of April 2015 there were 125 projects at the Feasibility Stage with a combined value of $143 billion (see Table 2). The number of projects has decreased by 13 since October 2014 and the total value is down 2 per cent. Three projects progressed to the Committed Stage, three projects were added to the Feasibility Stage, three projects progressed from the Publicly Announced Stage, three projects were moved back to the Publicly Announced Stage and 13 were removed from the major projects list. These projects were removed after announcements they were no longer being developed or following 12 months or more of inactivity.
Table 2: Summary of projects at the Feasibility Stage
NSW Qld WA NT SA Vic Tas Total
No. $m No. $m No. $m No. $m No. $m No. $m No. $m No. $m
Aluminium, Bauxite, Alumina 1 1 500 1 1 500 Coal 10 5 052 25 48 767 2 227 37 54 047 Copper 1 420 3 867 1 279 1 220 3 4 277 1 291 10 6 354 Gold 1 80 1 123 7 989 1 1 046 10 2 238 Infrastructure 2 846 5 4 950 3 7 444 2 663 12 13 903 Iron ore 1 2 900 10 13 781 2 4 050 13 20 731
Lead, Zinc, Silver 2 490 1 70 3 560
LNG, Gas, Oil 2 2 200 2 2 000 2 26 000 1 200 7 30 400
Nickel 5 4 081 5 4 081
Other 4 1 534 5 2 424 8 1 974 3 1 900 1 49 3 901 1 180 25 8 962
Uranium 2 693 2 693
If market conditions remain subdued through 2015 several more projects may be removed from the list. However, a number of projects have secured Government (both state and federal) approval since the October report, indicating that if conditions improve several projects will be in a position to make a final investment decision. Projects to develop or expand coal mines continue to account for the highest number and value of projects at the Feasibility Stage. There are 37 coal projects worth a combined $54 billion. This is down two projects from October 2014 which is the net effect of one project progressing to the Committed Stage (and completed during the period) and the removal of one project from the major projects list. There are 13 iron ore projects at the Feasibility Stage with a
combined value of $21 billion. This is five projects less than reported in October 2014 and the result of five projects being removed from the list. There are several high value, greenfield magnetite
development projects that remain at the Feasibility Stage from October 2014 with a combined value of over $12 billion.
There are seven LNG, gas and oil projects at the Feasibility Stage worth $30 billion. While the number of projects has remained the same since October 2014 the value has increased by around $700 million, following the re-evaluation of the Narrabri coal seam gas project. The largest of these projects is the proposed Scarborough floating-LNG platform with an indicative cost estimate of $14 billion. There are 10 gold projects at the Feasibility Stage with a combined value of $2.2 billion. Following the retreat in the price of gold producers have moved focus from expansions and new projects to cutting costs and improving efficiency. The Mt Todd mine expansion in the Northern Territory remains the highest value gold project at the Feasibility Stage, it is worth an estimated $1 billion.
Over the past six months the number of metals projects, including aluminium, copper, lead, zinc, silver and nickel projects, at the Feasibility Stage decreased by three to 19. This is the net effect of one project being removed from the list of major projects, three projects moving back to the Publicly Announced Stage, the addition
of one project to the list, one project progressing to the Feasibility Stage and one project progressing to the Committed Stage. The value of metals projects at the Feasibility Stage decreased by 12 per cent to $12.5 billion from October 2014. Over the past six months an abundance of most metals combined with a slowdown in demand growth led to a broad increase in stock levels and a fall in prices. This trend has in turn reduced the incentive for investment in metals projects. Oz Minerals’ Carrapateena copper mine remains the largest metals project at the Feasibility Stage worth around $3.0 billion. 50 100 150 200 250 300 350
Apr–05 Apr–07 Apr–09 Apr–11 Apr–13 Apr–15
No. of projects
Figure 7: Number of uncommitted projects
Projects at the Committed Stage
Overview
Projects at the Committed Stage have completed their planning activities, received all necessary Government regulatory approvals and finalised the financing of the project to allow construction. In most cases, projects at this stage of development have already started construction as there are typically pre-works undertaken as part of exploration and design activities. Most projects that progress to the Committed Stage will eventually commence production. Post-FID, there are still schedule, technical and financial risks that, if realised, can affect the commercial viability of a project and possibly lead to its cancellation.
Projects progressing to the Committed Stage
In the six months from November 2014 to April 2015, seven projects worth $2.2 billion were identified as receiving a positive final
investment decision and progressed to the Committed Stage (see Table 3). While this is a moderate rebound both in the number and
value of projects since October 2014, investment in resources and energy has been on a downward trend since October 2012.
Analysis of committed investment
The number of projects at the Committed Stage decreased by five, relative to October 2014, to 39. These 39 projects have a combined value of around $225.8 billion which is $1.9 billion less than in October 2014. Over the last six months 13 projects were completed and seven progressed from the Feasibility Stage. The peak of the investment boom has now well and truly passed however
opportunities for further investment, particularly in infrastructure, still remain. Business conditions, cost competitiveness in Australia and the price cycle, will drive implementation of these opportunities. The ‘mega projects’ valued at more than $5 billion represent the highest proportion of projects at the Committed Stage (see figure 10). At the end of April 2015 there were eight mega projects at the Committed Stage, which represent 90 per cent of the value of all committed projects. Most of the mega-projects are LNG related, with Hancock Prospecting’s Roy Hill the only non-LNG mega-project.
Table 3: Projects that progressed to the Committed Stage
Project Company State Value ($m)
BassGass mid life enhancement Origin / AWE Vic 200
Eastern Goldfields pipeline expansion APA Group WA 140
Hexham train support facility Aurizon NSW 150
Nova Bollinger nickel project Sirius Resources WA 443
Persephone gas field Woodside / BHP Billiton / BP / Chevron / Shell WA 1 200
Thunderbox gold project Saracen Mineral Holdings WA 65
Uley (phase 2 and 3) Valence Industries SA 50
Total 2 248
50 100 150 200 250 300 20 40 60 80 100 120
Apr–05 Apr–07 Apr–09 Apr–11 Apr–13 Apr–15
A$b No. of
projects
number (left axis) value (right axis)
Figure 8: Number and nominal value of committed projects
50 100 150 200 250
LNG, gas, oil Iron ore Infrastructure Coal Other
A$b
Figure 9: Value of projects at the Committed Stage, by commodity
19% 47% 34% 2009 $50 – $1 000m $1 001m – $5 000m >$5 000m
Figure 10: Share of committed investment – April 2009 v April 2015
4% 6%
90% 2015
has supported the development of low cost gold projects, which typically have a shorter life span.
Since October 2014 the number of metals projects, including aluminium, copper, lead, zinc, silver and nickel, at the Committed Stage increased by one to total four. These four projects have a combined value of $2.5 billion. Notably, the Nova-Bollinger nickel project moved to the Committed Stage and is the first metals project to do so in over 12 months. No metals projects reached completion. There are still no projects at the Committed Stage for aluminium, bauxite, alumina or copper that are valued at over $50 million. Since October 2014 the number of infrastructure projects at the Committed Stage has decreased by three to total seven. This is the result of four projects moving to the Completed Stage and one project moving to the Committed Stage. As a result, the value of infrastructure at the Committed Stage has decreased by 44 per cent since October 2014 to $5.5 billion. The fall in value was primarily due to the completion of the Wiggins Island Coal Terminal (worth $2.6 billion). There is now only one high value infrastructure project at the Committed Stage, the Hay Point Coal Terminal (worth $3.5 billion), and it is scheduled for completion in the next 12 months.
These projects have been the driving force of the investment boom and are expected to start being removed from the major projects list in the second half of 2015.
Summary of projects at the Committed Stage
LNG, gas and oil projects continue to drive resources and energy investment in Australia, accounting for 88 per cent of committed investment (see Figure 9). There are 13 LNG, gas and oil projects at the Committed Stage with a combined value of $200 billion. Over the past six months two projects moved into the Committed Stage (worth $1.9 billion) and two projects (worth $600 million) moved on to the Completed Stage. The Queensland Curtis LNG and Gladstone LNG projects, worth $20.4 billion and $18.5 billion respectively, remain on the committed list. Although these projects have
commenced production they are yet to deliver their full scope though this is expected before the end of 2015.
There are three iron ore projects worth $11 billion at the Committed Stage. Roy Hill is the largest iron ore project at the Committed Stage (accounting for approximately 90 per cent of the total value of iron ore projects at the Committed Stage) and the last non-energy mega project on the DIS production pipeline. Roy Hill is scheduled for completion in late 2015.
There are seven coal projects worth a combined value of $5.5 billion at the Committed Stage. This is two projects less than in October 2014 as two projects moved to the Completed Stage. Four of the committed projects are in New South Wales and three are in Queensland, however the four projects located in New South Wales are expansions which are smaller in scale than the greenfield development projects located in Queensland. The Grosvenor underground mine in Queensland is the highest value project worth approximately $2 billion and is scheduled for completion in 2016. There are two gold projects worth $300 million in the Committed Stage, which is one more than in October 2014. No major gold projects were completed in the last six months. However, several gold mines that did not meet the threshold for a major project (and are therefore not on the DIS major projects list) have moved to the Committed Stage. The recent rise in the Australian dollar gold price
Table 4: Summary of projects at the Committed Stage
NSW Qld WA NT SA Vic Tas Total
No. $m No. $m No. $m No. $m No. $m No. $m No. $m No. $m
Aluminium, Bauxite, Alumina 0 0 Coal 4 1 953 3 3 515 7 5 468 Copper 0 0 Gold 1 246 1 65 2 311 Infrastructure 2 553 3 4 528 2 465 7 5 546 Iron ore 3 11 416 3 11 416
Lead, Zinc, Silver
2 1 515 1 514 3 2 029 LNG, Gas, Oil 3 63 600 7 100 870 1 34 000 2 1 700 13 200 170 Nickel 1 443 1 443 Other 2 845 1 50 3 895 Uranium 0 0 Total 6 2 506 12 73 404 16 114 104 1 34 000 2 564 2 1 700 0 0 39 226 278
Projects at the Completed Stage
Overview
The Completed Stage includes projects that have completed the majority of their full project scope as well as commissioning activities and can begin commercial scale production. As many projects include multiple stages and scope elements that can be independent of each other, the timing of when a project reaches the Completed Stage is difficult to assess. In the major projects list provided with this report, projects that have progressed to the Completed Stage over the past six months are recorded in the commodity table of the major project list and all projects completed within the past three years shown in a separate table.
Summary of projects at the Completed Stage
In the six months to April 2015 13 resource and energy projects with a combined value of $7.8 billion progressed to the Completed Stage, this is eight projects and $6.6 billion more than recorded in October 2014.
Three iron ore related projects, with a combined value of $600 million, were completed in the six months to April 2015. The three projects consist of two new mines, Iron Bridge and Iron Valley and one expansion, Mt Webber stage 2. Once fully operational these projects will increase Australia’s annual iron ore production capacity by approximately 11 million tonnes or 1 per cent of annual
production.
Three coal related projects worth $1.3 billion progressed to the Completed Stage in the period. Two of the projects, Drake Coal and Middlemount (stage 2) are located in Queensland while the Boggabri opencut project is located in New South Wales. All were expansion projects.
Two oil and gas projects worth $600 million were completed in the past six months. The Coniston Oil Field Project in Western Australia was the largest of these projects and was worth $500 million. There
are several large LNG projects scheduled for completion in 2015 including Queensland Curtis LNG and Gladstone LNG. These two projects alone have a combined value of approximately $40 billion. Over the past six months five infrastructure projects worth $5.2 billion were completed. The largest of the completed projects was Wiggins Island Coal Terminal (stage 1) worth approximately $2.6 billion. Once fully operational the coal terminal will add around 27 million tonnes to Australia’s annual coal transport capacity. BHP Billiton’s Western Australian Iron Ore optimisation project, worth $2 billion, was also completed during the period.
No gold or metals projects, including aluminium, bauxite, alumina, copper and nickel projects reached completion in the past six months. However, several gold and nickel projects are due for completion in the next 12 months.
5 10 15 20 25 30 35
Apr–06 Apr–09 Apr–12 Apr–15
2014-15 A$b
Table 5: Projects at the Completed Stage
Project Company State New Capacity Capacity Unit Resource Cost $m
Anderson Point 5th berth Fortescue Metals group WA 20 Mtpa Iron Ore 300
Boggabri open cut Idemitsu Kosan NSW 3.5 Mtpa Thermal coal 475
Coniston Oil Field Project Apache Energy / Inpex WA 22 kbpd Oil 526
Dampier Bunbury National Gas Pipeline to
Solomon Hub Fortescue Metals group WA 0 0 Gas 178
Drake Coal project Qcoal Group QLD 6 Mt Thermal and Coking coal 350
Iron Bridge (stage 1) Fortescue Metals Group / Formosa Plastics
Group / Baosteel WA 1500 kt Iron Ore 358
Iron Valley Project BC Iron WA 6000 kt Iron Ore 200
Middlemount (stage 2) Peabody Energy / YanCoal QLD 3.6 Mt PCI and coking coal 500
Moomba to Sydney APA Group NSW n/a n/a Gas 100
Mt Webber (stage 2) Atlas Iron, Altura Mining WA 3000 kt Iron Ore 71
Spar 2 Apache Energy / Santos WA 18 PJ pa Gas 117
WAIO optimisation (port blending and rail yards) BHP Billiton WA n/a n/a Iron Ore 2 050 Wiggins Island Coal Terminal (stage 1) Wiggins Island Coal Export Terminal QLD 27,000 ktpa Black coal 2 600
Table 6: Summary of projects in the investment pipeline
Publicly announced Feasibility Stage Committed Completed
No. Range $m No. Value $m No. Value $m No. Value $m
Aluminium, Bauxite, Alumina 1 0 – 250 1 1 500 0 0 0 0
Coal 9 10 769 – 12 019+ 37 54 047 7 5 468 3 1 325
Copper 2 5 070+ 10 6 354 0 0 0 0
Gold 6 730 – 1 480 10 2 238 2 311 0 0
Infrastructure 6 10 500 – 15 000+ 12 13 903 7 5 546 5 5 228
Iron ore 8 11 019 – 15 019+ 13 20 731 3 11 416 3 629
Lead, Zinc, Silver 1 67 3 560 3 2 029 0 0
LNG, Gas, Oil 7 20 500 – 25 000+ 7 30 400 13 200 170 2 643 Nickel 3 660 – 1 160 5 4 081 1 443 0 0 Other commodities 7 1 289 – 2 039 25 8 962 3 895 0 0 Uranium 5 1 750 – 3 500 2 693 0 0 0 0 Total 55 62 354 – 80 604+ 125 143 469 39 226 278 13 7 825 .
Outlook for resources and energy
investment
Overview
Resources and energy projects undergo complex development processes that are tailored to the requirements of the project proponent. This report utilises a simplified and generic investment pipeline model in order to assess investment trends in Australia’s resources and energy sector. The model is useful for analysing future investment in the sector, identifying emerging bottlenecks and examining the speed of project development. While the resources boom over the past decade stimulated considerable investment in Australia’s resources and energy sector, not all projects that were initiated moved through to construction. Accordingly, projects in the Publicly Announced and Feasibility Stages can only be viewed as potential investment. Further analysis of the quality of the resource, construction and operating costs, the ability of the company to attract finance and return on investment is required to assess the likelihood of each of these projects in order to produce an outlook for future investment in the sector.
The resources and energy sector investment outlook is based on project level analysis of a number of factors to assess the probability that the project moves to the committed stage. This system rates the likelihood of projects progressing to the committed stage being either ‘likely’, ‘possible’ or ‘unlikely’ but does not provide an assessment of schedule risk or likely timing of a final investment decision. Instead two scenarios, one based on just likely projects proceeding and another with both possible and likely projects, are developed based on the announced schedules of project developers to provide a profile for investment at the industry level. As schedule risks, including both market related and internal project risks, generally result in project delays rather than earlier schedules these two scenarios should be viewed as the best case outlook for resources investment. The realisation of schedule risks is likely to result in substantially lower or later investment in the industry.
The ‘likely’ scenario is based on projects already at the Committed Stage and adds projects that are assessed as having a higher probability of proceeding through to development. This assessment is based on a range of internal and external factors that typically have helped determine whether a project has been sanctioned in the past. Where data is available, projects are assessed based on its position on the relevant commodity cost curve and its internal rate of return. Since the assessment is probability based, there remains a degree of uncertainty over the success of projects deemed likely and progression to the Committed Stage is far from guaranteed.
The ‘possible’ scenario includes projects classified as Committed, projects assessed as likely to proceed and projects assessed as ‘possible’. The possible rating is given to projects that have some positive internal and external factors that indicate it may progress to the Committed Stage. However, these projects tend to face greater challenges than a project deemed ‘likely’ that may limit its
commercial viability.
Projects that have been assessed as unlikely to proceed are not included in the forward projection of the value of committed
investment. Although assessments are made at a project level, these are not provided with the Resources and Energy Major Projects report because some of the information used is treated as commercial in confidence.
Outlook for resources and energy investment
World demand for raw materials and energy remains strong and for most commodities is still growing. Nevertheless, expenditure on exploration and investment in developing new projects has slowed markedly around the world due to lower commodity prices. The quarterly activities reports of many project developers operating in Australia are reflecting this trend and while there was a modest uptick in the number of new project commitments in the past six months, the focus of resources companies is clearly to improve the commercial viability of their existing facilities rather than develop new ones. For emerging junior companies targeting the
development of their first asset, the operating environment is proving particularly challenging. In an environment of tighter finance
availability, companies that have completed feasibility studies are re-evaluating their plans to identify cost savings in a bid to improve the economics of their projects. For many project developers this process has not delivered the desired results and subsequently the number of uncommitted projects in Australia has been declining over the past three years.
The outlook for resources investment in Australia remains broadly unchanged. The value of committed projects is about to start declining, substantially, and this will not be offset by new investments coming through the pipeline which are being
increasingly delayed due to adverse market conditions. Two of the large LNG projects in Queensland have already started initial production but remain on the major projects list as the project is yet to be fully completed. This is providing some support to the value of projects that are underway but it is likely that by the end of 2015 they will be moved to the completed stage in the major projects list. The total value of committed projects peaked in 2012 at around $268 billion, has now declined to $226 billion and is likely to fall below $200 billion by the end of 2015 as a result of the LNG projects being moved to the Completed Stage. Almost all projects currently under construction are scheduled to be completed before 2018 and new project final investment decisions will be required to drive capital expenditure in the resources industry after this time.
Decisions to proceed to construction are becoming increasingly difficult due to market conditions, high project costs and in some cases legal proceedings to delay or prevent projects occurring. Both the likely and possible scenarios contained in this outlook reflect the announced schedules of projects under development which are now starting to reflect these schedule risks. As such, a number of projects in both the likely and possible scenarios have been adjusted to have later dates for final investment decisions. However, it is still likely that further delays will occur and that will push the resources investment profile further back.
The resources investment boom has been driven by high value projects that aimed to mainly increase production of bulk commodities and LNG. Although such projects are now winding down, Australia still has many high quality deposits of other
commodities that can be developed in the future to meet growing world consumption. Continued advances in technology and demand growth in highly populated emerging economies will continue to support higher consumption of commodities such as base metals, rare earth elements, gold, silver and uranium. The development of such mines in Australia is far from guaranteed, but the cyclical downturn in the broader industry and draw dawn in investment in high value projects makes it the opportune time to bring a greater focus on developing them.
50 100 150 200 250 2014 2015 2016 2017 2018 2019 2020 A$b T h o u s a n d s
current committed projects likely projects possible projects