2 0 1 3 David Styles
Harald Schönberger Jose Luis Galvez Martos
Learning from frontrunners
Best Environmental Management Practice
in the Tourism Sector
European Commission Joint Research Centre
Institute for Prospective Technological Studies
Contact information
Address: European Commission, Joint Research Centre, IPTS, Edificio Expo, c/ Inca Garcilaso 3, E-41092 Seville, Spain E-mail: JRC-IPTS-EMAS@ec.europa.eu Tel.: +34 9544 88318 Fax: +34 9544 88300 http://ipts.jrc.ec.europa.eu/ http://www.jrc.ec.europa.eu/ Legal Notice
Neither the European Commission nor any person acting on behalf of the Commission is responsible for the use which might be made of this publication.
Europe Direct is a service to help you find answers to your questions about the European Union Freephone number (*): 00 800 6 7 8 9 10 11
(*) Certain mobile telephone operators do not allow access to 00 800 numbers or these calls may be billed. A great deal of additional information on the European Union is available on the Internet. It can be accessed through the Europa server http://europa.eu/.
JRC 82602
EUR 26022 EN
ISBN 978-92-79-30895-6 (pdf)
ISSN 1831-9424 (online)
doi:10.2788/33972
Luxembourg: Publications Office of the European Union, 2013
© European Union, 2013
JRC Scientific and Policy Report on
Best Environmental Management Practice
in the
Tourism Sector
September 2013
Best Environmental Management Practise in the Tourism Sector i
TABLE OF CONTENTS
EXECUTIVE SUMMARY ... XVI
A.1. GENERAL ASPECTS, STRUCTURE AND CONTENT OF THE DOCUMENT ... xvi
A.1.1 General aspects ... xvi
A.1.2 Structure of the document ... xvii
A.2. ENVIRONMENTAL INDICATORS AND BENCHMARKS OF EXCELLENCE ... xx
A.2.1 Approach to conclude on environmental indicators and benchmarks of excellence ... xx
A.2.2 Presentation of the environmental indicators and the benchmarks of excellence ... xx
A.3. Use of this document by SMEs in the tourism sector ... xxxvi
PREFACE ... XXXIX SCOPE ... XLV STRUCTURE ... LVI 1 GENERAL INFORMATION ABOUT THE TOURISM SECTOR ... 1
1.1 Turnover and Employment... 1
1.1.1 Main Economic Data ... 1
1.1.2 Structural Profile of the Sector ... 2
1.1.3 Geography of EU-27 Tourism ... 4
1.2 Environmental Issues of the Tourism Sector ... 8
1.2.1 Environmental aspects, pressures and impacts ... 8
1.2.2 Global and local environmental burdens ... 12
2 CROSS CUTTING BEST ENVIRONMENTAL MANAGEMENT PRACTICE ... 23
2.1 Environmental management system implementation ... 24
2.2 Supply chain management ... 33
3 DESTINATION MANAGEMENT ... 46
3.1 Strategic destination development plans ... 53
3.2 Biodiversity conservation and management ... 72
3.3 Infrastructure and service provision ... 100
3.4 Environmental management of events ... 120
4 TOUR OPERATORS AND TRAVEL AGENT BEST PRACTICE ... 126
4.1 Reduce and mitigate the environmental impact of transport operations ... 131
4.2 Drive environmental improvement of accommodation providers ... 149
4.3 Drive destination improvement ... 165
4.4 Develop and promote sustainable tourism packages ... 175
4.5 Encourage more sustainable tourist behaviour ... 187
4.6 Efficient retail and office operations ... 199
5 MINIMISING WATER CONSUMPTION IN ACCOMMODATION ... 205
5.1 Water system monitoring, maintenance and optimisation ... 211
5.2 Efficient water fittings in guest areas ... 225
5.3 Efficient housekeeping ... 242
5.4 Optimised small-scale laundry operations... 258
5.5 Optimised large-scale laundry operations ... 276
5.6 Optimised pool management ... 295
5.7 Rainwater and greywater recycling ... 307
6 MINIMISING WASTE FROM ACCOMMODATION ... 318
6.1 Waste prevention ... 322
6.2 Waste sorting and recycling ... 331
6.3 Wastewater treatment ... 349
7 MINIMISING ENERGY CONSUMPTION IN ACCOMMODATION BUILDINGS ... 361
7.1 Energy monitoring and management systems ... 366
7.2 Improved building envelope ... 382
7.3 Optimised HVAC systems ... 394
7.4 Efficient application of heat pumps and geothermal heating/cooling ... 406
7.5 Efficient lighting and electrical equipment ... 422
ii Best Environmental Management Practise in the Tourism Sector 8 RESTAURANT AND HOTEL KITCHENS BEST ENVIRONMENTAL MANAGEMENT
PRACTICES ... 457
8.1 Green sourcing of food and drink products ... 459
8.2 Organic waste management ... 478
8.3 Optimised dish washing, cleaning and food preparation ... 494
8.4 Optimised cooking, ventilation and refrigeration ... 510
9 CAMPSITE BEST ENVIRONMENTAL MANAGEMENT PRACTICES ... 532
9.1 Environmental education of guests ... 534
9.2 Environmental management of outdoor areas ... 545
9.3 Campsite energy efficiency and renewable energy installation ... 558
9.4 Campsite water efficiency ... 576
9.5 Campsite waste minimisation ... 584
9.6 Natural pools ... 593
10 MICRO, SMALL AND MEDIUM SIZED ENTERPRISES ... 598
10.1 Micro- and small- and medium- sized enterprises in the tourism sector... 598
10.2 Sustainability of SMEs ... 600
10.3 Applicability of this document to SMEs ... 601
10.4 Alternative financing of energy efficiency measures for SMEs ... 603
11 CONCLUSIONS... 607
11.1 General aspects ... 607
11.2 Specific conclusions ... 607
11.3 Best environmental management practices ... 608
11.3.1 Cross-cutting... 608
11.3.2 Destination managers ... 609
11.3.3 Tour operators ... 609
11.3.4 Accommodation water consumption ... 609
11.3.5 Waste management ... 610
11.3.6 Accommodation energy ... 610
11.3.7 Kitchens ... 611
11.3.8 Campsites ... 611
11.4 Common specific key performance indicators of the tourism sector ... 612
11.5 Benchmarks of excellence and links to BEMPs and related specific indicators ... 620
11.6 Recommended sector specific key environmental indicators ... 636
GLOSSARY ... 652
ANNEX 1: EUROPEAN BUSINESS AND BIODIVERSITY CAMPAIGN BIODIVERSITY CHECK CRITERIA FOR TOURISM ORGANISATIONS ... 655
Best Environmental Management Practise in the Tourism Sector iii
List of Figures
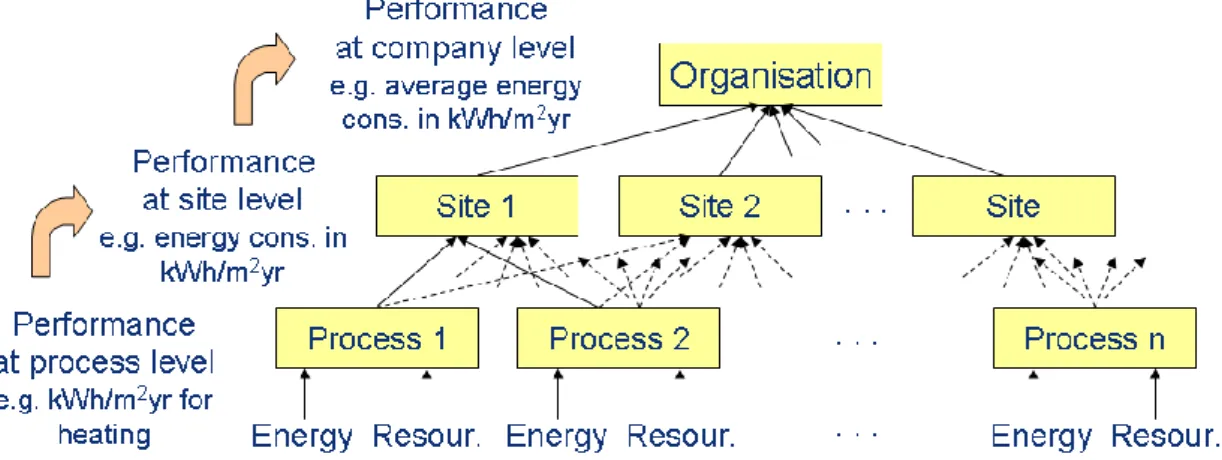
Figure i: Bottom-up approach for environmental performance indicators and benchmarks of excellence ... xl Figure ii: Structure of the Technical Working Group (TWG) ... xli Figure iiiii: Timing for the elaboration of the tourism document ... xlii Figure 1.1: Share of value added and persons employed by enterprise size class in the EU-27, for the
non-financial business (NFB) economy and for the hotel and restaurant (hospitality) sector 3 Figure 1.2: Size distribution of accommodation enterprises in the EU-27, by number of enterprises (top
figure) and by gross-value-added (bottom figure) ... 4
Figure 1.3: Regional employment in hotels and restaurants ... 5
Figure 1.4: Tourism service inputs and outputs ... 8
Figure 1.5: Examples of important direct (oval) and indirect (rectangular) aspects for: (top) laundry detergent use; (bottom) restaurant food preparation and waste management ... 9
Figure 1.6: An overview of processes, aspects, inputs and impacts for the tourism sector ... 11
Figure 1.7: Ecosystem connectivity (arrows) across mangroves, seagrasses and coral reefs, and potential feedbacks arising from human induced impacts ... 13
Figure 1.8: The contribution of tourism towards global GHG emissions, and the breakdown of emissions within the tourism sector (inset) ... 14
Figure 1.9: Estimated global GHG emissions attributable to tourism transport ... 15
Figure 1.10: Freshwater resources per capita and tourism 'hotspots' based on arrivals per inhabitant ... 16
Figure 1.11: Top ten European countries in terms of the share of domestic water consumption accounted for by domestic and international tourism in the year 2000 ... 17
Figure 1.12: Potable water consumption by residents and tourists on Majorca ... 17
Figure 1.13: Waste generation by the UK hospitality industry ... 18
Figure 2.1: The continuous planning and improvement cycle ... 24
Figure 2.2: Stated goals of EMS implementation for Ecocamping certified campsites ... 26
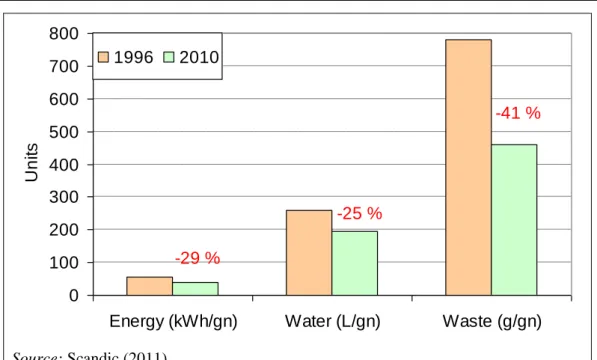
Figure 2.3: Organisation-level environmental performance improvements documented by Scandic following implementation of a comprehensive EMS ... 28
Figure 2.4: Typical and best practice carbon footprint and hotspot sources for a meal of 0.2 kg beef, 0.1 kg asparagus, and 0.4 kg potato ... 34
Figure 2.5: Ecoproducts can exert an environmental performance 'pull' effect on entire product groups if they become benchmarks for environmental performance ... 36
Figure 2.6: The average percentage of chemicals used by individual hotels within a mid-range European hotel chain that were certified according to an ISO type-1 ecolabel in 2010 ... 39
Figure 3.1: Percentage of holiday makers ranking each of eight entities as either first or second most responsible for dealing with the environmental impacts of flying holidays in a TUI survey ... 48
Figure 3.2: The sustainable tourism stakeholder management framework proposed by Hawkins et al. (2002) in relation to sustainable tourism development ... 49
Figure 3.3: Major pathways of influence exerted by destination managers relevant to the environmental performance of tourists, tourism service providers, and their suppliers ... 50
Figure 3.4: Schematic summary of the strategic tourism plan for Barcelona ... 58
Figure 3.5: The DPSIR framework for assessing destination sustainability ... 64
Figure 3.6: General relationship between different ecosystem services, mean species abundance (MSA) and land use intensity ... 74
Figure 3.7: Examples of landscape mapping based on survey responses for the Murray River Reserves, Australia – recreational values (a) and life sustaining values (b) ... 80
Figure 3.8: The planning cycle for integrated tourism and biodiversity planning ... 84
Figure 3.9: The value of ecosystem services provided by different habitats along the Catalan coast .... 93
Figure 3.10: Water supply, stormwater and wastewater BEMPs illustrated in the SWITCH Water-Sensitive City of the Future ... 102
Figure 3.11: GHG avoided through recycling one kg of each waste type, including anaerobic digestion with energy recovery for organic waste ... 103
Figure 3.12: Aerial view of a best practice municipal wastewater treatment plant ('Breisgauer Bucht' near Freiburg in southern Germany) ... 108
Figure 3.13: COD emission curve (values of 24 h composite samples) of the treatment plant 'Breisgauer Bucht' set-up and operated by a grouping of 29 municipalities ... 108
Figure 3.14: Aerial view of a best practice municipal wastewater treatment plant (operated by the management board 'Karnische Region' in South Kaernten/Austria) ... 109
iv Best Environmental Management Practise in the Tourism Sector
Figure 3.15: COD emission curve (load values for the influent and effluent of 24 h composite samples) of the treatment plant of the wastewater management board 'Karnische Region' in South Kaernten/Austria ... 110 Figure 3.16: An example of a recycling point in the Portuguese Algarve resort of Alvor ... 111 Figure 3.17: Flow chart of the biogas plant in Otelfingen, processing food and green waste ... 112 Figure 3.18: A central composting site in Struer, Denmark, producing 5 000 tonnes compost per year 113 Figure 3.19: TheRelentless Boardmasters Music Festival 2011 ... 120 Figure 3.20: Breakdown of GHG emission sources for the Boardmasters festival ... 123 Figure 4.1: Major actors and aspects relevant to the environmental performance of tourism falling
within direct and indirect spheres of influence of tour operators ... 126 Figure 4.2: The traditional and possible reach of tour operators, expressed in relation to holiday
activities quantified by turnover for an average German holiday booking ... 127 Figure 4.3: The environmental footprint (WWF methology) for two two-week package holidays ... 128 Figure 4.4: Specific GHG emissions, expressed per passenger km, for different transport modes
according to occupancy factors and, for air transport, distance ... 132 Figure 4.5: The average carbon footprint of a Sawadee passenger ... 133 Figure 4.6: Representation of actual flight distance between two airports ... 142 Figure 4.7: Integrated radiative forcing of all anthropogenic GHGs emitted in the year 2000 over a 100-year time horizon ... 143 Figure 4.8: Carbon storage in soil, litter, dead wood and live wood fractions of broadleaf and evergreen forests under different climatic conditions (based on values in IPPC, 2003) ... 145 Figure 4.9: Carbon storage in above ground and below biomass fractions of young (less than 20 year
old) pine, conifer and broadleaf forests in different climatic zones, and total carbon storage in mature (more than 20 year old) forests (based on values in IPPC, 2003) ... 145 Figure 4.10: Fuel related costs per passenger for a return flight of 2 000 km each way, based on average
fuel consumption of 2.7 and 3.5 L/100 pkm ... 146 Figure 4.11: Summary of major mechanisms used by tour operators to influence suppliers ... 149 Figure 4.12: Main pathways of direct and indirect influence by tour operators, including via destination
managers, over tourists, tourism actors and suppliers ... 166 Figure 4.13: Comparison of the overall environmental performance of tours based on the balance
between potential positive nature conservation effects and direct environmental burdens 176 Figure 5.1: Average water consumption for hotel brands within a large European hotel chain according to star rating (highest and lowest brand averages displayed for each rating) ... 206 Figure 5.2: Water use from sub-meter data in a 300-room hotel in Germany using 620 litres of water
per guest-night ... 207 Figure 5.3: Modelled specific water consumption per guest-night in a 120 bed hotel implementing
average and good management across water using processes ... 208 Figure 5.4: Monthly water consumption over four years for a large conference hotel (left), annual
specific consumption (right), and the reduction in water consumption after repair of a major leak ... 213 Figure 5.5: Effect of insulation thickness on heat loss from a 5 cm plastic pipe carrying water at 60 ºC
in an ambient air temperature of 25 ºC ... 214 Figure 5.6: Change in specific water use for 92 hotels in a hotel group, and the change in total group
specific water consumption, between 2001 and 2010 ... 215 Figure 5.7: Distribution of water consumption, expressed per guest-night, for individual hotels within a
large European hotel chain (above) and for Swiss hostels (below) used to derive
benchmarks of excellence ... 217 Figure 5.8: Water consumption in three areas of a German hotel ... 218 Figure 5.9: Breakdown of water consumption across eight rooms in a hotel obtained from a study
employing sub-metering of flow rates through pipes to individual fittings... 219 Figure 5.10: Heat loss from un-insulated copper piping of various diameters according to the
temperature differential between the water flowing through them and surrounding air .... 221 Figure 5.11: Measured cold and hot water flow rates from hotel fittings before and after installation of
aerators ... 226 Figure 5.12: Annual water savings (m3) and energy savings (kWh) per fitting achievable by
implementation of best practice compared with average practice ... 229 Figure 5.13: Installation of an aerator in a shower feed... 232 Figure 5.14: The effect of pressure on flow rate for a ½ inch (127 mm) bathroom mixer tap ... 233 Figure 5.15: Annual water consumption for uncontrolled, controlled and manual/sensor flush urinals
serving different numbers of daily users ... 235 Figure 5.16: Specific consumption of active chemicals reported by a range of anonymous hotels, with
Best Environmental Management Practise in the Tourism Sector v
Figure 5.17: An example of monthly chemical consumption, measured as kg active ingredient, and the percentage of those chemicals that are ecolabelled, for a 160 room hotel (average
consumption 0.013 kg per guest-night in 2010) ... 253 Figure 5.18: Annual water and energy savings achievable for the washing process in different sizes of
establishment (assuming 75 % occupancy and on average 2 kg laundry per occupied room per night)... 261 Figure 5.19: Energy savings achievable from the implementation of best practice washing, drying and
ironing for different sizes of establishment... 262 Figure 5.20: Schematic example of an optimised small-scale laundry washing process, with rinse water
reuse and heat recovery from wastewater (based on information in EC, 2007) ... 266 Figure 5.21: A heat recovery system installed in a hostel laundry ... 270 Figure 5.22: Consumable costs per kg of fully processed laundry under average and best practice
conditions, at an energy cost of EUR 0.10/kWh, water cost of EUR 2/kWh and chemical cost of EUR 15/kg ... 272 Figure 5.23: An example of a 10 module continuous batch washer with counter-flow water current and
steam heating ... 276 Figure 5.24: Energy use for an average and an optimised continuous batch washer system based on use
of steam generated by natural gas ... 280 Figure 5.25: Optimised water reuse and heat recovery for a 14-compartament CBW ... 283 Figure 5.26: Water recycling using micro-filtration... 283 Figure 5.27: The relative time and energy consumption required for mechanical dewatering and thermal drying of textiles ... 285 Figure 5.28: Energy consumption for sheet fabric (ironer) and garments (finisher) based on direct gas
heating and indirect heating using steam ... 287 Figure 5.29: Schematic representation of rigid-chest three-roll ironer operation ... 287 Figure 5.30: Steam-heated laundry with optimised energy management ... 289 Figure 5.31: Specific washing costs and textile wear for a 13-compartment CBW under high load rates
and 8-compartment CBW under low load rates, for higher and lower temperature washes ... 292 Figure 5.32: Breakdown of water consumption across processes and areas in a typical community pool
... 295 Figure 5.33: Estimated potential annual water savings across different processes for a 25 m pool ... 298 Figure 5.34: Annual fossil fuel and electricity consumption per m2 for a 'typical' and a 'good' leisure
centre containing a 25 m pool ... 299 Figure 5.35: Float-ball mechanism to divert first flush run-off water ... 310 Figure 5.36: Basic tundish device ... 315 Figure 6.1: Unsorted waste generated per guest-night across different groups and types of hotel, from
sustainability reports ... 318 Figure 6.2: Composition of waste for accommodation enterprises reported by different sources ... 319 Figure 6.3: The waste management hierarchy, with priority actions at the top ... 320 Figure 6.4: Trend in total (left) and specific (right) unsorted waste generation for a 189-room hotel
between 2005 and 2010 ... 325 Figure 6.5: A distribution curve for total waste generation (sorted and unsorted fractions) from 135
hotels within a mid-range European hotel chain ... 326 Figure 6.6: Reusable glass bottles for filtered tap water, and entertainment screen in rooms on which
newspapers can be read, in a luxury hotel ... 327 Figure 6.7: Refillable soap dispenser, and tables set without tablecloths, and with reusable napkins and refillable condiment containers ... 328 Figure 6.8: Sorted waste fractions recorded and recycled in a small 14-room boutique UK hotel and
restaurant ... 331 Figure 6.9: The lifecycle chain for extraction, production, consumption, waste management ... 333 Figure 6.10: Potential annual GHG and energy savings for a 100-room hotel arising from achieving
residual waste of 0.16 kg per guest-night (excludes organic fraction) ... 335 Figure 6.11: Distribution of recycling rates across hotels in a mid-range European hotel chain ... 336 Figure 6.12: Distribution of unsorted waste sent for disposal across hotels in a mid-range European hotel
chain ... 337 Figure 6.13: Environmental impact of the production of bottle-grade PET-flakes from recycled PET
bottles ... 338 Figure 6.14: Non-organic waste fractions (left) and total volume (right) arising from The Savoy in 2011
... 343 Figure 6.15: Recycling rates for different fractions of municipal waste across EU Member States and
vi Best Environmental Management Practise in the Tourism Sector
Figure 6.16: Percentage of municipal waste treated in 2009 by country and treatment category sorted by
percentage of landfilling ... 345
Figure 6.17: Sequence for wastewater treatment and sludge disposal for individual huts in the alpine region where discharge to a municipal effluent treatment plant is either technically or economically unviable... 349
Figure 6.18: Location of the Hotel Schindelbruch and its wastewater treatment plant in Stolberg/Germany ... 351
Figure 6.19: Layout of the biological treatment plant of the Hotel Schindelbruch, based on a scheme provided by Mall GmbH, it is designed for 300 person equivalents ... 351
Figure6.20: Location of the campsite Glücksburg / Holnis in the very North of Germany close to the Danish border ... 352
Figure 6.21: Layout of the biological treatment plant of the Campsite Glücksburg / Holnis, based on a scheme provided by Mall GmbH, it is designed for 1100 person equivalents (PE) ... 353
Figure 6.22: Installation of a pipe to discharge wastewater down to the valley to a municipal wastewater treatment plant, (BLU, 2000) ... 354
Figure 6.23: Wastewater disposal of huts in the Bavarian alpine region, (BLU, 2000) ... 354
Figure 6.24: Separation toilet (on the left) and separate dry collection of faeces (on the right) ... 355
Figure 6.25: Example for a reed bed filter for the treatment of grey water from a hut at 2 245 m above sea level, designed for 30 PE60... 356
Figure 7.1: Energy consumption by end-use in hotels ... 361
Figure 7.2: Modelled average and achievable best practice energy consumption for a 100-room 5 300 m2 hotel based on demand reductions and assumptions in Table 7.2 ... 363
Figure 7.3: Sequence of key actions to implement an energy management plan ... 366
Figure 7.4: Sub-metered electricity consumption data for a 300-room hotel in Germany... 368
Figure 7.5: Annual electricity consumption and HVAC consumption for a 100-room hotel based on best practice, and savings compared with average consumption... 369
Figure 7.6: Relationship between final energy consumption expressed per guest-night and per m2 heated and cooled area for hotels across a mid-range hotel chain ... 371
Figure 7.7: Total energy demand per m2 heated and cooled area across a mid-range hotel chain, and proposed benchmark of excellence ... 372
Figure 7.8: Total energy consumption across 1511 hotels, based on data collated in a meta-analysis of 20 studies on European hotel energy consumption ... 373
Figure 7.9: Monthly thermal load pattern (above) and electrical load pattern (below) for a Greek hotel ... 374
Figure 7.10: Spatial variation in cooling degree days (CCD) and heating degree days (HDD) across Europe ... 375
Figure 7.11: A BMS incorporating individual room heating/cooling control is backed up by manual recording of total heating and cooling energy consumption for the 536-room Scandic Berlin hotel ... 378
Figure 7.12: Energy costs for best practice in a 100-room hotel, and savings compared with average performance, for: (i) lighting and appliance electricity consumption, and either (ii) HVAC and DHW provided by oil or gas, or (iii) HVAC and DHW provided by electricity ... 379
Figure 7.13: Sources of energy losses for a typical commercial building envelope (above), and a thermal image indicating areas of high heat loss (yellow and red areas) from a hotel building ... 383
Figure 7.14: Final energy consumption for heating (HVAC and hot water), expressed per m2 heated and cooled floor area per year, across: (i) 305 German accommodation establishments (top figure); (ii) 127 mid-range hotels (bottom figure) ... 386
Figure 7.15: Increased construction costs compared with reduced heating costs over ten years for Mediterranean hotels ... 388
Figure 7.16: Bird's eye view of the Hotel Victoria in Freiburg; the original main building and the retorfitted extension building are indicated ... 389
Figure 7.17: Refurbishment of the facade by triple-glazed windows, ventilation devices and 24 cm-insulation layer ... 390
Figure 7.18: Schematic representation of a basic HVAC system ... 394
Figure 7.19: Annual primary energy and CO2 savings achievable through the implementation of best practice levels of HVAC energy consumption, according to HVAC energy source ... 397
Figure 7.20: Climate classification of European capitals ... 399
Figure 7.21: Important factors to consider when designing the ventilation and cooling system ... 400
Figure 7.22: Basic heat pump refrigeration cycle used to provide indoor cooling ... 407
Figure 7.23: Schematic presentation of a groundwater cooling system ... 409
Figure 7.24: Primary energy requirements for 1 kWh heating or cooling delivered by air- and water-source heat pumps (A-HP and W-HP) and groundwater cooling (GW-C), and savings compared with conventional heating and cooling sources ... 410
Best Environmental Management Practise in the Tourism Sector vii
Figure 7.25: Energy costs for every kWh of heating and cooling delivered by different systems ... 417
Figure 7.26: Electricity consumption in Danish hotels ... 422
Figure 7.27: The total area, average utilisation rate (hours per day), and energy consumption in kWh per day (bubble size) for different areas in a 65 room hotel using traditional lighting ... 423
Figure 7.28: Electricity reductions achieved by installation of almost universal LED and CFL lighting in a 65-room hotel, compared with a reference scenario of incandescent, halogen and CFL lighting ... 426
Figure 7.29: Estimated light energy use in different areas of the 170-room Tomo conference hotel in Riga, Latvia, before and after a comprehensive low-energy lighting retrofit ... 426
Figure 7.30: Installed capacity and daily consumption (kWh, bubble size) of lighting in different areas of a 65-room five-star hotel implementing good practice ... 428
Figure 7.31: Electricity consumption per m2 across a mid-range hotel chain, and proposed benchmark of excellence ... 429
Figure 7.32: LED feature lighting in the reception of a luxury hotel, and on a building exterior ... 433
Figure 7.33: Financial cost savings over the 40 000-hour LED lamp lifetime, compared with 50 W halogen lamps, at different electricity prices ... 435
Figure 7.34: Annualised financial savings associated with reduced energy consumption and lower maintenance requirements arising from extensive installation of LED and CFL lighting in a 65-room hotel, compared with a reference scenario of incandescent, halogen and CFL lighting ... 436
Figure 7.35: Contribution of specified sources to total primary RE production in the EU-27 ... 438
Figure 7.36: Lifecycle avoided primary energy consumption (above) and GHG emissions (below) per kWh useful heat or electricity generated by different RE technologies, relative to conventional reference heating and electricity options ... 442
Figure 7.37: Maximum annual GHG avoidance possible for a 100-room hotel by substituting 100 % gas, oil or electric HVAC heating with wood heating, and 100 % grid electricity with wind electricity ... 443
Figure 7.38: Variation in standard test peak power out put from two solar collectors relative to temperature differential (maximum water temperature minus ambient temperature) ... 448
Figure 7.39: Evolution of power output and conversion efficiency (Cp) with wind speed for a 900 kW turbine ... 450
Figure 7.40: Price range for wood fuel in UK, and price range for oil, gas and electricity across the EU, expressed per kWh energy content ... 451
Figure 7.41: Simple payback time for solar thermal systems at different energy prices and annual thermal output, assuming an installation cost of EUR 850 per m2... 452
Figure 7.42: Capital cost and potential annual returns for a 20 kW wind turbine at different annual outputs and output values ... 454
Figure 8.1: The relative contribution of different product groups to eight environmental impacts in the EU-25 ... 459
Figure 8.2: Share of food and drink products provided to guests at the Huerta Cinco Lunas vivienda rural in Andalucia, Spain ... 465
Figure 8.3: The relative strengths and weaknesses of mainstream and organic production systems, and key sustainability issues ... 466
Figure 8.4: The origins and composition of GHG emissions arising during the production and storage of 1 kg of frozen beef, based on average German conditions, calculated using the GEMIS LCA tool ... 468
Figure 8.5: Breakdown of GHG emission sources for asparagus from different sources ... 469
Figure 8.6: Breakdown of GHG emission sources for different sugar products ... 470
Figure 8.7: The contribution of processes and individual gases to GHG emissions on the egg-laying farm ... 471
Figure 8.8: Organic fruit and vegetable garden at Huerta Cinco Lunas ... 473
Figure 8.9: Organic waste produced by UK restaurants ... 478
Figure 8.10: Summary of best practice for organic waste management in kitchens ... 480
Figure 8.11: Net GHG emissions from landfill, composting and anaerobic digestion of organic waste, per tonne and per average UK restaurant ... 481
Figure 8.12: Energy generation and carbon dioxide emission avoidance associated with combustion of organic waste from The Savoy to generate heat and electricity, compared with the alternative option of landfill ... 482
Figure 8.13: Food waste generation per cover in UK restaurants, and proposed benchmark of excellence ... 483
Figure 8.14: Kitchen non-organic waste sorting in Scandic Berlin ... 484
viii Best Environmental Management Practise in the Tourism Sector
Figure 8.16: Operational energy consumption in an efficient dishwasher processing 2 500 plates per
hour ... 494
Figure 8.17: Energy savings from heat recovery and heat-pump on a flight-type dishwasher ... 497
Figure 8.18: A modern hood type dishwasher ... 500
Figure 8.19: Schematic representation key efficiency features for a rack-loaded tunnel dishwasher ... 501
Figure 8.20: A conveyor-type dishwasher with heat recovery installed in The Savoy ... 502
Figure 8.21: Examples of PRSV spray patterns and flow rates, and associated annual operating costs assuming three hours per day operation ... 503
Figure 8.22: Price premium and annual water/chemical/energy savings associated with efficient dishwashers ... 506
Figure 8.23: Payback time for heat recovery and heat pump components of a large flight-type dishwasher compared with standard boiler specification ... 507
Figure 8.24: Breakdown of energy consumption in a catering business ... 510
Figure 8.25: Potential annual energy savings achievable by purchasing an efficient oven compared with average performance of existing appliances in the US ... 513
Figure 8.26: Carbon footprint per kWh heating delivered to the pot from different types of hub, under optimal and average commercial use conditions ... 515
Figure 8.27: Global warming potential of different types of commercial refrigerant ... 517
Figure 8.28: Daily pattern of electricity consumption in a catering establishment ... 518
Figure 8.29: Effect of a strip curtain fitted to cold room entrance ... 523
Figure 8.30: High-grade heat recovery from refrigerant between compressor and condenser ... 524
Figure 8.31: Lifetime purchase and energy costs for an uninsulated and insulated hot food holding cabinet ... 528
Figure 8.32: Costs incurred over time as a consequence of an unrepaired refrigerant leak ... 529
Figure 9.1: Aspects of environmental education for guests in campsites and other accommodation types, and sections of this document addressing them ... 535
Figure 9.2: Teepee area dedicated to guests arriving by public transport or bicycle at the Uhlenköper campsite ... 537
Figure 9.3: Carbon intensity per km and passenger-km travelled of different car-caravan combinations (petrol and diesel cars, small car – small caravan to large car – large caravan) ... 538
Figure 9.4: A seven-seat conference bicycle at the Uhlenköper campsite ... 539
Figure 9.5: Examples of a small sensory garden trail (above) and a play area in natural surroundings (below) in campsite grounds ... 540
Figure 9.6: A high biodiversity meadow on Denmark Farm ... 543
Figure 9.7: Light pollution over Europe at night ... 545
Figure 9.8: Green roof designs for: (a) normal extensive, rock-type plants; (b) combined with thermal insulation; (c) low weight option; (d) pitched roof (from EC, 2012) ... 550
Figure 9.9: Visual examples of best practice measures to increase on-site biodiversity and drainage management ... 552
Figure 9.10: A xeric garden in a desert (left) and a drip-irrigation emitter (right) ... 552
Figure 9.11: Relative outputs of different light wavelengths from different outdoor lamp types ... 554
Figure 9.12: Mean total energy consumption and electricity consumption for a mid-range hotel chain and German campsites in the Ecocamping network ... 558
Figure 9.13: Lifecycle GHG emissions for conventional and RE options, expressed per kWh heat delivered (see Table 9.13) ... 561
Figure 9.14: Indicative range of annual GHG avoidance achievable under different RE utilisation scenarios for a 300 pitch campsite with low energy consumption ... 562
Figure 9.15: Non-RE consumption across Ecocamping campsites ... 565
Figure 9.16: Window panels in the roof and suspended translucent ceiling allow natural light into the wash area of Kühlungsborn Campsite (above) and transluscent retractable roof of the wash area in the Jesolo International Campiste (below)... 567
Figure 9.17: Maximum daily solar hot water production throughout the year for 41 m2 of flat-plate solar panels installed on the east facing roof of a washroom in Seehof Campsite ... 569
Figure 9.18: Plate heat exchanger (left) and heat pump (centre) used to extract and upgrade heat from washroom and laundry greywater to heat washroom water at Kühlungsborn Camp ... 572
Figure 9.19: An example of solar PV cells integrated into a campsite building roof ... 572
Figure 9.20: Price range for wood fuel in UK, and price range for oil, gas and electricity across EU, expressed per kWh energy content ... 573
Figure 9.21: Modelled water consumption for a hypothetical 300-pitch four star (ADAC classification) campsite based on average and good water management practices ... 576
Figure 9.22: Potential water savings expressed per guest-night across best practice measures for a four-star (ADAC classification) campsite ... 578
Best Environmental Management Practise in the Tourism Sector ix
Figure 9.23: Estimated annual water savings (m3) and energy savings (kWh) per fitting achievable by
implementation of best practice on a 300-pitch campsite open 6 months per year ... 579
Figure 9.24: Example of a luxury low-flow rain-type showerhead installed in a luxury campsite, with a flow rate of 7 – 8 litres per minute ... 580
Figure 9.25: Median and top ten-percentile unsorted waste generation for good performing mid-range hotels and Ecocamping campsites ... 584
Figure 9.26: An example of annual GHG avoidance achievable for a single campsite achieving best, compared with average, waste management performance through either recycling or prevention ... 587
Figure 9.27: Important features of a user-friendly campsite recycling station ... 589
Figure 9.28: Basic schematic water circulation and filtration in a natural pool system ... 593
Figure 9.29: A natural pool regeneration zone in the Uhlenköper campsite, Germany ... 596
Figure 10.1: The size-class distribution of enterprises across different sectors within the EU-27, according to the number of persons employed (top figure) and gross-value-added (bottom figure) ... 599
x Best Environmental Management Practise in the Tourism Sector
List of Tables
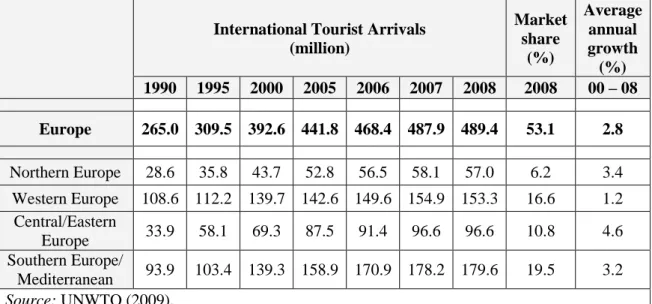
Table 1.1: Sub regional tourism activity by international arrivals across Europe ...1
Table 1.2: International tourist arrivals by number and share of receipts in 2008 ...2
Table 1.3: Structural profile of hotels and restaurants within the EU-27 in 2006 ...2
Table 1.4: Hotels and restaurants in the EU Member States, 2008 ...6
Table 1.5: Activities in tourism enterprises (hotels, restaurants and tour operators) and associated environmental aspects and pressures ... 10
Table 1.6: Estimated area requirements for different types of accommodation 1995-1999 ... 12
Table 1.7: Research priorities recommended by the Biodiversity and Tourism working group of the European Platform for Biodiversity Research Strategy ... 13
Table 1.8: Direct and indirect sources of water consumption by tourists ... 18
Table 1.9: Environmental hotspots and influencing actors across the tourism value chain ... 20
Table 2.1: Stages of the Plan-Do-Check-Act cycle, with reference to relevant use of this document (highlighted in red) ... 25
Table 2.2: Relevant environmental performance indicators for different tourism actors (key organisation level indicators highlighted) ... 29
Table 2.3: Sequence of best practice measures for environmental management of supply chains ... 33
Table 2.4: A summary of main priority products and services, and improvement options, for different tourism actors ... 35
Table 2.5: The two main types of standard representing front-runner ecoproducts promoted via labelling in this technique ... 37
Table 2.6: Common indicators and potential data sources for assessing the environmental impact of products and services ... 38
Table 2.7: A selection of mandatory and optional criteria related to green procurement contained in the EU Flower and Nordic Swan ecolabels for accommodation ... 42
Table 3.1: Some typical features of sustainable and unsustainable tourism ... 51
Table 3.2: Social, economic and environmental benefits of integrated coastal zone management ... 54
Table 3.3: Environmental indicators relevant to biodiversity management in destinations proposed by the EC Tourism Sustainability Group ... 54
Table 3.4: Draft Global Sustainable Tourism Council criteria particularly relevant to implementation of Destination Plans ... 56
Table 3.5: Three of the 15 programmes contained within Barcelona's Strategic Tourism Plan ... 59
Table 3.6: Target actions, progress, responsible partners and role of Area of Outstanding natural Beauty (AONB) Unit identified in Cornwall's AONB Delivery Plan ... 61
Table 3.7: Features of a Destination Plan according to SCBD (2007) ... 65
Table 3.8: Potential stakeholders who may participate in the development of Destination Plans ... 66
Table 3.9: Tools applicable at different management levels (most relevant level highlighted) ... 66
Table 3.10: Tourism management issues related to government area ... 67
Table 3.11: Case studies of possible best practice in sustainable tourism management... 68
Table 3.12: The main types of instrument that can be used by destination managers to protect and manage biodiversity within destinations ... 72
Table 3.13: Ecosystem services defined by the Millenium Ecosystem Assessment report (MEA, 2005) ... 73
Table 3.14: International and European legal frameworks potentially important for tourism and biodiversity planning ... 75
Table 3.15: Environmental indicators relevant to biodiversity conservation and management in destinations proposed by the EC Tourism Sustainability Group ... 76
Table 3.16: Draft Global Sustainable Tourism Council criteria particularly relevant to land planning and biodiversity conservation ... 76
Table 3.17: A selection of useful guidance documents to inform destination managers with respect to the management of biodiversity and ecosystem services ... 78
Table 3.18: An example of potential threats to visitor experience identified from a survey of visitors to the Otways region of Queensland ... 79
Table 3.19: Land-planning related target actions, progress, responsible partners and role of Area of Outstanding natural Beauty (AONB) Unit identified in Cornwall's AONB Delivery Plan.. 81
Table 3.20: Common pitfalls for the integration of biodiversity into destination management listed by SCBD (2010) ... 83
Table 3.21: Stages and tasks of CBD Guidelines for biodiversity management in tourism ... 84
Best Environmental Management Practise in the Tourism Sector xi
Table 3.23: Biodiversity related target actions, progress, responsible partners and role of Area of Outstanding natural Beauty (AONB) Unit identified in Cornwall's AONB Delivery Plan . 86
Table 3.24: Measures that can be used to control tourism impacts in protected areas ... 92
Table 3.25: Case studies of possible best practice management of protected areas ... 94
Table 3.26: Key environmental aspects and best practice measures for destination managers ... 101
Table 3.27: Relevant indicators for wastewater management within destinations ... 104
Table 3.28: Relevant indicators for waste management performance within destinations ... 104
Table 3.29: Relevant indicators for water supply management within destinations ... 105
Table 3.30: Relevant indicators for traffic management within destinations ... 105
Table 3.31: Performance of a best practice municipal effluent treatment plant (example: treatment plant 'Breisgauer Bucht' set-up and operated by a grouping of 29 municipalities) ... 108
Table 3.32: Performance of a medium-sized best practice municipal effluent treatment plant with special operation mode for peak loads resulting from tourism ... 110
Table 3.33: Input/output of the biogas plant in CH-Otelfingen for one year ... 113
Table 3.34: Case study examples of best practice in traffic minimisation ... 115
Table 3.35: Transport related target actions, progress, responsible partners and role of Area of Outstanding natural Beauty (AONB) Unit identified in Cornwall's AONB Delivery Plan 116 Table 3.36: The three main techniques employed for the events management project ... 121
Table 3.37: Major best practice measures for environmental management of events ... 122
Table 4.1: A summary of the objectives and methods of the Travelife initiative, and instruments and tools provided to help tour operators achieve them ... 129
Table 4.2: Passenger transport in the EU-27 between 1995 and 2006 ... 131
Table 4.3: Factors found to determine the efficiency of commercial air transport ... 132
Table 4.4: Best practice measures to mitigate the environmental impact of transport operations based on different approaches listed in order of priority (highest on top) ... 134
Table 4.5: Environmental benefits reported for specific measures to mitigate the impacts of air transport ... 135
Table 4.6: Direct and indirect emissions attributable to fuel consumption for the main fuel types .... 137
Table 4.7: Variation in direct emissions per km for a 747-400 type aircraft with journey distance ... 137
Table 4.8: Emission limit values for heavy duty diesel engines associated with various EURO standards, expressed per kWh engine output, and year of introduction ... 138
Table 4.9: Basic data related to environmental performance reported by TUI Nordic (2011) ... 138
Table 4.10: Three major certification standards used to verify the integrity of carbon offsetting schemes ... 139
Table 4.11: Schemes recognised by the European Commission for identifying sustainable biofuels, as of July 2011 ... 141
Table 4.12: Radiative Forcing Index factor applied to aircraft GHG emissions, depending on altitude (flight length) ... 143
Table 4.13: Examples of voluntary measures implemented by tour operators to improve the environmental management and performance of suppliers ... 150
Table 4.14: Examples of mandatory measures implemented by tour operators to improve the environmental management and performance of suppliers ... 151
Table 4.15: Benchmarks of excellence for accommodation providers, and achievable percentage reductions in environmental pressures compared with median values for a good-performing mid-range hotel chain and resort hotels ... 152
Table 4.16: Summary of key environmental performance indicators for accommodation providers, and relevant sections of this document ... 153
Table 4.17: Examples of environmental certification schemes for accommodation ... 154
Table 4.18: Examples of mandatory environmental criteria contained in the EU Flower ecolabel for accommodation ... 156
Table 4.19: Basic checklist of questions asked of Orizzonti accommodation suppliers ... 158
Table 4.20: Environmental checklist questions contained in the Travelife Hotel Sustainability Code (version 1.7) ... 158
Table 4.21: Destination improvement measures that can be directly or indirectly influenced by tour operators ... 166
Table 4.22: Travelife recommended best practice actions for destination management ... 167
Table 4.23: Key aspects for agreements between tour operators or representative groups and destination managers, and possible points of agreement (based on the Travel Foundation agreement with Cypriot tourism organisations) ... 170
Table 4.24: Environmental hotspots, potential environmental benefits and mitigation options for sustainable tourism packages ... 177
Table 4.25: Indicative magnitude of environmental pressure reductions per person achievable for a 10 day package tour involving transport over 2 000 km ... 178
xii Best Environmental Management Practise in the Tourism Sector
Table 4.26: Mode- and use-specific CO2 emission factors used to calculate the transport CO2 emissions
in the Austrian ecolabel for tourism packages... 179
Table 4.27: Tour operators and tours awarded the Austrian ecolabel for travel offers ... 181
Table 4.28: Actions awarded points according to criteria for the award of the Austrian Ecolabel to travel offers ... 182
Table 4.29: Examples of front-runner sustainable tours that avoid flying ... 183
Table 4.30: Benchmarks of excellence for accommodation best practice that could be used to indicate accommodation appropriate for front-runner tours ... 184
Table 4.31: Some best practice measures to influence customers/tourists at different stages of tour packages ... 188
Table 4.32: Principle and best practice actions for effective communication of sustainable messages 190 Table 4.33: Summary of best practice guest information measures ... 192
Table 4.34: Some widely applicable WWF code of conduct criteria for Mediterranean tourists ... 194
Table 4.35: Examples of tour operators communicating to customers about more sustainable behaviour ... 196
Table 4.36: Best practice measures for office and retail operations, and cross-links to relevant BEMP descriptions within this document (measures described in this section highlighted in bold) ... 199
Table 4.37: Relevant environmental indicators for different aspects of office and retail operations .... 200
Table 5.1: Water use across different accommodation types, based on a sample of 375 enterprises in Austria and Germany ... 205
Table 5.2: Portfolio of techniques important for the minimisation of water consumption ... 208
Table 5.3: Measures to monitor and maintain water systems in accommodation ... 212
Table 5.4: Water flow rates and daily/annual wastage from different types of leak ... 212
Table 5.5: A selection of benchmarks proposed for water use in different types of accommodation . 216 Table 5.6: Elaboration of terms in the water cost equation ... 222
Table 5.7: Summary of the main fittings that can be installed as either simple retrofits to existing fittings, or as complete new fittings during construction/renovation to reduce water consumption in guest areas ... 227
Table 5.8: Proposed benchmarks of excellence for water use in guest areas ... 230
Table 5.9: The main fixed features that affect water use in showers ... 231
Table 5.10: Flow rate in response to pressure from a low-flow showerhead with flow restrictor ... 232
Table 5.11: Annual financial savings and worst-case payback estimated for replacement of average water fittings with efficient water fittings ... 238
Table 5.12: Portfolio of housekeeping measures to reduce environmental impact of accommodation . 243 Table 5.13: Key criteria and associated environmental benefits represented by various product labels ... 244
Table 5.14: Relevant environmental indicators for different aspects of housekeeping ... 246
Table 5.15: Summary of environmental performance of textiles made from different fibres during production and servicing, and perceived quality ... 249
Table 5.16: Annual purchase and laundering costs for cotton-polyester and cotton sheets bought for EUR 5 each ... 254
Table 5.17: Portfolio of best practice measures for small-scale laundry operations ... 260
Table 5.18: Indicators and benchmarks (BM) of best practice for water, energy and chemical use efficiency in laundry processes ... 263
Table 5.19: Load ratios for different textiles with light and heavy soiling, and example number of items that can be washed in a 100 L (10 kg rated capacity) machine ... 267
Table 5.20: Typical degree of soiling for hospitality laundry ... 267
Table 5.21: Main stages of the washing and drying process performed by washer-extractors... 268
Table 5.22: Examples of savings achievable from implementation of best practice under different situations ... 273
Table 5.23: Portfolio of best practice measures for large-scale laundry operations ... 278
Table 5.24: Energy and water savings achievable from various measures to improve laundry efficiency ... 279
Table 5.25: Features of CBW systems to optimise performance across the four main factors affecting wash effectiveness ... 282
Table 5.26: Residual moisture contents after press dewatering under varying conditions ... 285
Table 5.27: An example of typical daily energy losses for a rigid-chest ironer and a heating-band ironer of the same capacity, both heated by steam ... 288
Table 5.28: Important economic considerations associated with laundry best practice measures ... 291
Table 5.29: Best practice measures to reduce water, energy and chemical consumption in swimming pool areas ... 297
Best Environmental Management Practise in the Tourism Sector xiii
Table 5.31: Recommended pool water temperatures for different pool types ... 302
Table 5.32: Requirements and guidance for ventilation in three main zones of pool centres ... 303
Table 5.33: Water quality parameters for 'fresh' and stored roof run-off water ... 309
Table 5.34: An example of a small rainfall collection (above) and storage (below) system, from the Rafayel Hotel in London ... 311
Table 5.35: Sequence of steps in grey water recycling implemented at NH Campo de Gibraltar hotel 313 Table 6.1: Typical waste constituents from different types of hotel, according to Danish waste classification ... 322
Table 6.2: Waste percentages from Survey among German and Austrian hotels ... 322
Table 6.3: Best practice measures to prevent and avoid waste ... 323
Table 6.4: GHG emissions avoided per kg of different types of waste avoided ... 324
Table 6.5: Average density of non-compacted waste fractions from different establishments ... 326
Table 6.6: Summary of items to avoid, items to select and actions to prevent waste in accommodation ... 328
Table 6.7: Best practice measures to separate and recycle waste ... 332
Table 6.8: GHG emissions avoided per kg of different types of waste recycled ... 333
Table 6.9: Recycling options and associated environmental benefits for different materials ... 334
Table 6.10: GHG and energy savings from recycling compared with land-filling, and an example of savings achievable for a small 14-room hotel (Figure 6.8) ... 335
Table 6.11: Main types of plastic, their identifiers, typical applications, and recyclability ... 341
Table 6.12: Waste compactor and compressed cardboard for collection from a large hotel ... 342
Table 6.13: A breakdown of waste management costs for one German hotel ... 346
Table 6.14: Some examples of economic savings arising from recycling actions ... 346
Table 6.15: Analysis of the wastewater after treatment for the plant of the Hotel Schnindelbruch ... 352
Table 6.16: Analysis of the wastewater after treatment discharged from the plant for the campsite Glücksburg / Holnis ... 353
Table 6.17: Applicability, properties and characteristics of available pre-treatment techniques for wastewater from huts in alpine regions (IEVEBS, 2010a and b)... 357
Table 6.18: Applicability, properties and characteristics of available biological treatment techniques for wastewater from huts in alpine regions (IEVEBS, 2010a and b)... 358
Table 7.1: Financial attractiveness of different energy demand and supply measures in Northern Ireland, ranked in descending order ... 362
Table 7.2: Modelled energy savings achievable from best practice in a 100-room hotel, and portfolio of associated best practice... 364
Table 7.3: Best practice measures for the monitoring and management of energy consumption in accommodation premises ... 367
Table 7.4: Common units of energy delivered to accommodation, and appropriate conversion factors to calculate final energy consumption, primary energy consumption and GHG emissions ... 370
Table 7.5: Areas and processes responsible for a high proportion of energy demand in accommodation premises, and data sources for energy consumption ... 376
Table 7.6: Two exemplary building energy standards ... 385
Table 7.7: Recommendations and best practices of elements for the PassiveHouse standard ... 387
Table 7.8: Conductivity, thickness and the calculated u-values of the outer walls, the basic ceiling and the flat roof ... 389
Table 7.9: Actual costs for the refurbishment of the extension building of the Hotel Victoria ... 391
Table 7.10: Cost-benefit ratio of different building envelope retrofit components... 391
Table 7.11: Examples of SME hotels achieving 'excellent' performance ... 392
Table 7.12: Key measures to reduce the energy consumption of HVAC systems considered in this section ... 395
Table 7.13: Typical specific heating demand across a selection of building types ... 399
Table 7.14: Delivery temperatures for different types of heat distribution system ... 401
Table 7.15: Recommended temperature settings for accommodation zones in a cool climate ... 401
Table 7.16: Checklist for aspects and associated improvement actions ... 403
Table 7.17: Main heat pump and geothermal energy applications... 406
Table 7.18: Minimum heating efficiency requirements for heat pumps according to the EU Flower ecolabel criteria under various operating conditions ... 412
Table 7.19: Minimum cooling efficiency requirements for heat pumps according to the EU Flower ecolabel criteria under various operating conditions ... 413
Table 7.20: Main advantages and disadvantages of different heat sources ... 414
Table 7.21: Examples of theoretical COPmax values for a low and high temperature distribution system ... 415
xiv Best Environmental Management Practise in the Tourism Sector
Table 7.23: Comparison of input energy costs per unit cooling output for different cooling sources ... 418
Table 7.24: Key characteristics of the geothermal heating and cooling systems in the Crown Plaza Copenhagen Towers ... 419
Table 7.25: Appearance of different types of lamps ... 424
Table 7.26: Specific properties of different types of lighting ... 424
Table 7.27: Description of terms relating to important features of lighting ... 431
Table 7.28: Specific lighting requirements for indoor areas according to standard EN 12464 ... 432
Table 7.29: Lifecycle costs for low energy LED and CFL lamps, compared with conventional equivalents, calculated over the lifetimes of the low-energy lamps (40 000 and 8 000 hours, respectively) ... 434
Table 7.30: Descriptions and applicability of major best practice RE options for accommodation ... 439
Table 7.31: Achievable annual GHG avoidance scenarios for RE installation in a 100-room hotel ... 443
Table 7.32: Primary energy ratios and lifecycle GHG burdens per kWhth or kWhe delivered energy for different RE technologies from the GEMIS lifecycle assessment database ... 444
Table 7.33: Typical moisture and energy contents of supplied wood fuel ... 445
Table 7.34: Cross-media effects for different RE options ... 446
Table 7.35: EN 303-5 test stand emission limit values for pellet boilers ... 447
Table 7.36: EcoDesign performance indicators for pellet boilers and combined pellet/wood-chip boilers ... 447
Table 7.37: Feed-in tariff rates for electricity generated by solar PV systems of different capacity in the UK ... 453
Table 8.1: Widely-used third-party basic environmental standards applicable to product groups ... 460
Table 8.2: Relative advantages of organic production compared with mainstream production from a farm system and product lifecycle perspective... 462
Table 8.3: Potential GHG emission reductions arising from the sourcing of lower-impact options of three products ... 463
Table 8.4: Relevant product standards (and criteria) for broad product groups, classified as 'basic' and 'high' environmental performance ... 464
Table 8.5: Examples of free online sustainable sourcing guidance in the UK ... 471
Table 8.6: Some of the produce grown on-site at Huerta Cinco Lunas ... 472
Table 8.7: Ranking of different organic waste management options in terms of environmental performance according to Miljøstyrelsen (2004) ... 479
Table 8.8: Operation of the Oilsense used oil collection system ... 487
Table 8.9: Calculation of annual savings and payback period for installation of an automated composting unit ... 491
Table 8.10: Examples of best practice in organic waste management ... 492
Table 8.11: Important measure to reduce water (and energy) consumption across kitchen processes .. 495
Table 8.12: Water savings achievable following implementation of best practice measures ... 496
Table 8.13: Relevant indicators of best practice across environmental aspects ... 497
Table 8.14: Recommended dishwasher types for different meal serving rates ... 499
Table 8.15: Energy star criteria (maximum idle energy and water consumption) for high temperature dishwashers ... 500
Table 8.16: Some key points to ensure efficient operation of dishwashers ... 503
Table 8.17: Example purchase prices for different types and sizes of dishwasher ... 505
Table 8.18: An example of cost and payback period for optional modules on a large (150 rack-per-hour) tunnel dishwasher, assuming 6 hour per day 365 day per year operation ... 506
Table 8.19: Best environmental management practice measures to reduce kitchen energy consumption ... 511
Table 8.20: Environmental benefits achievable for key efficient cooking measures ... 512
Table 8.21: Environmental benefits achievable by measures to improve refrigeration performance .... 514
Table 8.22: Typical efficiency characteristics of different types of hob oven ... 515
Table 8.23: Energy Star eligibility criteria for cooking appliances ... 516
Table 8.24: An example of monthly energy consumption data for the restaurant area of a hotel ... 519
Table 8.25: Characteristics of gas, standard electric and induction hob ovens ... 520
Table 8.26: Best practice measures to reduce energy consumption in cold rooms ... 523
Table 8.27: Centralised refrigeration compressors (left) and heat exchange from high temperature refrigerant exiting the compressors to the hot water system (right) in The Savoy ... 525
Table 8.28: UK guidelines for food storage temperature ... 526
Table 8.29: Conditions relating to the applicability of energy-saving measures, and relevance for SMEs ... 526
Table 9.1: Key features of best practice for campsites and overlap with best practice described in other sections of this document for other actors (serviced accommodation and kitchens) ... 533
Best Environmental Management Practise in the Tourism Sector xv
Table 9.2: EU Flower Ecolabel criteria for accommodations and campsites relating to environmental
education ... 536
Table 9.3: Advice to caravan owners to reduce the environmental impact of travel ... 539
Table 9.4: Good practice principles and measures for trekking and camping in the wilderness promoted by the Leave No Trace campaign ... 541
Table 9.5: Nature and sustainability educational courses offered at Denmark Farm conservation centre ... 543
Table 9.6: Portfolio of best practice measures for outdoor management ... 546
Table 9.7: Environmental benefits of best practice measures for outdoor areas ... 547
Table 9.8: Relevant indicators for best practice ... 548
Table 9.9: EU Flower Ecolabel mandatory and optional criteria for accommodation and campsites and relating to management of outdoor areas ... 548
Table 9.10: Main components and associated pressure drop for drip-irrigation systems ... 553
Table 9.11: Examples of good practice in outdoor area and biodiversity management ... 556
Table 9.12: Best practice measures for campsites to minimise energy consumption ... 560
Table 9.13: Common units of energy delivered to campsites, and appropriate conversion factors to calculate final energy consumption, primary energy consumption and GHG emissions ... 563
Table 9.14: Some relevant indicators of environmental performance for campsites ... 564
Table 9.15: Cross-media effects for different RE options ... 566
Table 9.16: Typical moisture and energy contents of supplied wood fuel ... 569
Table 9.17: Images of the gasifying wood boiler installed at Seehof Campsite ... 570
Table 9.18: Best practice measures to reduce water consumption on campsites ... 577
Table 9.19: Flow rate benchmarks for low-flow fittings ... 580
Table 9.20: Annual financial savings associated with water and energy reductions achievable following replacement of average fittings with widely available efficient fittings ... 581
Table 9.21: Best practice measures to minimise waste on campsites ... 585
Table 9.22: GHG emissions avoided through the prevention and recycling of different waste fractions ... 586
Table 9.23: Signage and performance in a campsite recycling station ... 590
Table 9.24: Main construction techniques for dividing walls in a natural pool ... 595
Table 10.1: European Commission definitions of 'micro', 'small', 'medium' and 'large' enterprises ... 598
Table 10.2: Applicability of BEMP sections within this document to SMEs ... 601
Table 10.3: Proposed energy saving measures and associated economics for the Hotel Palacio ... 604 Table 10.4: Summary of the total investments and savings over the ten-year energy-service contract 605
xvi Best Environmental Management Practise in the Tourism Sector
EXECUTIVE SUMMARY
A.1. GENERAL ASPECTS, STRUCTURE AND CONTENT OF THE
DOCUMENT
A.1.1 General aspects
BackgroundThis technical report represents the scientific and technical basis of the Sectoral Reference Document (SRD) on Best Environmental Management Practice in the Tourism Sector which has been developed according to Article 46 of the Eco-Management and Audit Scheme (EMAS) regulation(1).
Objective and intentions of this document
This document is intended to support environmental improvement efforts of all actors in the tourism sector. It can be used by all organisations and stakeholders of the sector who seek for reliable and proven information to improve their environmental performance. In case they have an environmental management system, such as EMAS, they can also use the document to develop it further, especially with respect to continuous environmental improvement measures and targets.
For this purpose, this document describes best environmental management practices (BEMPs), i.e. those techniques, measures or actions that allow organisations of a given sector to minimise their impact on the environment in all the aspects under their direct control (direct environmental aspects) or on which they have a considerable influence (indirect environmental aspects). Following this integrated approach, the scope of this document is broad and covers the most important direct and indirect environmental aspects. Thus, not only the direct construction operations but also the land planning, building design, operation and end-of-life were considered in detail. For the different BEMPs, the document also present appropriate environmental performance indicators which enable organisations to monitor their performance and compare it over time and with benchmarks. Indeed, the document also reports a list of benchmarks of excellence representing the exemplary environmental performance achieved by frontrunner organisations in the sector.
Approach used to develop this document
A Technical Working Group (TWG) was set up to get a broader access to the sector, to obtain more qualified information and to verify the techniques described as well as to draw the conclusions with respect to appropriate environmental performance indicators and benchmarks of excellence. There was one meeting at the beginning of the whole development process on 31 March 2011 (so-called kick-off meeting) as well as a final meeting at the end on 24-25 November 2011 (final meeting).
A lot of information needed to draft this document was already publicly available from various sources, including a number of comprehensive reports. That was supplemented with information collected directly from other stakeholders, including consultancy firms, non-governmental organisations, and technology providers.
The techniques described in the document were selected according to the frontrunner approach, i.e. by identifying frontrunner organisations and studying in-depth their performance and the frontrunner techniques implemented by them. This was required as the benchmarks of excellence are a major outcome of the whole process. For this purpose, frontrunner organisations and techniques were identified and evaluated in detail through desk research and expert consultation. If needed, site visits were carried out to obtain further required information and understanding, both for technical and economic considerations.
The techniques are presented according to a common structure. Amongst others, this includes their “applicability”, to provide clear indications under which conditions or circumstances a
(1) Regulation (EC) No 1221/2009 of the European Parliament and of the Council of 25 November 2009 on the voluntary participation by organisations in a Community eco-management and audit scheme (EMAS), OJ L 342, 22.12.2009
Best Environmental Management Practise in the Tourism Sector xvii certain technique can be implemented (technical feasibility) as well as economic information concerning investment and operation costs (economic viability).
A.1.2 Structure of the document
The document covers the whole value chain of the tourism sector, from supply chain to services provided. On the basis of mass stream thinking, the following input/output scheme has been used to structure the document.
xviii Best Environmental Management Practise in the Tourism Sector Overview of inputs and outputs of the tourism sector
Best Environmental Management Practise in the Tourism Sector xix At the heart of the document are the 'Best Environmental Management Practice' (BEMP) descriptions. Reflecting the overview above, they are grouped as follows:
Cross-cutting BEMPs applicable to all actors (Chapter 2)
BEMPs for destination managers, with an influence over all aspects displayed in the figure above (Chapter 3)
BEMPs for tour operators, including their influence over transport operations, accommodation, and tourist choice/behaviour (Chapter 4)
BEMPs to minimise water consumption in accommodation (Chapter 5) BEMPs to minimise waste in accommodation (Chapter 6)
BEMPs to minimise energy consumption in accommodation (Chapter 7) BEMPs for kitchen operations (Chapter 8)
BEMPs for campsites (Chapter 9)
The content of these chapters covers the most significant environmental aspects of the actors (sub-sectors) targeted by this document.
The structure to describe the techniques is very similar to the one used in the Best Available Techniques Reference Documents (BREFs) according to the Industrial Emissions Directive, which replaced the IPPC Directive with effect from January 2014.
In addition, Chapter 1 contains general information about the tourism sector such as data on turnover and employment as well as the direct and indirect environmental aspects which are illustrated by means of the overview of the inputs and outputs (see figure above).
Chapter 10 of this technical report provides a brief overview for micro-, small- and medium-sized enterprises. Specifically, it lists the applicability of the BEMP techniques described in this document to SMEs, and highlights any restricting factors particularly relevant to micro-enterprises and SMEs. Options to facilitate SMEs with environment-related investments are referred to.
Chapter 11 of this technical report contains concluding tables that compile the information from BEMPs description. Conclusions are drawn with respect to key environmental performance indicators and benchmarks of excellence.
xx Best Environmental Management Practise in the Tourism Sector
A.2. ENVIRONMENTAL INDICATORS AND BENCHMARKS OF
EXCELLENCE
A.2.1 Approach to conclude on environmental indicators and benchmarks
of excellence
The conclusions on the environmental indicators and benchmarks of excellence have been derived by expert judgement of the European Commission through the JRC-IPTS, and agreed by the technical working group (TWG) during the final meeting in November 2011. This group was composed of companies, umbrella associations, verification bodies, accreditation bodies and other stakeholders. The European Commission organised and chaired the meetings of the TWG.
A.2.2 Presentation of the environmental indicators and the benchmarks of
excellence
The conclusions on the environmental indicators and benchmarks of excellence associated with the application of BEMP are compiled in the following summarizing table which is structured according to key environmental areas. The table contains also cross references to the background information on the BEMPs in Chapter 2-9 of this document. This executive summary can be used as a stand-alone document.