Planar Magnetic Design
Abstract:
Excelsys Technologies concentrates on the design of AC/DC designs and in many of these designs the
output stage will be a synchronous buck. This paper focuses on the design procedure for optimizing planar inductor design in Point of Load (POL) application. It takes into account the effect of non-sinusoidal voltage waveforms, low duty ratios and high frequency, and how these effect the optimization of the inductor design. This paper focuses on a typical non isolated switching stage which incorporates extreme duty ratios and high switching frequencies (100’s kHz range).
Introduction
A significant limit in reducing the size of PCB boards in switch mode power supplies tend to be as a result of the large discrete magnetic requirement. There is a high level of research into developing silicon based magnetics, [1] - [4]; however this research is still on-going and has not filtered into main stream industry design. As an intermediate step towards integration on silicon, planar technology can be utilised with PCB windings. Planar magnetic technology offers number of advantages over conventional magnetic designs, planar geometries have a higher surface area to volume ratio, and they are therefore preferred for their thermal performance capabilities, low profile and high repeatability in manufacturing. The mechanical integrity of planar structures offers another potential advantage, i.e. they are less likely to be affected by angular forces hence they have a lower centre of gravity in comparison to other conventional shapes, and tend to be more stable [5]. However reason why they have not been fully exploited is due to their limitations; low copper filled area and high frequency operation is required for miniaturisation, but with increased frequency comes increased losses. However the demands for low profile magnetics in Point of Load (POL) applications have made planar technology more established. The high power loss density and low profile provided by planar magnetics make them desirable in switch mode power supplies. When combined with PCB copper windings, the possibility for integration onto the power supply main PCB makes them a competitive technology for POL applications.
In this paper a discussion of the issues associated with magnetic design when dealing with POL applications like the Voltage Regulator Module (VRM) and a design procedure will be presented to address these issues.
Non-isolated Inductor Design Issues
Non isolated stages such as a VRM, will be expected to operate at high slew rates >100A/µs, high current and low voltage while maintaining a low profile.
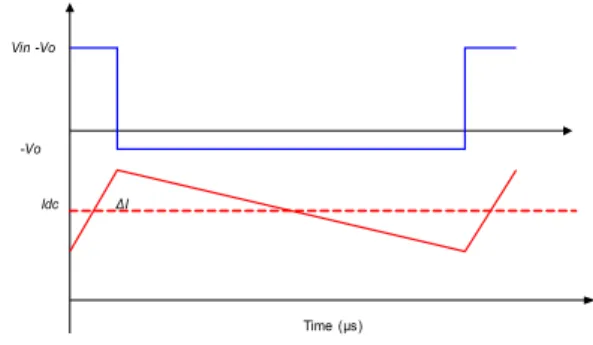
Vin -Vo
-Vo Idc ΔI
Time (µs)
Figure 1: Inductor Voltage and Current Waveforms with a Duty Ratio of 0.108
Multiphase Interleaved Converter is the most common topology employed for a VRM, inductor current and voltage waveforms in one phase of a multiphase buck converter are given in Figure 1, where the waveforms are drawn to scale for Vin =
12 V, Vout = 1.3, Io = 30 A and the current ripple
ratio, (ΔIL / Idc), is 0.5. As observed these are
non-sinusoidal, this will impact the magnetic losses, as it will be shown in section III that non-sinusoidal core losses are significantly larger than sinusoidal at low duty ratios.
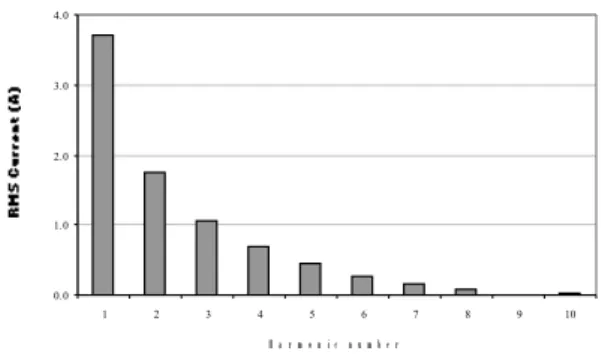
Corresponding current harmonics are given in Figure 2 for a fundamental frequency of 500 kHz, from which it is found that in the RMS current, the contribution of components up to the 3rd harmonic
is more than 50 % of the fundamental contribution. With decreasing output voltage levels specified for future VRM’s, the harmonic contributions will be greater as the inductor duty cycle reduces. Obviously combined with the need to operate at higher switching frequencies, AC winding losses will increase as well as core losses of the magnetics, and the impact of lower duty ratios on the switches will further deteriorate the efficiency
of the VRM. These are some of the challenges facing the VRM component designers.
Figure 2: Current Harmonic Amplitudes for an Inductor Ripple Ratio of 0.5 0 1
( )
(
c o s
ns i n
n)
nf
x
a
a
n x
b
n x
n Bn 1 5.252 2 2.475 3 1.491 4 0.962 5 0.624 6 0.389 7 0.221 8 0.100 9 0.015TABLE 1: HARMONIC COEFFICIENTSFOR 500 KHZ WITH D = 0.108
Inductor Design Procedure
When designing magnetic components for SMPS like VRMs, accurate prediction of core loss and winding loss is extremely important to ensure that the overall efficiency of the circuit is maintained. Taking the most accurate analytical models for power losses produced within an inductor, a procedure was devised to design magnetic components for POL applications like the VRM. This procedure is based on Ferroxcube application note [6]; however the models were adapted to account for high frequency effects and non-sinusoidal core loss. Designs are targeted at producing the smallest possible solution rather than the most efficient solution, as space requirement on PCBs tend to be an extremely important design factor e.g. ideally VRMs are placed in close
proximity to the processor in order to reduce interconnect impedance, and therefore large magnetic components would not be desirable. .
Core Loss
Manufacturers usually provide sinusoidal power loss density curves (Pv) for their materials over a
range of frequencies, or sometimes they may provide coefficients that can be used to generate power loss density curves. These coefficients are based on the Steinmetz Equation for sinusoidal core loss, and can be easily applied to produce power loss density curves.
v m s w
ˆ
P C f B
α βwhere Cm, is a manufacturer constant and is
dependent on temperature; this is typically set to 75
ºC for ferrite materials; α, β are Steinmetz Coefficients and
B
ˆ
is the peak sinusoidal flux density.Losses due to sinusoidal waveforms can be considerably lower than losses under non-sinusoidal conditions; this is particularly true for square voltage waveforms with low duty ratios. Due to the non-sinusoidal nature of inductor waveforms in SMPS such as those shown in Figure 1, many researchers have done extensive work on predicting core losses under non-sinusoidal conditions [7] - [11].
A. Brockmeyer et al. [7], [8] investigated a method to calculate core loss for any arbitrary waveform based on the Steinmetz Coefficients. This method is commonly known as the Modified Steinmetz Equation (MSE). It allows for the calculation of an equivalent frequency and is motivated by the fact that core loss is dependent on dB/dt (the rate of change of flux density) rather than simply on its level. -1 v m e q s w 2 eq 2 2 0
ˆ
2
TP C f B f
dB
f
d t
B
d t
⎛
⎞
⎜
⎟
Δ
⎝
⎠
α βπ
where ΔB is the flux swing and feq is the equivalent
frequency. While it is a relatively simple method to apply, the method in which dB/dt is considered is not accurately matched to the frequency dependence of the Steinmetz Equation [10]. In other words, when comparing the MSE and the 0.0 1.0 2.0 3.0 4.0 1 2 3 4 5 6 7 8 9 10 H a r m o n i c n u m b e r
MSE over-estimates the equivalent frequency while under-estimating the power losses.
In order to clear up this anomaly and other anomalies in the MSE, Charles R. Sullivan, et al. [10], [11], developed a method for accurately predicting core loss in MnZn ferrite cores; this became known as the Improved General Steinmetz Equation (iGSE). -v i 0 m i 2 --1 0 1 ( 2 ) c o s s i n T dB P K B d t T d t C K d Δ
α β α π α β α α π θ θ θThe authors tested a 3C85 MnZn power ferrite with two sets of six turns with a fundamental frequency of 20 kHz at its 3rd harmonic. Core loss
measurements indicated that the iGSE accurately predicted core losses; however a 57 % error was observed with the MSE at certain amplitudes of the 3rd harmonic. The accuracy in the model for other
material types is unknown.
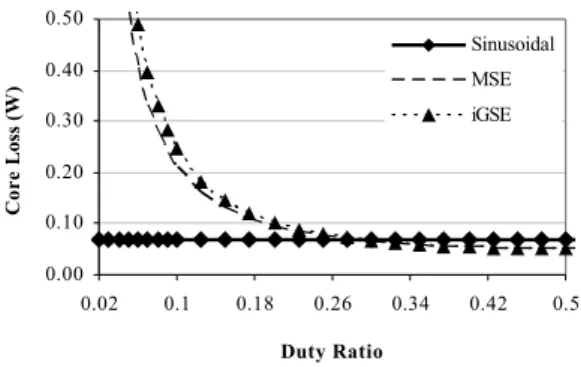
While it is clear that there are significant differences between the various models of core loss, the extent of these differences in a VRM inductor is unknown. Therefore results of core losses predicted using various loss models are presented in Figure 3 for an ER18 core at 500 kHz and a peak flux density of 39 mT. The first thing to note is that at low duty ratios, there is a significant difference between non-sinusoidal losses and sinusoidal losses. Since today’s VRMs are operating at duties of less than 0.2, the impact of non-sinusoidal core losses is quite significant. Also at a duty ratio of 0.1 which is close to current VRM designs, losses predicted by the iGSE are approximately 20 % bigger than predicted by the MSE. Therefore the iGSE is utilized in the prediction of non-sinusoidal core loss as it predicts the largest loss and can therefore be assumed as the worse case prediction. It should be noted that the analysis is applied using the Steinmetz coefficients provided by the manufacturer which are averaged over a range of frequencies [6].
Figure 3: 500 kHz Core Loss Prediction for ER18 One Turn Design
Ultimately it is the thermal performance of the material that limits the maximum core loss allowed [12]. For ferrite materials, the maximum recommended operating temperature is set to 100
ºC; therefore a conservative value of temperature rise (ΔT) of 50 ºC is assumed for an ambient temperature (Tamb) of 25 ºC. This provides the limit
for maximum allowed core loss density for a given a core volume, Ve as given by:
core-max e
12
T
P
V
Δ
for Ferroxcube’s planar cores. For a four phase interleaved buck converter, the maximum allowed flux density in a given core area (∆Bmax) can be
deduced by equating equations and; for the triangular flux waveform applied, the following expression is derived:
c o r e - m a x s w m a x i 1 1 e1 2
1
1
1
T
P
f
B
K
V
DT
D T
Δ
Δ
Δ
β α αThe minimum number of turns (Nmin) that will
ensure that the maximum flux density is handled within the core is then given by:
i n o u t min s w c m a x
(
-
)
D V V
N
f A B
Δ
where Ac is the area of the core.E01.R00 Page 3 of 8 0.00 0.10 0.20 0.30 0.40 0.50 0.02 0.1 0.18 0.26 0.34 0.42 0.5 Duty Ratio C or e L os s (W ) Sinusoidal MSE iGSE
Winding Loss
Once the minimum number of turns is deduced, it is essential to understand another constraint of the inductor design; i.e. the current limit / winding loss. In order to find the maximum number of turns (Nmax) that can fit within the window of the core
and which will be large enough to carry the AC and DC components of current, the limits of PCB windings are required. In this case a six layer PCB board with a track to cut-out spacing of 400 µm and track to track spacing of 200 µm is assumed. Utilizing Figure 6-4 from the IPC-2221 standard for internal PCB conductors [13], the recommended copper area is 700 mil sq for a maximum current of 15 A, which translates to 33 A/mm2. Therefore a maximum current density (J)
was set at 30 A/mm2; in practice a much larger
copper area is utilized in all designs considered. This allows the calculation of the minimum total copper width (Wc-min) of each turn required to carry
the total current.
rms c-min c
I
W
Jh
where hc is the height of the copper. Therefore the
maximum number of inductor turns, Nmax that can
be fitted in the window area is deduced from the geometry of the window:
core m a x p c b c-min
- 2
W
s
N
N
W
where Npcb is the number of PCB layers, Wcore is the
width of the window and s is the spacing between the PCB copper and the core.
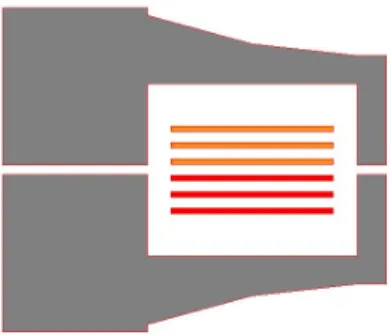
This assumes that the winding configuration maximizes the copper area in a given core window; therefore if a minimum number of two turns are required to satisfy the core losses, then one turn can be realized on the three bottom layers with the 2nd
turn on the top three layers of a six layer board as in Figure 4.
Figure 4: Two PCB Windings Realisation in an ER14.5 Core Otherwise, copper windings are placed in parallel on the horizontal plane as in Figure 5.
Figure 5: Four PCB Windings Realization in an ER14.5 Core
For every value of turn number in the range of Nmin
to Nmax, a gap, g, is calculated to provide the
inductance using. It is assumed that the gap is placed on all legs of an ER core; this simplifies the manufacturing process while also providing a distributed gap, hence keeping AC winding losses at a minimum. Fringing flux around a gap reduces the total reluctance of the magnetic path while increasing the inductance by a factor F [14]. This fringing factor is taken into account in the calculation of the gap.
2 c o c 2 c o e e r
2
1
l n
N A
g
L
g
M T L
F
g
A
F N A
L
l
g
g
⎛
⎞
⎜
⎟
⎝
⎠
⎛
⎞
⎜
⎟
⎝
⎠
µ
µ
µ
produced due to fringing flux of the gap and MTL
is the mean turn length; µo, µr are the permeability
of free space and relative permeability of the material respectively. There is some iteration needed of so that Le equals the inductance required
(L). It should be noted that since a distributed gap technique is being utilized, the gap length is halved in the above equations for ER cores. The accuracy in the gap calculation is confirmed using FEA (Final Element Analysis) where care is given to modeling 3D ER core structures as equivalent 2D structures in cylindrical coordinates. Cross sections of 2D equivalent models are shown in Figures 4 and 5, where it is seen that the height of the core varies with radius as recommended in reference [15].
Once the core losses and gap length are calculated for all possible values of N, winding losses are calculated using FEA. Total winding loss is equal to the sum of DC winding loss and AC winding loss. DC copper losses are estimated at low frequency i.e. 60 Hz in FEA simulations. Harmonic current amplitudes up to the 25th harmonic
frequency are estimated using Fourier analysis of the current waveform; these are used to predict the AC winding loss. The first 9 Fourier coefficients are given in Table 1.
2 c u d c a c 2 d c d c d c a c a c i a c i 1 i
P
P
P
P
I
R
P
I
R
Raci is calculated at each harmonic frequency in
FEA simulation, where the current is normalized to 1 A. Models for predicting Raci in closed core
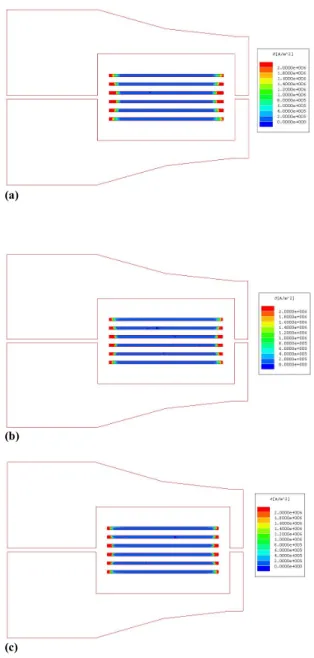
converters are available, but these are not suitable as they assume a 1D current distribution within the windings [16]. However, as seen in Figure 7 (a), due to the presence of the gap the current distribution is 2D in this case. It can be seen in Figure 7 that as the harmonic frequency increases from a fundamental frequency of 500 kHz, the current is becoming more confined to the edges of the tracks as seen with the 2nd harmonic frequency
in Figure 7 (b) and the 3rd harmonic frequency in
Figure 7 (c). It should be noted that the most significant current component is the DC component (30 A vs. 5.25 A amplitude for the 1st harmonic),
and that this is distributed more or less uniformly over the copper area.
(a)
(b)
(c)
Figure 7: Current Distribution in a Single Planar Turn of an ER18 core at a Frequency of
(a) 500 kHz (b) 1 MHz (c) 1.5 MHz
Total winding losses are then checked to ensure that they are within the maximum equivalent DC loss for a given cross sectional area. The equivalent maximum current, Imax, for a given copper area is
calculated based on the assumption that the maximum current density, J (30 A/mm2) is
achieved. This is given in:
2 c u - m a x d c m a x m a x c u
P
R
I
I
A
J
where Acu is the area of copper for one turn.
Figure 8: Effect of High Frequency Harmonics on the Overall Winding Losses
Figure 8 shows the winding loss distribution in a one turn solution in an ER18 core with a fundamental frequency of 500 kHz; details of this design are given in Table II. When comparing the effect of the first 25 harmonics (AC25) on the winding losses in comparison to only DC losses or when the first harmonic is taken into account, it can be seen that the effect of AC winding losses due to the higher harmonic frequencies only increases the total winding loss by a factor of 3.5 %. However, the contribution of the fundamental harmonic loss is significant compared to DC winding loss alone. Core loss decreases with increasing turn count while copper losses increases. Therefore to ensure optimum design, the turn count is chosen where core and copper losses are equal, as this usually corresponds to the minimum loss design as shown in Figure 9.
Figure 9: Losses versus Turn Count for ER18, 500 kHz, 155 nH with a ΔI of 0.5 ΔIL (A) Pac1 mW Pac mW Pcu mW Ptotal mW 10 214 247 454 675 15 56 65 273 493 30 26 30 238 458
TABLE 1I: INDUCTOR SOLUTIONSFOR 500 KHZ, FORARANGEOF
INDUCTORCURRENTRIPPLES
Number of turns =1 P Core = 221mW
Pdc = 207mW
As mentioned previously one of the limitations in using planar magnetics is the low number of turns allowed within commercial cores. In the case of Figure 9, the optimum turn count for the lowest losses is one.
Saturation
Finally the design is checked to ensure that the saturation limit for the material is not exceeded. This involves calculating the maximum applied flux density (Bm) and ensuring that it is lower than
the saturation flux density, Bsat, of the magnetic
material i.e. approximately 380 mT for 3F3.
o m e r
ˆ
-NI
B
l g
g
µ
µ
Once all the criteria are met the design is complete. However, if any of the limits (core, winding loss or saturation) can not be satisfied the next largest core size is chosen and the design procedure is repeated.
Operation at MHz Switching Frequency
Manufacturers provide a range of materials suitable for high frequency designs. For ferrite, materials up to 10 MHz sinusoidal operation are available. A high level of research in the development of high frequency materials for inductor designs for POL applications using electroplated techniques has been investigated [17], [18]. However these techniques are not commercially available for planar core shapes at present, and therefore designs for high frequency is normally based on commercial available ferrites.
Increasing switching frequency should theoretically reduce the size of the magnetic components, as given by the area product; the product of the core and window areas of a given inductor. It is worth
0.00 0.05 0.10 0.15 0.20 0.25 0.30 0 5 10 15 2 0 2 5 3 0 3 5 L o a d C u r r e n t ( A ) DC+AC1 DC+AC25 DC 0.0 0.5 1.0 1.5 2.0 2.5 0 1 2 3 4 # Turns P ow er L os s (W ) Pcu Pcore Ptotal
specifications. To determine the minimum magnetic core window area required to accommodate inductor windings without causing excessive heating, window area, Aw, is predicted as:
rms w u
NI
A
K J
where RMS current per phase, Irms, in a multiphase
buck converter is given as:
2 2 L dc rms12
I
I
I
n
Δ
⎛
⎞
⎜
⎟
⎝
⎠
A minimum core area, Ac, is required to limit core
losses caused by varying magnetic flux density, ΔB.
For multiphase interleaved buck circuits, Ac is
calculated from .
Area Product, Ap may therefore be written as:
i n r m s p s w u
( 1 - )
D D V I
A
f B K J
Δ
Clearly, Ap decreases with increasing switching
frequency. However, this assumes that the core be operated under the same flux density level. Assuming that the same ferrite material is used, core loss density increases with switching frequency according to , and therefore ΔB needs to be reduced in order to maintain core loss levels. This in turn causes an increase in Ap. Higher
frequency grade of ferrites have a lower operating flux level and therefore an increase in frequency do not necessarily result in a decrease in area product. A discussion on magnetic materials can be found in [19]. Increasing switching frequency, fsw, also
reduces the inductance required to provide the same current ripple and hence a larger gap may be required. This increases the AC winding losses due to larger fringing fields experienced by the windings.
If operating at higher switching frequencies careful consideration on core and winding materials is required. To overcome some issues with commercial available planar cores and materials, a previous publication by the author provided an alternative solution to the design of planar inductors [20], [21].
Summary
A detailed discussion on some issues that is found in current and future VRM designs that impact the optimisation of their inductors is discussed. An
inductor design procedure is presented that takes into account these issues. The general acceptance of increasing switching frequency in order to reduce the size of magnetic components is examined. An explanation into why that in some designs, an increase in switching frequency does not result in a reduction in magnetic size is provided. Excelsys incorporates all of this design knowledge in our designs, which can be found on our website at www.excelsys.com .
References
[1] Haruo Nakazawa, et al. “Micro DC DC Converter that Integrates Planar on Power IC”, IEEE Transactions on Magnetics, Vol. 36, NO. 5, pp. 3518-3520, September 2000 [2] Satish Prabhakaran, et al. “Measured Electrical Performance of V Groove Inductors for Microprocessor Power Delivery”,
IEEE Transactions on Magnetics, Vol. 39, NO. 5, pp. 3190-3192, September 2003
[3] Seán Cian Ó. Mathúna, et al. “Magnetics on Silicon: An Enabling Technology for Power Supply on Chip”, IEEE Transactions on Power Electronics, Vol. 20, NO. 3, pp. 585-592, May 2005
[4] S. Prabhakaran, et al. “Microfabricated Coupled Inductors for DC-DC Converters for Microprocessor Power Delivery,” Proceedings of the 35th Power Electronics Specialists Conference, PESC 04, June 2004, pp.4467–4471
[5] Mark A Swihart “Designing with Planar Ferrite Cores”, Magnetics Bulletin no. FC-S8, 1999
[6] “Design of Planar Power Transformers”, Ferroxcube Application Note
[7] M.Albach, et al.“Calculating Core Loss in Transformers for Arbitrary Magnetizing Currents a Comparison of Different Approaches” Proceedings of the 27th IEEE Power Electronics Specialists Conference, PESC 96, June 1996, Vol. 2, pp. 1462-1468
[8] J. Reinert, et al. “Calculation of Losses in Ferro- and Ferromagnetic Materials on the Modified Steinmetz Equation”
IEEE Transactions on Industry Applications, Vol.27, Issue 4, pp. 1055-1061, August 2001
[9] W. A. Roshen, “A Practical, Accurate and Very General Core Loss Model for Non-Sinusoidal Waveforms”, IEEE TransactionsonPower Electronics, Vol. 22, Issue 1, pp. 30-40, January 2007
[10] Jieli Li, et al. “Improved Calculation of Core Loss with Non-Sinusoidal Waveforms”, Proceedings of the Industry Applications Conference 2001, IAS 01, Vol. 4, Oct 2001, pp. 2202-2210
[11] Kapil Venkatachalam, et al. “Accurate Prediction of Ferrite Core Loss with Non-Sinusoidal Waveforms using only Steinmetz parameters”, Proceedings of the 8TH IEEE Workshop on Computers in Power Electronics, Compel 02, June 2002, pp. 36-41
[12] S.A Mulder, “On the Design of Low Profile High Frequency Transformers”, Proceedings of the Power Conversion Conference, June 1990, pp. 162-180
[13] IPC-2221 Standard
[14] “Transformer and Inductor Design Handbook”, By Colonel William T. McLyman, William T. McLyman Edition: 2, Published by CRC Press, 2004
ISBN 0824752922, 9780824752921
[15] R. Prieto, et al. “Study of Non-Axisymmetric Magnetic Components by means of 2D FEA Solvers” Proceedings of the 36th IEEE Power Electronics Specialists Conference, PESC 05, June 2005, pp. 1074-1079
[16] W.G Hurley, et al. “Optimizing the AC Resistance of Multilayer Transformer Windings with Arbitrary Current Waveforms”, IEEE Transactions on Power Electronics, Vol. 15, Issue 2, pp. 369- 376, March 2000
[17] S. Kelly, et al. “Core Materials for High Frequency VRM Inductors”, Proceedings of the 38th IEEE Power Electronics Specialists Conference, PESC 07, June 2007, pp. 1767-1772 [18] M. Duffy, et al. “High Current Inductor Design for MHz Switching”, Proceedings of the 39th IEEE Power Electronics Specialists Conference, PESC 08, June 2008, pp. 2672-2677 [19] S. Kelly, et al. "Core Materials for High Frequency VRM Inductors", 38th IEEE Power Electronics Specialists Conference, PESC’07, Orlando, Florida, USA, 1767–1772, June 2007
[20] C. Collins, M. Duffy, "Distributed (Parallel) Inductor Design for VRM Applications", IEEE Transactions on Magnetics, Vol. 41, NO. 10, Proceedings of Intermag 2005, April 2005, Nagoya, Japan, pp. 4000-4002, October 2005 [21] C. Collins, M. Duffy, "Limits and Opportunities for Distributed Inductors in High Current, High Frequency Applications", IEEE Transactions on Power Electronics, Vol. 25, NO. 11, pp. 2719 - 2721 November 2010
Excelsys Technologies Ltd. is a modern world-class power supplies design company providing quality products to OEM equipment manufacturers around the world. This is achieved by combining the latest technology, management methods and total customer service philosophy with a 20 year tradition of reliable and innovative switch mode power supply design, manufacture and sales. If there are any further points you wish to discuss from this paper please contact
[email protected]. Further information on our