HP Data Analyzer
User and Installation Guide
Part number: 586770-002 First edition: 07/2009
2 Legal notices
Hewlett-Packard makes no warranty of any kind with regard to this manual, including, but not limited to, the implied warranties of merchantability and fitness for a particular purpose. Hewlett-Packard shall not be held liable for errors contained herein or direct, indirect, special, incidental or consequential damages in connection with the furnishing, performance, or use of this material.
Warranty: A copy of the specific warranty terms applicable to your Hewlett-Packard product can be obtained from your local Sales and Service Office.
Restricted Rights Legend: All rights are reserved. No part of this document may be copied, reproduced, or translated to another language without the prior written consent of Hewlett-Packard Company. The information contained in this material is subject to change without notice.
Use, duplication or disclosure by the U.S. Government is subject to restrictions as set forth in subparagraph (c) (1) (ii) of the Rights in Technical Data and Computer Software clause at DFARS 252.227-7013 for DOD agencies, and subparagraphs (c) (1) and (c) (2) of the Commercial Computer Software Restricted Rights clause at FAR 52.227-19 for other agencies.
HEWLETT-PACKARD COMPANY United States of America
Copyright Notices: ©Copyright 1983-2007 Hewlett-Packard Company, all rights reserved.
Reproduction, adaptation, or translation of this material without prior written permission is prohibited, except as allowed under the copyright laws.
Part number: 586770-002 First edition: 07/2009 Printing History
The printing date and part number of the manual indicate the edition of the manual. The printing date will change when a new edition is printed. Minor changes may be made at reprint without changing the printing date. The part number of the manual will change when extensive changes are made.
Manual updates may be issued between editions to correct errors or document product changes. To ensure that you receive the updated or new editions, you should subscribe to the appropriate product support service. See your HP sales representative for details.
Contents
Preface
Before You Begin ... 5
Who Should Read This Guide ... 5
Goals of Documentation ... 5
Organization ... 5
1
Data Analyzer: Overview
1-1 What is Data Analyzer? ... 61-2 Why Data Analyzer? ... 6
1-3 Features & Benefits... 7
2
Installing Data Analyzer
2-1 Contents of Installation Exe... 82-2 Prerequisites... 9
2-3 Installing Data Analyzer on Windows... 10
2-3-1 Overview... 10
2-3-2 Getting Started ... 10
2-3-3 Installing Data Analyzer Database ... 11
2-3-4 Installing Data Analyzer Web Server ... 17
2-4 Upgrading Data Analyzer to Version 2.0... 21
3
Getting Started with Data Analyzer
3-1 Accessing Data Analyzer Web Server ... 233-2 Admin Privileges... 25
3-2-1 Adding a New User ... 26
3-2-2 Modifying a User ... 27
3-2-3 Deleting a User... 28
3-3 Configuring Data Sources ... 29
3-3-1 Configure a New Data Source... 29
3-3-2 Modify a Data Source ... 30
3-3-3 Delete a Data Source... 32
3-4 Error Log... 33
4
Data Analyzer Interface
4-1 Overview... 344-2 Dashboards Browser ... 35
4-3 Available Data Sources Browser ... 36
4-4 Data Source Explorer ... 37
4-5 Dashboards ... 38
5
Working with Dashboards
5-1 Create a New Dashboard... 395-2 Adding Panels to a Dashboard... 41
5-3 Adding Data to Panels... 44
5-4 View and Edit Data Source Options of an Entity... 47
5-5 Viewing a Dashboard ... 49
5-6 Cloning a Panel... 50
5-7 Deleting a Panel ... 51
5-8 Cloning a Dashboard... 52
5-9 Deleting a Dashboard ... 53
5-10 Dashboards Drill-Down Feature... 54
5-11 Dashboard Panel Icons ... 55
5-12 User Profile Options ... 56
4
7
Uninstalling HP NonStop Data Analyzer
7-1 Uninstalling Data Analyzer Web Server... 58 7-2 Uninstalling Data Analyzer Database ... 60
Appendix A
Web Configuration Parameters... 61
Appendix B
Data Analyzer Integration with any Data Source... 62 Integrating Data Analyzer with Transaction Analyzer Data Source ... 62
Appendix C
Integrating Data Analyzer with PM Data Source ... 66
Document Feedback Form
Preface 5
Preface
Data Analyzer (DA) helps drive performance success by representing your business using striking and meaningful visuals in consolidated business-oriented views.
This manual explains how to install and configure Data Analyzer, and manage the product after installation.
Before You Begin
As the Data Analyzer administrator, you should be familiar with the ATM/POS environment, HP NonStop Servers, network protocols, Microsoft SQL Server, Microsoft IIS, client/server architecture and basic Microsoft Windows navigation.
Who Should Read This Guide
The target audiences for the Guide are the people working in the systems operation/support groups, responsible for installing/using Data Analyzer for viewing and managing the ATM/POS environment along with monitoring the performance of NonStop data using Performance Monitor.
Goals of Documentation
After reading the Data Analyzer User and Installation Guide, you should know the following information.
• System requirements for installing Data Analyzer
• Installing Data Analyzer
• Using Data Analyzer
• Uninstalling Data Analyzer
• Starting and Troubleshooting Data Analyzer components
Organization
The guide is organized as follows:
Sr. No Chapter Name Description
Chapter 1. Data Analyzer: Overview This chapter lists the main features of Data Analyzer and points out the advantages this software offers.
Chapter 2. Installing Data Analyzer This section covers the procedure to install Data Analyzer on the Microsoft Windows environment.
Chapter 3. Getting Started with Data Analyzer This section provides steps on how to start working with Data Analyzer.
Chapter 4. Data Analyzer Interface This chapter provides information on the Data Analyzer interface.
Chapter 5. Working with Dashboards This chapter details the working of the Data Analyzer Dashboards.
Chapter 6. Data Source Actions This chapter provides information on the actions that can be performed on a Data Source.
Chapter 7. Uninstalling Data Analyzer This section covers the procedure to uninstall Data Analyzer. Appendix A. Web Configuration Parameters Provides a list of Web Configuration parameters for Data
Analyzer. Document
Feedback Form
Document Feedback Form Provides a documentation feedback form for the users.
Data Analyzer: Overview 6
1 Data Analyzer: Overview
This chapter lists the main features of Data Analyzer (DA) and highlights the advantages this software offers.
1-1 What is Data Analyzer?
Data Analyzer is a best-of-breed web-based visualization tool providing graphical presentation of information. It allows you to easily combine a multitude of data elements from various sources to create a unified view of your processing environment that is like no other. The goal is to provide the viewer with a qualitative understanding of the information content.
Figure 1-1 Data Analyzer
1-2 Why Data Analyzer?
To remain competitive, you must do more than just monitor business activities and objects. How often are you left wondering: “Is my business performing to plan?” Are you spending most of your time searching through different reports and spreadsheets to piece answers together?
Seeing and interacting with data are the two factors essential for understanding the answers hidden in them. Data Analyzer provides you the insight you need to monitor and understand any impact that a problem or outage can have on your business. The interactive visual models, dashboards and graphs can transform information that is relevant to your business needs and what makes the most sense to you.
Here are a few points which make Data Analyzer best in the league.
Effective: The tool has been designed for ease of interpretation and data analysis.
Accurate: Provides precise evaluation.
Efficient: High data-ink ratio and minimum chart-junk. The data-ink ratio is the proportion of pixels that's used to present actual data, without redundancy, compared to the total amount of pixels used in the entire display.Data Analyzer: Overview 7
1-3 Features & Benefits
Unified Views
Data Analyzer allows you to easily combine a multitude of data elements from various sources to create a unified view of your processing environment that is like no other.
Driving Performance Success
Data Analyzer helps drive performance success by representing your business using striking and meaningful visuals in consolidated business-oriented views.
Taking Control
It is not uncommon for corporate departments to run thousands of reports that are of no use to decision makers. There is a huge gap between reporting programs and expensive, high-end analytical products which require statistics and/or programming expertise. Data Analyzer does not follow the usual prototype of just displaying information. The Data Analyzer graphs and dashboards are not only interactive, they help you understand the past; see the impact of previous decisions, and forecast the future. This comprehensive Business knowledge allows you to respond quickly and effectively and take competitive business decisions.
Connectivity to Major Data Sources
The Data Analyzer provides wrappers for most of the major databases. Just drag and drop your data and start generating meaningful reports on your system. Simply select your data source, choose the elements and timeframes you wish to view, and select the visual representation (Chart, Grid, Graph, etc.) and your power-user dashlets are displayed. Thus, Business Managers and Analysts can now easily load data, do analysis, and share results within minutes.
Business Intelligence Made Easy
Data Analyzer also frees Managers and IT Workers from the hassles of a traditional Business Intelligence platform. There is no need to purchase an expensive platform. And if you have already invested, Data Analyzer will enhance your existing business intelligence investment at a fraction of the cost.
Intuitive Interface
Interpreting Data Analyzer displays & graphics is easy for users, and provides greater depth of information than traditional charts and graphs. You don’t have to view voluminous reports to find problems –
exceptions are automatically highlighted. The professional-grade images and graphics can be used in print or slide presentations.
Dynamic Data & Drill-Down
Web-based Data Analyzer Dashboards are update automatically with no need to resynchronize or repopulate. Charts and tables support drilldown to detailed data or other dashboard presentations. More…
• Improve Corporate Branding
• Root-Cause Analysis
• Refine Business Model using Business Intelligence
• Data Visualization and Data Management
• Analyze Business Performance with Consolidated Snapshots
• Explorative Data Mining
• Real-Time Integration
• Predictive Analysis
• Visual and Interactive Data Exploration
Data Analyzer: Overv
Installing Data Analyzer 8
2 Installing Data Analyzer
This section covers the procedure to install Data Analyzer on the Microsoft Windows platform.
2-1 Contents of Installation Exe
Data Analyzer Database
The DA_DatabaseInstallation.exe contains components necessary to install Data Analyzer Database on a Windows workstation. The self-extracting exe file includes the following:
DA Database For collecting data related to dashboards, panel configurations, and database connection strings. It installs DVDB database/tables and also creates new out of the dashboard/panels for selected data source.
Data Analyzer User and Installation
Guide Contains detailed installation and usage information for Data Analyzer.
Data Analyzer Web Server
The DA_WebServerInstallation.exe contains components necessary to install Data Analyzer Web Server on a Windows workstation. This self-extracting exe file includes the following files:
Web Resources (Scripts, images, style
sheets and web pages) For monitoring and generating reports through web-browser. Data Analyzer User and Installation
Guide
Installing Data Analyzer 9
2-2 Prerequisites
Before installing Data Analyzer, ensure that the following tasks have been accomplished:
1. The user installing Data Analyzer must have Administrator rights/privileges on the system.
2. Before starting the installation, it is recommended that you exit from any other Windows programs that are running.
3. On Windows 2000 or 2003 Server installation in application mode where terminal services are enabled, you need to create a folder named "Fonts" under "%System Root%\Documents and
Settings\%User%\WINDOWS\" before running the setup. The user might face problems if the "Fonts" folder is not in the specified path.
4. Microsoft SQL Server 2000 or 2005 Environment is a must to install the Data Analyzer Database.
5. Microsoft Internet Information Server (IIS) 5.0 or above is a must to install Data Analyzer Web Server.
6. Microsoft .NET framework 2.0 is a must for Data Analyzer Web Server.
7. Before installing Data Analyzer you should have the following information:
a. SQL Server Name and Authentication Type
b. For SQL Server Mixed mode authentication type, you need the SQL Server Login ID and password. This login ID must have Database Creator role, Database owner and Public Access rights for the SQL Server Data Analyzer database.
c. For Window authentication type, create an SQL Login ID which is same as the Windows Login ID. The login ID must have Database Creator role, Database owner and Public Access rights for the SQL Server Data Analyzer Database.
d. SQL Server TCP/IP port where Microsoft SQL Server is listening. The default port is 1433. The same port should be used for Data Analyzer Database and Web Server installation. If the SQL Server is listening on a port other than the default port, enter the SQL Server name in the
<SQLServer_Name>,<Port_Number> format while installing Data Analyzer Database.
NOTE: In case of Windows Authentication Mode, same Windows user account should be created on systems where Microsoft SQL Server, Data Analyzer Database, and Web Server are installed. This Windows user account must exist in the Microsoft SQL Server and have Database Creator role or database owner and public access rights on the Data Analyzer Database.
8. In case you do not have System Administrative rights on the SQL Server, the login ID used to create the database must have Database Creator role allocated before installing Data Analyzer Database. If you have already created the Data Analyzer Database and you do not want to give Database Creator rights to appropriate SQL user, the SQL Login ID must have database owner and Public Access rights on the Data Analyzer Database before installing the Database.
9. If your IIS default web port is different than 80 then your web access format should be http://<webservername>:<portno>/dv instead of http://<webservername>/dv.
10. You should turn off Internet Explorer popup blocker feature.
11. If you are using Microsoft .NET framework 2.0 for Data Analyzer Web Server, you should remove the comment <!--pages enableEventValidation="false"--> in the web.config file. (<web-root>\dv).
12. Ensure that the Performance Monitor Database (included with HP OVNPM) or the Transaction Analyzer Database (included with HP POSTA or HP ATM TA) is installed before installing Data Analyzer. Please refer to the Performance Monitor User and Installation Guide for more details.
Installing Data Analyzer 10
2-3 Installing Data Analyzer on Windows
2-3-1 Overview
Installing Data Analyzer involves installing the following components in the same sequence.
• Data Analyzer Database: This involves installing the Data Analyzer database, remotely or locally.
• Data Analyzer Web Server: This involves installing Data Analyzer Web components: ASPX and HTML files.
NOTE: The various Data Analyzer components can be installed on the same machine or on different machines.
2-3-2 Getting Started
1. Install the SQL Server on a Windows machine.
2. Decide on the kind of Authentication mode to be used in your Data Analyzer Environment.
NOTE: If you change your SQL Server login ID and password (in case of SQL Server Mixed Mode
authentication) or Windows login ID and password (in case of Windows authentication mode) after installing Data Analyzer components, use the Modify or Repair option for Data Analyzer Database and Web Server to update the login information. The sequence for maintenance should be Database -> Web Server.
Windows Authentication Mode
For Windows Authentication mode, create users according to the following scenarios:
• Work Group: Create User(s) for the Database with the user name and password. Ensure that the user(s) have Administrator Privileges and the password is not blank.
• Domain: Create a user on Domain Server having “Log on as a service" right. Make sure that the password is not blank.
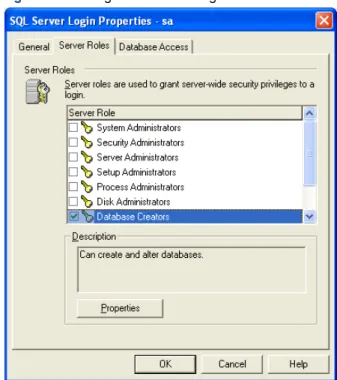
SQL Server Authentication Mode
Create a user with Database Creator rights on the SQL Server.
Figure 2-1 Adding Administrator Rights to the SQL User
Installing Data Analyzer 11
2-3-3 Installing Data Analyzer Database
Step A: Starting Up
Double-click on the DA_DatabaseInstallation.exe to start the installation process.
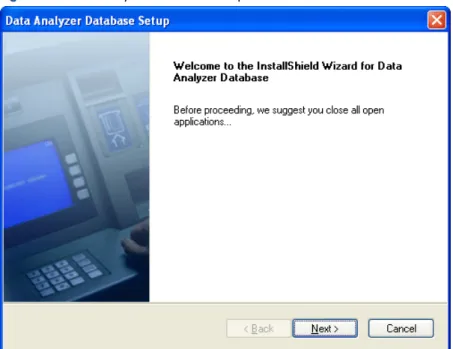
Install Shield prepares the Setup program for use and the Data Analyzer Database Setup Welcome screen is displayed.
Figure 2-2 Data Analyzer Database Setup Welcome Screen
Click on the Next button to continue with Data Analyzer Database Setup. Step B: License Agreement
The License Agreement screen is displayed.
Figure 2-3 Data Analyzer Database Setup License Agreement Screen
Review the software license agreement and click on the Yes button to continue with the installation.
Installing Data Analyzer 12 Step C: Destination Location
Figure 2-4 Data Analyzer Database Setup Choose Destination Location Screen
The Choose Destination Location screen shows the path of the folder where Data Analyzer Database files will be installed by default. Use the Browse button to specify a directory other than the default. To move on with the installation process, click on the Next button.
NOTE: While installing DA with Performance Monitor, the default directory location will be C:\Program Files\OVNPM.
Step D: Database Server
Figure 2-5 Data Analyzer Database Setup Database Server Screen
The Database Server screen is displayed. Select the Database Server where the Data Analyzer Database (DVDB) is to be created/exists using the Database Server field. You can also browse for the Database Server using the Browse button. The default port used by the SQL Server is 1433. In case the SQL Server is listening on a port other than the default port, specify the information in the <SQL Server>,<Port Number> format.
After selecting the Database Server, select the authentication type: Windows authentication or SQL Server authentication, using the corresponding radio buttons. Specify the Login ID and the Password if you select the SQL Server authentication method.
Installing Data Analyzer 13 Step E: Option Type
Figure 2-6 Data Analyzer Database Select Option Type Screen
The Select Option Type screen is displayed. Select the database option that best suits your needs.
Choosing the Create DVDB Database and Tables option will create DVDB database and tables. You need to have the Database Creator rights for creating the database and tables.
Choosing the Create only DVDB Tables option will create only the Data Analyzer tables. It is assumed that the DVDB database has been created manually. You need to have the DVDB database db_owner and public rights. Click on the Next button to continue.
Steps to Manually Create DVDB Database
1. Go to SQL Server Management Studio and connect to the database engine.
2. Right click on Databases folder available in the Object Explorer panel of the SQL Server Management Studio
3. Select New Database option from the right click menu and specify the database name as DVDB. Change mdf and ldf files location if needed.
IMPORTANT: You must have DBCreator roles to create a new database.
Installing Data Analyzer 14 Step F: Select Database Option Type
Figure 2-7 Data Analyzer Database Select Option Type Screen
The Select Option screen is displayed again. Use this screen to integrate Data Analyzer with ATM/TA, POS/TA or OVNPM - PM database. To integrate Data Analyzer with any of the database, select the corresponding check box. Click on the Next button to continue.
Step G: Database Server – Database Integration
Figure 2-8 Data Analyzer Database Server Screen
The Database Server screen is displayed for integration with the selected (ATM/TA or POS/TA) database. Select the Database Server where the database is to be created or exists using the DatabaseServer field. You can also browse for the Database Server using the Browse button. The default port used by the SQL Server is 1433. In case the SQL Server is listening on a port other than the default port, specify the information in the <SQL Server>,<Port Number> format.
After selecting the Database Server, select the authentication type: Windows authentication or SQLServer authentication, using the corresponding radio buttons. Specify the LoginID and the Password if you select the SQL Server authentication method. Click on the Next button to continue.
Installing Data Analyzer 15 Step H: Confirm Entries and Copy Files
Figure 2-9 Data Analyzer Database Check Setup Information Screen
The Check Setup Information screen displays the current settings, which have been selected so far. In case you want to change any of the settings, you can do so by going back to the particular screen before you start copying the program files.
NOTE: You should check the location of the directory where Data Analyzer Database is to be installed. In case the location has to be changed after installation, you will have to reinstall the software.
Click on the Next button to continue with the Setup process. The program begins copying files to the directory specified.
Step I: Rebooting the System
It is recommended to reboot the system to complete the installation. The Data Analyzer Database Installation message box is displayed.
Figure 2-10 Data Analyzer Database Message Box
Click on the OK button to continue.
NOTE: Clicking on the OK button does NOT reboot the system. It is recommended to reboot the system after installing DA Database.
Installing Data Analyzer 16 Step J: Setup Complete
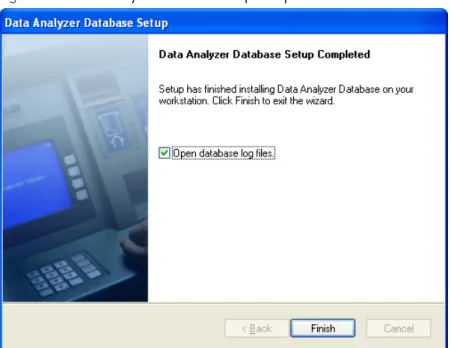
Figure 2-11 Data Analyzer Database Setup Completed Screen
The Data Analyzer Database Setup Completed screen denotes the completion of the Setup process.
The Open database log files check box is selected by default. If you do not wish to open the database log files, deselect the check box.
Click on the Finish button to complete the Setup process. This completes the Data Analyzer Database Setup process.
Installing Data Analyzer 17
2-3-4 Installing Data Analyzer Web Server
Step A: Starting Up
Double-click on the DA_WebServerInstallation.exe to start the installation process.
Install Shield prepares the Setup program for use and the Data Analyzer Web Server message box is displayed.
Figure 2-12 Data Analyzer Web Server Message Box
Before installing Data Analyzer Web Server make sure that the Data Analyzer Database is installed on the network. If you already have Data Analyzer Database installed on the network, click on the OK button to continue with the installation.
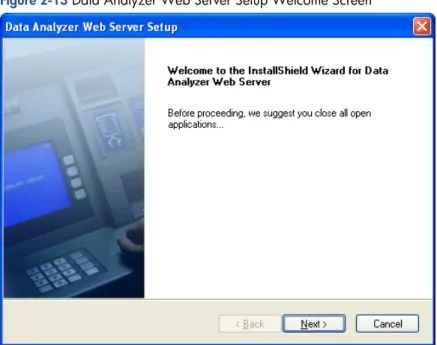
Step B: Welcome Screen
The Data AnalyzerWeb Server Setup Welcome screen is displayed.
Figure 2-13 Data Analyzer Web Server Setup Welcome Screen
Click on the Next button to continue with the Setup.
Installing Data Analyzer 18 Step C: License Agreement
The License Agreement screen is displayed.
Figure 2-14 Data Analyzer Web Server Setup License Agreement Screen
Review the software license agreement and click on the Yes button to continue with the installation. Step D: Destination Location
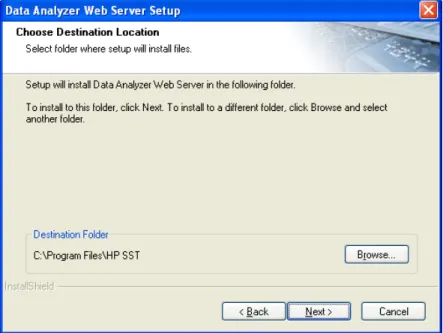
Figure 2-15 Data Analyzer Web Server Setup Choose Destination Location Screen
The Choose Destination Location screen shows the path of the folder where Data Analyzer Web Server files will be installed by default. Use the Browse button to specify a directory other than the default.
To move on with the installation process, click on the Next button.
NOTE: The default directory location will change while installing DA with Performance Monitor data source for OVNPM.
Installing Data Analyzer 19 Step E: Database Server
Figure 2-16 Data Analyzer Web Server Setup Database Server Screen
The Database Server screen is displayed. Select the Database Server where the Data Analyzer Database DVDB exists using the Database Server field. You can also browse for the Database Server using the Browse button. The default port used by the SQL Server is 1433. In case the SQL Server is listening on a port other than the default port, specify the information in the <SQL Server>,<Port Number> format.
After selecting the Database Server, select the authentication type: Windows authentication or SQL Server authentication, using the corresponding radio buttons. Specify the Login ID and the Password if you select the SQL Server authentication method.
Click on the Next button to continue. Step F: Confirm Entries and Copy Files
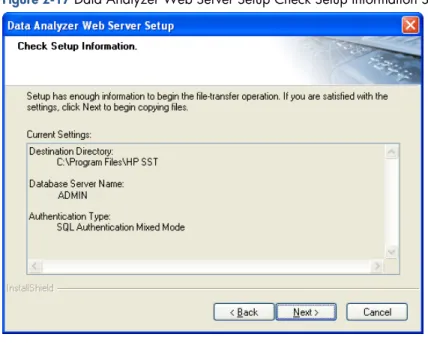
Figure 2-17 Data Analyzer Web Server Setup Check Setup Information Screen
The next screen, Check Setup Information, displays the current settings, which have been selected so far. This will depend on the Database Connection and the SQL Authentication Type. In case you want to change any of the settings, you can do so by going back to the particular screen before you start copying the program files.
NOTE: You should check the location of the directory where Data Analyzer Web Server is to be installed. In case the location has to be changed after installation, you will have to reinstall the software.
Click on the Next button to continue. The program begins copying files to the directory specified.
Installing Data Analyzer 20 Step G Data Analyzer Web Server – Installation Complete
Figure 2-18 Data Analyzer Web Server Message Box
The next screen gives information that the Data Analyzer Web Server has been successfully installed on the system. Click on the OK button to complete the Setup.
Step H: Setup Completed
Figure 2-19 Data Analyzer Web Server Setup Completed Screen
The Data Analyzer Web Server Setup Completed screen denotes the completion of the Setup process. Click on the Finish button to complete the Setup process.
Step I: Rebooting the System
It is recommended to reboot the system for proper functioning. The Data Analyzer Web Server message box is displayed.
Figure 2-20 Data Analyzer Web Server Message Box
To configure Data Analyzer Web page, use the following web link format http://<ServerName>:<PorNo>/DV
Where,
<ServerName> is the system where Web server is installed.
<PortNo> is the Port of the system where Data Analyzer Web Server is installed. Click on the OK button to continue.
NOTE: Clicking on the OK button does NOT reboot the system. It is recommended to reboot the system after installing the Web Server.
Installing Data Analyzer 21
2-4 Upgrading Data Analyzer to Version 2.0
This section explains the procedure to upgrade from a previous version of Data Analyzer to version 2.0.
1. Take a backup of the DVDB database on the SQL Server.
2. To upgrade the DVDB Database, run the DAUPGRADE.sql on DVDB database using the SQL Analyzer.
3. The next step is to upgrade the Data Analyzer Web Server
a. Run the Data Analyzer Web Server installation exe. The Data Analyzer Web Server message box is displayed with the information that before continuing with the upgrade, it is recommended to take a backup of the web.config file and close all Data Analyzer Web Server components running on the system.
Figure 2-21 Data Analyzer Web Server Message Box
Click on the OK button to continue.
b. The Data Analyzer Web Server Setup Welcome screen is displayed with the information that the wizard will update the installed Data Analyzer Web Server version 1.0 to version 2.0. Click on the Next button to continue.
Figure 2-22 Data Analyzer Web Server Setup Welcome Screen
Installing Data Analyzer 22
c. The Database Server screen is displayed. Select the Database Server where the Data Analyzer Database DVDB exists using the Database Server field. You can also browse for the Database Server using the Browse button. The default port used by the SQL Server is 1433. In case the SQL Server is listening on a port other than the default port, specify the information in the <SQL Server>,<Port Number> format.
Figure 2-23 Data Analyzer Web Server Setup Database Server Screen
After selecting the Database Server, select the authentication type: Windows authentication or SQL Server authentication, using the corresponding radio buttons. Specify the Login ID and the Password if you select the SQL Server authentication method. Click on the Next button to continue.
d. It is recommended to reboot the system for proper functioning. The Data Analyzer Web Server Installation message box is displayed.
Figure 2-24 Data Analyzer Web Server Installation Message Box
Click on the OK button to continue.
NOTE: Clicking on the OK button does NOT reboot the system. It is recommended to reboot the system after upgrading the Data Analyzer Web Server.
Getting Started with Data Analyzer 23
3 Getting Started with Data Analyzer
This chapter details the steps for starting and checking status of various Data Analyzer components.
3-1 Accessing Data Analyzer Web Server
Data Analyzer provides a platform and location independence by giving the ability to monitor data through a web browser like Microsoft Internet Explorer.
NOTE: In case if you are accessing Data Analyzer web page using Microsoft Internet Explorer, you should turn off the popup blocker feature to allow the application to function properly.
To access the Data Analyzer web page click on Start->Programs->HP SST ->Data Analyzer->Web Server-> Data Analyzer WebPage option.
To access the Data Analyzer web page open a web browser and enter the Data Analyzer home page address in the following formats.
• IIS default web port is 80
http://<IP Address>/DV
• IIS default web port is not 80
http://<IP Address>:< TCP/IP Port >/DV
Where,
<IP Address> is the IP address of the system where Data Analyzer Web Server is installed. <TCP/IP Port> is the TCP/IP Port of the system where Data Analyzer Web Server is installed.
Example:
http://111.111.111.111:80/DV/
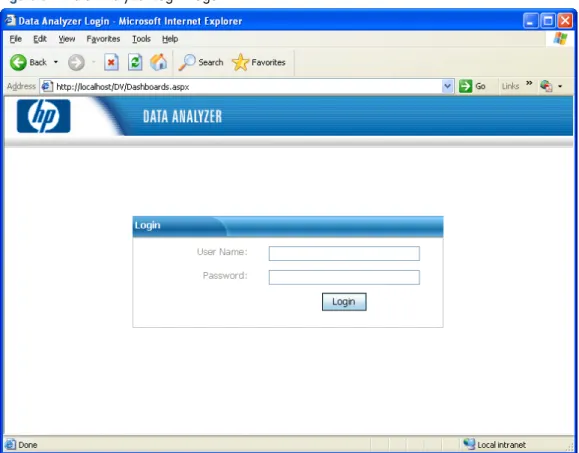
On connecting to the Data Analyzer application the Login page is displayed.
Figure 3-1 Data Analyzer Login Page
Getting Start
ed with Data
Getting Started with Data Analyzer 24
Associated with each logon is a profile, which determines the information a user can view. The admin logon has special privileges, and can edit the profiles and passwords of other users. You need to enter the user name and the password in the User Name and Password fields respectively, to access the Data Analyzer web page.
NOTE: The default administrator User Name is admin and Password is dvdefault. You can change the password by editing the Admin profile.
The authenticity of the information specified is checked. In case the information is not correct, a message “Could not authenticate with the given credentials” is displayed.
NOTE: When you login to the Data Analyzer web page for the first time as admin, you will need to create new user profiles and set privileges.
Getting Started with Data Analyzer 25
3-2 Admin Privileges
NOTE: This function can only be accessed by the Data Analyzer Administrator or a user with Admin privileges. You can use the Administrator page to modify/access the Admin privileges. Click on the Admin option in the Data Analyzer web page Dashboards menu.
Figure 3-2 Data Analyzer Dashboards Menu Admin Option
Clicking on the Admin option displays the Administration page.
Figure 3-3 Administration Page
You can use this page to configure the following options:
• Users • Data Sources • Error Log
Getting Start
ed with Data
Analyzer
Getting Started with Data Analyzer 26
3-2-1 Adding a New User
1. Click on the Admin option in the Data Analyzer web page Dashboards menu.
2. In the displayed Administration page, click on the New User button. This displays the New User dialog box.
Figure 3-4 New User Dialog Box
3. Enter the User Name and Password in the corresponding fields.
4. Select the privilege category using the Privileges drop-down box. The options available are:
• Power User
• Admin
• Restricted User
• Restricted (allow changes)
5. Click on the OK button to add the user.
Getting Started with Data Analyzer 27
3-2-2 Modifying a User
Follow the steps listed below to modify the user settings.
1. Click on the Admin option in the Data Analyzer page Dashboards menu. This displays the Administration page. The Users tab page is displayed by default.
Figure 3-5 Administration Page
2. Select the user whose password/privileges are to be modified.
3. To modify the password, click on the Set Password button. This displays the SetPassword dialog box.
Figure 3-6 Set Password Dialog Box
4. Enter the new password in the Password field.
5. Click on the OK button.
6. To modify the privileges for an existing user, select the user from Users tab page and click on the Set Privileges button. The Set Privileges dialog box is displayed.
Figure 3-7 Set Privileges Dialog Box
7. Select the privilege (Power User, Admin, Restricted User or Restricted User (allow changes)) to be assigned for the selected user using the Privilege drop-down box.
8. Click on the OK button to save the changes or click on the Cancel button in case you do not wish to save the modifications made.
Getting Start
ed with Data
Getting Started with Data Analyzer 28
3-2-3 Deleting a User
Follow the steps given below to delete a user:
1. Click on the Admin option in the Data Analyzer web page Dashboards menu. This displays the Administration page Users tab page.
2. Select the user to be deleted from the User Name list.
3. Click on the DeleteUser button. A confirmation box is displayed. Click on the OK button to delete the selected user.
Getting Started with Data Analyzer 29
3-3 Configuring Data Sources
You can also configure the data sources according to your business requirements.
3-3-1 Configure a New Data Source
Follow the steps given below to configure a new Data Source.
1. Click on the Admin option in Data Analyzer Dashboards menu. This displays the Administration page.
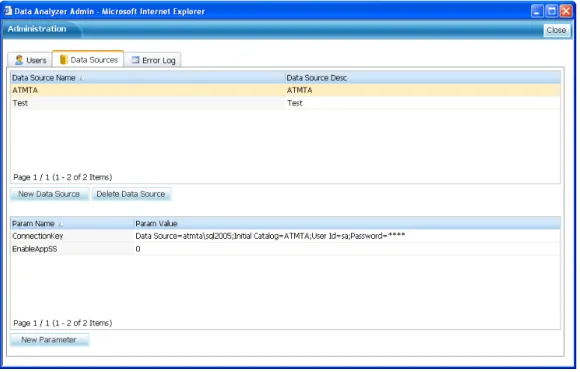
2. Click on the DataSources tab to open the corresponding tab page. The Data Sources tab page displays a list of all the data sources configured along with the corresponding descriptions.
Figure 3-9 Administration Page - Data Sources Tab Page
3. Click on the New Data Source button to add a new Data Source. This displays a NewDataSource dialog box.
Figure 3-10 New Data Source Dialog Box
Getting Start
ed with Data
Getting Started with Data Analyzer 30
4. Enter the following information in the New Data Source dialog box.
• Data Source Name: Name of the Data Source.
• Data Source Type: Type of the Data Source to be created. The options available are PM, TA, Table and TELCO
• DB Server: Name of the Database Server.
• DB Name: Name of the Database.
• DB Authentication: Select the type of Database authentication using the DB Authentication drop-down list. The options available are SQL and Windows.
• DB User Name: Name of the DB User
• DB Password: Password of DB User.
5. Click on the OK button to save the changes.
3-3-2 Modify a Data Source
Follow the steps given below to modify a data source:
1. Click on the Admin option in Data Analyzer page Dashboards menu. This displays the Administration page.
2. Click on the DataSources tab to open the corresponding tab page.
3. Select the Data Source you need to modify from DataSourceName field. This displays the corresponding values available in the ParamName and ParamValue columns.
Getting Started with Data Analyzer 31
4. Click on the New Parameter button to add a new parameter for the selected data source. This displays the New Parameter dialog box.
Figure 3-12 New Parameter Dialog Box
5. Enter the new ParameterName and ParameterValue in the respective fields and click on the OK button to add the new parameter.
6. This will add the new parameter to the existing list.
3-3-2-1 Modify a Parameter
Perform the following steps to modify a Data Source parameter:
1. Click on the Admin option in Data Analyzer Dashboards menu. This displays the Administration page. Click on the Data Sources tab to open the corresponding tab page.
2. Select the data source to be modified.
3. Select the Parameter from the existing ParamName list and click on the ModifyParameter button.
4. This displays the ModifyParameter dialog box. Edit the value in ParameterValue box.
Figure 3-13 Modify Parameter Dialog Box
5. Click on the OK button to save the changes.
3-3-2-2 Delete a Parameter
1. Click on the Admin option in Data Analyzer Dashboards menu. This displays the Administration page. Click on the DataSources tab to open the corresponding tab page.
2. Select the data source to be modified.
3. Select the parameter from the existing parameter list and click on the DeleteParameter button.
4. A delete parameter confirmation box is displayed. Click on the OK button to delete the parameter
Figure 3-14 Delete Parameter Confirmation Box
Getting Start
ed with Data
Getting Started with Data Analyzer 32
3-3-3 Delete a Data Source
Follow the steps given below to delete a data source:
1. Click on the Admin option in Data Analyzer Dashboards menu. This displays the Administration dialog box. Click on the DataSources tab to open the corresponding tab page.
2. Select the data source to be deleted from the DataSourceName list.
3. Click on the Delete Data Source button. A confirmation box is displayed. To delete the selected data source, click on the OK button.
Figure 3-15 Delete Data Source Confirmation Box
NOTE: Click on the Show/Hide Data Source option in the Data Analyzer Dashboards menu to show or hide the list of available data sources.
Getting Started with Data Analyzer 33
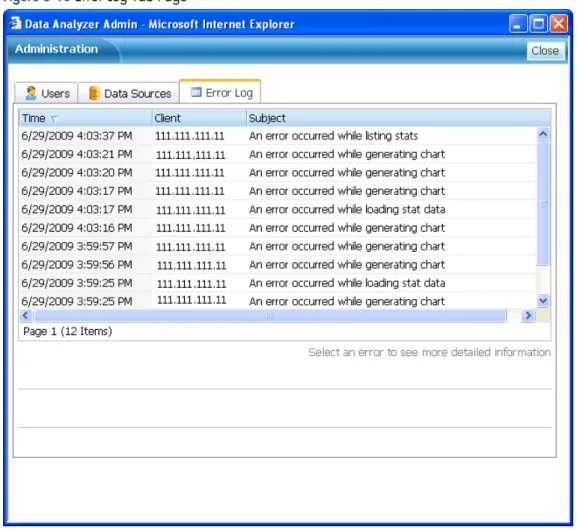
3-4 Error Log
Data Analyzer provides the facility of capturing all the errors & warnings encountered while generating reports. This feature can be accessed using the Error Log tab page in the Administration page.
Figure 3-16 Error Log Tab Page
You can select an error to see detailed information. The Error Log provides the following information:
• Time: The date and time when the error occurred.
• Client: The IP address of the client where the error occurred.
• Subject: Details of the errors encountered.
You can select an error from the list for detailed information.
NOTE: You can sort the error using Time, Client and Subject fields.
Getting Start
ed with Data
Data Analyzer Interface 34
4 Data Analyzer Interface
4-1 Overview
Seeing and interacting with data are the two factors essential for understanding the answers hidden in them. Imagine being able to marry your data, for example, transaction data, device state data, CPU busy, network busy and disk busy statistical information to determine exactly what caused a problem at 3:12 PM on Tuesday. You will no longer need to guess what caused performance problems on your network. You can do root-cause analysis and take immediate corrective action to fix the condition. Data Analyzer provides you the confidence that the information you are viewing will help your organization achieve performance excellence. It allows you to dynamically create graph, chart and grid “Dashlets” for meaningful displays of your most important data assets. problem
This in topic, we would learn about the various elements of the Data Analyzer web application.
Data Analyzer Interface 35
4-2 Dashboards Browser
Figure 4-2 Data Analyzer Dashboards Browser
Data Analyzer provides a powerful dashboard object browser that displays all the configured Dashboards in a Tree outline. This tree browser provides single click refresh to the Dashboard objects. The following data is displayed in the view:
• Dashboard: Name of the Dashboard
• Panels: Lists all the Panels configured in a Dashboard.
• Entities: Entities to be displayed in a Panel.
• Filtering Criteria: Individual filter conditions in a filter.
Data Analyzer Interface 36
4-3 Available Data Sources Browser
Figure 4-3 Data Analyzer Available Data Sources Browser
Data Analyzer provides wrappers for most of the major databases. The browser displays the information at the following levels:
• Data Source: The Name of the data sources configured with Data Analyzer.
• Data Source Elements: Lists all the names of all the elements in the selected Data Source.
• Timeframes: List the timeframes for which the data is to be viewed. For example: 5 Minutes, Hourly and Daily.
Data Analyzer Interface 37
4-4 Data Source Explorer
Figure 4-4 Data Analyzer Data Source Explorer
The Data Source Explorer is displayed as a tab on the right pane of Data Analyzer. The tab is displayed as Select a Data Source to Browse when no Data Source is selected from the Available Data Sources browser. The explorer lists all the Data Source element entities in the selected timeframe.
The Data Source Explorer can also be used to update the Host information using the corresponding box. Enter the value in the Host box and click on the Update button. Use the Clear button to reset the Host field. Enter the Date and time vales using the Time field. Clicking on the field displays the Reposition To dialog box. Select the date and time in the dialog box and click on the OK button. To update the information, click on the Update button. Use the Clear button to reset the field.
Data Analyzer Interface 38
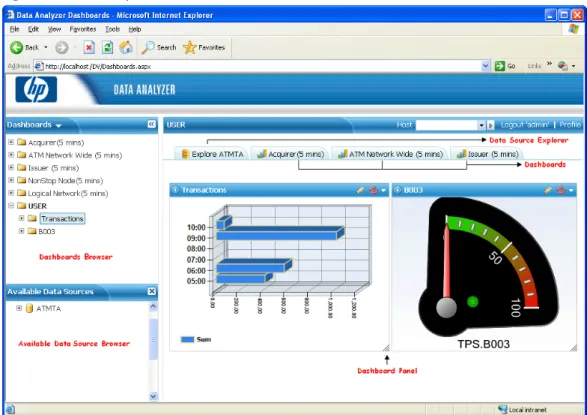
4-5 Dashboards
Figure 4-5 Data Analyzer Dashboards
Data Analyzer has been designed keeping it in mind that the worth of data depends upon the ability to access it, analyze it, interpret it, and communicate it. The goal is to make the vital information accessible to the people who need it to make decisions, in a way that is easily and correctly communicated.
Data Analyzer helps drive performance success by representing your business using striking and meaningful visuals in consolidated business-oriented views or Dashboards. Dashboards provide critical information in just one screen rather than flipping through multiple pages.
Dashboards in turn are made up of panels, each representing a business area to be focused. You can create business-specific dashboards using various filtering criteria.
Working with Dashboards 39
5 Working with Dashboards
The Data Analyzer Dashboards can be used to dynamically create graphs, charts and grids for meaningful displays of your most important data assets. This topic covers how to create and maintain Dashboards.
5-1 Create a New Dashboard
Follow the steps given below to create a new dashboard.
1. Click on the New Dashboard option in Data Analyzer web page Dashboards menu.
Figure 5-1 Dashboards Menu
2. Clicking on the New Dashboard option displays the Dashboard Configuration dialog box.
Figure 5-2 Dashboard Configuration Dialog Box
Working with Dashboards 40
3. Enter the following details in the corresponding fields:
• Dashboard title: Enter the name of the dashboard to be created.
• Host name (filter): This field can be used to filter the transactions from the specified Host.
• Time offset (minutes): This field can be used to specify the difference between the GMT and LCT time in minutes.
• Number of intervals: Select the number of intervals from the drop-down list.
• Refresh Interval: Select the data refresh interval.
• Show in tabs list: Select the checkbox to display the dashboard in the tabs list.
• Dashboard description: Specify a brief description for the dashboard to be created.
4. Click on the OK button to save the Dashboard configuration.
The new dashboard name will be added to the Dashboards Browser. You will have to add panels to it and specify filters.
Working with Dashboards 41
5-2 Adding Panels to a Dashboard
Once Dashboards are created and configured, the next step is to add panels to it. Panels define the entities that would be displayed in the dashboard view.
Follow the steps given below to add panel(s) to a dashboard.
1. Select the dashboard from the Dashboard Explorer and right-click on it. Select the New Panel option from the displayed right-click menu.
Figure 5-3 Data Analyzer Dashboard Right-Click Menu
2. The Panel Configuration dialog box is displayed with Panel Config tab page by default.
Figure 5-4 Panel Configuration Dialog Box
Working with Dashboards 42
3. Panel Config Options
The Panel Config tab is the first tab available in the Panel Configuration dialog box. Enter the following configuration information in the Panel Config tab page.
• Panel title: Displays the name of the Panel as specified during creation of the panel.
• Host name (filter): This field can be used to filter the transactions from the specified Host.
• Time offset (minutes): This field can be used to specify the time offset in minutes.
• Panel Type: Select the display type for the panel. The options available are Chart, Grid, Gauge, Indicators and Web Page. The other tabs displayed in the Panel Configuration dialog box depends on the panel type selected.
• Refresh Interval: Select the data refresh interval.
• Linking options: This field enables Inherit host name and/or Inherit date/time.
• URL: This option is displayed when Web Page is selected as the Panel Type. Specify the URL to be displayed.
• Panel description: Specify a brief description for the panel.
4. Chart Config Tab Page
The Chart Config tab page is displayed when you select the Panel Type as Chart in the Panel Config tab page.
• Chart Type: Select the chart type from the drop-down list. The options available are Line, Spline, Stepline, Pie, Doughnut, Column, StackedColumn, StackedColumn100, Bar, StackedBar, Stacked Bar100 and Point.
• Series name: Select the series name using the corresponding drop-down list. The options available are: Add countername and Entitynameonly.
• Legend position: Select the position where the legend will be displayed on the chart. The options available are Inside, Outside– top, Outside– bottom, Outside– right and NoLegend.
• Number of intervals: Select the number of intervals from the drop-down list.
• X-Axis margin: Select the text to be displayed on the X-Axis margin.
• X-Axis format: Select the display format of X-Axis. The options available are Auto, HH:mm, HH:mm:ss, MMM, MMM d, MMM d HH:mm, MMM yyyy, MMM d yyyy.
• Y-Axis 1,2 titles: Select the titles you want to display for Y-Axis 1 and 2.
• Other options: Use the various options available in the drop-down box to Render in 3D, Add scalebreaks and/or Print date/time in title.
5. Data Options Tab Page
The Data Options tab page is displayed when you select the Panel Type as Chart in the Panel Config tab page.
• Y-Axis 1,2 data types: Select the type of data you want to display for Y-Axis 1 and 2. The options available are Default, Percent and Currency.
• Y-Axis 1,2 digits after decimal: Select the number of digits to be displayed after the decimal from the drop-down list for Y-Axis 1 and 2.
• Y-Axis 1,2 max value: Enter the maximum value for the Y axis to be displayed on the chart.
• Marker 1 value and label: Enter the value and label for the first marker.
• Marker 2 value and label: Enter the value and label for the second marker.
6. Gauge Config Tab Page
The Gauge Config tab page is displayed when you select the Panel Type as Gauge in the Panel Config tab page.
• Gauge Type: Select the gauge type using the corresponding drop-down list. The options available are Default, Semi-circular, Circular and Quarter-Circular.
• Seriesname: Select the series name for the panel from the drop-down list. The options available are: Add countername and Entity name only.
• MinimumValue: Enter the minimum value to be displayed on the gauge.
• MaximumValue: Enter the maximum value to be displayed.
• ShowIndicator: Select whether you want to display the indicator.
Working with Dashboards 43
7. Indicators Config Tab Page:
The Indicators Config tab page is displayed when you select the Panel Type as Indicators in the Panel Config tab page.
• Series name: Select the series name for the panel from the drop-down list. The options available are: Add counter name and Entity name only.
• Y-Axis 1,2 Data Type: Select the type of data using the DataType drop-down list. The options available are Default, Percent and Currency.
• Y-Axis 1,2 Digits after decimal: Select the number of digits to be displayed after decimal from the drop-down list.
• Show value as a part of text: Select this option to display the values as a part of text in the panel.
8. Links Tab Page:
The Links tab page can be used to link the panel with panels available in already configured Dashboards. To link the panel with another panel, select the corresponding check box.
9. Click on the OK button on the Panel Configuration dialog box to save the configuration. The steps above will add a blank panel to the selected Dashboard.
Working with Dashboards 44
5-3 Adding Data to Panels
Follow the steps below to add data to be displayed in the Dashboard panels.
1. Select the Dashboard panel in the Dashboards Browser.
2. All the available data sources configured with Data Analyzer are displayed in the Available Data Sources Browser panel in a tree-view, along with the data elements and the timeframes. Select the Data Source – Data Source Element – Timeframe, (for example ATMTA – Acquirer- Daily ) in the Available Data Sources Browser. Data available for the selection made is displayed in the Data Source Explorer area.
3. Drag the entity to be added to the panel from the Data Source Explorer area and drop it on the panel name displayed in the Dashboards Browser. You can add multiple entities to a panel.
Figure 5-5 Data Added to the New Panel
NOTE: The panel added will be displayed in the given format Data Source Name.Data Source Element (Time Frame).
4. After adding multiple panels to a dashboard you need to apply some filter conditions on the basis of which the data will be displayed. To add a filter to a panel select Add Filter option from the panel’s right-click menu. This will display the Filter Options dialog box.
Working with Dashboards 45
5. Select the Filter type using the corresponding box. The options available in the FilterType drop-down list are:
• Select Top Entities: This option will allow you to select and display the statistics of N number of entities from the top.
• Select Bottom Entities: This option will allow you to select and display the statistics of N number of entities from the bottom.
• Select Filter: This option will allow you to select the filter to be applied. Enter the filter specifications using the Select If field. In case you want to add more conditions, click on the button.
• Sum of Entities: This option will allow you to display the sum of all the entities. Specify the display name using Display As field. Enter the value of scale breaks using Scale By field. Select Avg. Result check box to show the average result of the filtered data.
• Count of Entities: This option will allow you to display the count of all the entities. Specify the display name using Display As field.
You can also edit or delete a filter using the corresponding right-click menu option.
6. Specify the maximum number of entities using the Max # of Entities field.
7. Select the entities using the Select drop-down field. The options available are as follows:
• All entities: This will select all the entities.
• Using conditions: Use this option to select entities based on criteria specified. An example has been provided below for your reference.
Figure 5-7 Filter Display Option Dialog box
• Using Boolean Expressions: This option enables you to specify the Boolean expression as a filter condition. Select the Expression using the corresponding drop-down
8. Specify the match criteria of the conditions using Match drop-down box. The options available are All specified conditions and Any specified condition.
9. Click on the OK button to continue.
10. In order to meet the filter criteria, you need to apply the threshold conditions on the selected filter. Select Display Options from the right-click menu of the filter. It will display the corresponding dialog box.
Working with Dashboards 46
Figure 5-8 Filter Display Option Dialog box
• Specify the threshold name and color using the Series name / color field.
• Select the type of chart to be displayed using the Chart Type drop-down field. The options available are: Default, Line, Spline, Column, Stepline, and Point.
• Specify the value to be used for the Y-axis using the corresponding box. The options available are First (left) and Second (right).
Working with Dashboards 47
5-4 View and Edit Data Source Options of an Entity
Perform the following steps in order to view the data source of a selected entity:
1. Select the entity from the panels available in a dashboard whose data source is to be viewed and right click on it.
Figure 5-9 Data Analyzer Panel Right-Click Menu
2. Select the Data Source Options from the displayed right-click menu. This will display the Data Source Options dialog box.
Figure 5-10 Data Source Options Dialog Box
Working with Dashboards 48
3. Specify the following information in the dialog box:
• Data source interval: Select the data source interval.
• Counters type: Select the type of counter, for example, Raw/Default.
• Use as marker: Specify to use as marker using the drop-down box.
• Host name (filter): This field can be used to filter the transactions from the specified Host.
• Scale data by: Specify the data scaling parameter.
• Data interval offsets: This option enables you to compare the previous stats data with the current stats. Specify the time duration in negative for which the data has to be compared, for example -24 Hours.
Working with Dashboards 49
5-5 Viewing a Dashboard
Follow the steps listed below to view a Dashboard.
1. Select the dashboard you want to view from Dashboard Explorer and right-click on it.
2. Select the View Dashboard option from the displayed right-click menu.
Figure 5-11 Dashboard Right-Click Menu – View Dashboard Option
Clicking on the View Dashboard option displays the Dashboard as a tab in the Dashboards pane on the right side.
Working with Dashboards 50
5-6 Cloning a Panel
Follow the steps listed below to clone a Panel.
1. Select the Panel you want to clone from Dashboard Explorer and right-click on it.
2. Select the Clone option from the displayed right-click menu.
Figure 5-12 Panel Right-Click Menu – Clone Option
3. The Panel Configuration dialog box is displayed. Perform the required changes in the various fields available.
Figure 5-13 Clone Panel dialog Box
Working with Dashboards 51
5-7 Deleting a Panel
Perform the following steps to delete an existing panel:
1. Select the panel to be deleted from the panels available in the dashboard.
2. Select the Delete option from the panel right-click menu option.
3. A confirmation box is displayed. Click on the OK button to delete the selected panel. The panel will be deleted from the list of panels.
Working with Dashboards 52
5-8 Cloning a Dashboard
Follow the steps listed below to clone a Dashboard.
1. Select the dashboard you want to clone from Dashboard Explorer and right-click on it.
2. Select the Clone option from the displayed right-click menu.
Figure 5-14 Dashboard Right-Click Menu – Clone Option
3. The Dashboard Configuration dialog box is displayed. Perform the required changes in the various fields available.
Figure 5-15 Clone Dashboard dialog Box
Working with Dashboards 53
5-9 Deleting a Dashboard
Perform the following steps to delete an existing dashboard:
1. Select the dashboard to be deleted from the Dashboards Browser.
2. Select the Delete option from the dashboard right-click menu option.
3. A confirmation box is displayed. Click on the OK button to delete the selected dashboard. The dashboard will be deleted from the dashboard panel.
Working with Dashboards 54
5-10 Dashboards Drill-Down Feature
Data Analyzer is a Web-based operational too that enables any user to create, monitor, analyze, and drill down into any KPI across the enterprise. Vital KPI measurements can now be accessed and used without the
complexities associated with traditional data gathering, collaboration, and calculation.
Dashboards are the new face of information management. They enables operations to display data from any system using an extensive choice of graphical KPI gauges; create required process KPIs from data residing in any system; build comprehensive dashboards using visual elements (alert icons, traffic light, trends, progress bars, and gauges); go from data to actionable KPI information without writing code; and eliminate the need for spreadsheets by providing an engine that performs real-time calculations.
To drill-down, click on the area of the chart for which detail information is required. This displays a menu with the following options:
• Analyze: Click on this option to displays the next level drill-down chart.
Figure 5-16 Data Analyzer Drill-Down Feature – Analyze
• Configure Actions: Use this option to configure actions. Clicking on the option displays the Edit Actions dialog box.
Working with Dashboards 55
5-11 Dashboard Panel Icons
1. Edit Panel Options: The icon allows you to edit the Panel Configuration. You can select the
corresponding options to change the view of the graphical representation according to your requirements.
2. Refresh Panel: The icon will refresh the data displayed.
3. Apply Filter Expression: The icon will allow you to apply the filter condition on the data source column names. Use icon to remove the filter condition.
4. View Options: The icon enables you to perform the following tasks:
• Grid: Selecting this option will change the panel graphical representation into the corresponding grid representation.
• Chart: Selecting this option will change the panel graphical representation into the corresponding chart representation.
• Reposition Date/Time: This menu item will allow you to configure the data for any particular date and time interval. Selecting this option will display the corresponding dialog box. Select the date of which you want to visualize the data. Enter the time in the specified HH:MM:SS time format. Select the Synchronize all panels check box to visualize the data for the same time interval in the other panels.
Figure 5-18 Reposition Panel Dialog Box
• Switch to Live Mode: Selecting this option will display the real-time data.
• Maximize: Selecting this option will maximize the panel representation
• Delete: This option will allow you to delete the corresponding panel from the list of panels available in the dashboards.
• Export to Excel: Selecting this option will allow you to export the data to an .xls file.
• Show / Hide expression filter: This option will allow you to either view or hide the filter expression.
NOTE: The Export to Excel and Show/Hide expression filter option will be available only when you select Grid option as Panel Type.
Working with Dashboards 56
5-12 User Profile Options
The Profile option is available on the top most right corner of the user interface and provides options to perform user profile related tasks. Clicking on the option displays the following options.
Preferences
The Preferences option enables you to configure Data Analyzer preferences. Selecting the option displays the Configure Preferences dialog box.
Figure 5-19 Configure Preferences Dialog Box
Enter the following details:
• Dashboards time offset: Specifies the time offset for the dashboards. The options available are 0 – None and h0 – Web Server Time. The value “h0” can be used to adjust the data time to the web server's time if the data is in UTC. A numeric value can also be specified to adjust the time by the given number of minutes (the value may be negative).
• Data Sources to load: Lists the data sources available.
Change Password:
The Change Password option enables you to change the user password. Clicking on the option displays the Change Password dialog box. Specify the Current Password and the New Password in the respective fields for the user.
Figure 5-20 Change Password Dialog Box
Save Dashboards:
Data Source Actions 57
6 Data Source Actions
Data Analyzer provides the functionality of assigning action(s) to various Data Source elements displayed in the Available Data Source browser.
Follow the steps listed below to add actions.
1. Select the Data Source elements from the Available Data Source browser.
2. Perform a right-click action and select the Actions option from the displayed right-click menu. The Edit Actions dialog box is displayed.
Figure 6-1 Edit Actions Dialog Box Browser
3. Specify a name for the action in the Action Name box.
4. Enter the URL for the action in the corresponding box.
5. Click on the Add Action button to add the action. The action is added in the Add Name list in the Edit Actions dialog box.
You can add multiple actions using the Edit Actions dialog box.