Animated Courseware Support for Teaching
Database Design
Meg Murray and Mario Guimaraes
Kennesaw State University, Kennesaw, GA, USA
[email protected];
[email protected]
Abstract
Database technologies are a core component of computing technology curricula. Their impor-tance will only continue to expand as more and more data are retained in database systems. An effective database system is predicated on a good data model. Database design is the conceptu-alization of an underlying data mode l that progresses from identifying user requirements to graphica lly depicting those requirements and fina lly mapping the graphical models to a set of ta-bles implemented in a physical database system. The abstract nature of much of database design makes it challenging to teach. This paper presents a set of software animations designed to sup-port the teaching of database design concepts. Topic areas covered include mapping problem descriptions to Entity Relationship (ER) diagrams, mapping ER diagrams to tables, normalization and denormalization and comparison of various ER notation sets. The animations are fairly intui-tive to use and are independent of any specific database text or product. They are intended to provide supplementa l instructiona l support and a lso provide students with additiona l learning op-portunities.
Ke ywords: database, database design, entity re lationship diagrams, norma lization, database
soft-ware animations.
Introduction
Database technologies are foundationa l to effective information systems and an effective database system is predicated on a good data model. The goal of database design is to conceptualize an underlying data model and determine an appropriate structure to be used in the physical imple-mentation of that mode l. Consequently, understanding database design is central to understanding a good data model and an effective database implementation. However, the abstract nature of da-tabase design can make it challenging to teach and challenging to learn (Chilton, McHaney, & Chae, 2006). One way to address this challenge is through the use of supplementa l instructiona l materials. We are developing a set of software animations to support the teaching of database de-sign as well as other database related concepts. The animations are part of a larger animated
data-base courseware project funded through a Nationa l Science Foundation Course, Curriculum and Laboratory Improve-ment grant. The courseware is freely available and can be accessed at http://adbc.kennesaw.edu
Animations and visua lizations have been touted as a means to provide
addi-M aterial published as part of this publication, either on-line or in print, is copyrighted by the Informing Science Institute. Permission to make digital or paper copy of part or all of these works for personal or classroom use is granted without fee provided that the copies are not made or distributed for profit or commercial advantage AND that copies 1) bear this notice in full and 2) give the full citation on the first page. It is per-missible to abstract these works so long as credit is given. To copy in all other cases or to republish or to post on a server or
ologies such as lectures and textbooks do not appear to be sufficient. Animations have been used in many disciplines, including computer science, where animations exist to support the teaching of algorithms, machine execution, networking and programming. While the achievement of learn-ing outcomes as a result of uslearn-ing animations has been mixed, there is evidence that animations do support the teaching and learning process. Animations have been found to increase student moti-vation and visualizations have been found to help students develop understanding of abstract con-cepts which are otherwise considered to be ‘invisible’ (Steinke, Huk, & Floto, 2003). In their study of ways to introduce the idea of pervasive computing to students, Woodcock, Burns, Mount, Newman, and Gaura (2005) cite that using words and pictures helped students construct verbal and pictoria l menta l mode ls as well as to build connections between them and increased their ability to understand the precepts of the topic under study. Further, Mayer (2001) notes that the capacity of animations to portray information in a different way engages the use of an addi-tional cognitive channel, thereby, reducing the learner’s overall cognitive load. Whatever the case, providing multiple venues of learning support such as supplemental instructional materials does contribute to heightened levels of student learning.
A review of the literature revealed very few animations or visua lized tutorials that support the teaching of database concepts. A majority of these programs focus specifically on some aspect of SQL or query execution. For instance, W3Schools (W3Schools, 2009) offers an interactive SQL tutorial and Allenstein, Yost, Wagner and Morrison (2008) provide a simulation system to enable students to visua lize the steps required to execute a database query. The WINRDBI Educational Tool developed at Arizona State University (WINRDBI Educational Tool, n.d.) provides an in-terpreter that allows students to program in interactive SQL, relational a lgebra, domain calculus or tuple calculus. While several drawing tools are available that provide support for the mechani-cal creation of ER diagrams, no animated instructional support materia ls were found that that ad-dress the topic of database design.
The process of database design includes identifying user requirements, conceptualizing those re-quirements into a graphical data mode l, mapping that model into a physica l database system and assessing the mode l to insure data anomalies are reduced, data integrity ma inta ined and data re-dundancy eliminated, a process known as normalization. The animations inc luded for database design in the Animated Database Courseware (ADbC) project follow this process for the devel-opment of a relational database system. Specifically they inc lude sub-modules for mapping sce-narios to data models using Entity-Relationship (ER) Diagrams, converting ER diagrams to tables and normalization and denormalization. They also inc lude a sub-module demonstrating various ER notation sets. In this paper, each of these modules will be discussed inc luding a short discus-sion of the design princ iple, the purpose of the animations and how they might be utilized in the classroom.
ER Notation Sets
An Entity-Re lationship (ER) Diagram is a conceptual representation of data and their relation-ships. ER diagrams depict the organization of data into thematically characterized entities sup-ported by correlated details referred to as attributes or fie lds and are comprised of four compo-nents, entities, re lationships, attributes and cardina lities. (Although, for simplicity and to avoid clutter, attributes are sometimes not displayed.) Relationships between entities are identified as the cardinality or quantitative minimum or maximum number of instances of an entity that may participate in a relationship. For example, in a typical academic scenario, entities might be organ-ized into students, faculty and courses. ‘Faculty teach courses’ and ‘students take courses’ are examples of relationships. Cardina lity defines minimum and maximum participation such as ‘a faculty member may teach from one to many courses.’ Cardinality is close ly aligned with pre-defined rules.
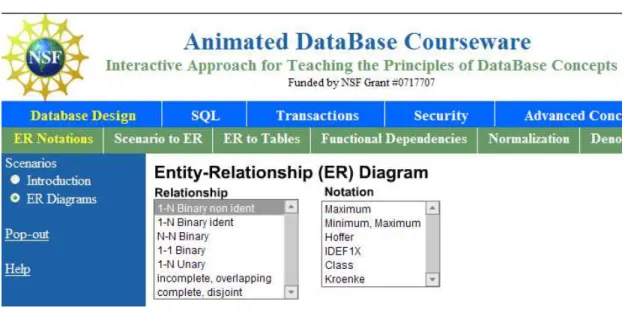
ER Diagrams were first articulated by Peter Chen in 1976 (Chen, 1976) but no standard notation set has been adopted for their creation. This can be confusing as different software designers, da-tabase texts and different software programs use different symbol sets. The purpose of the ER Notation Sets animation is to allow users to quickly associate one notation set with another. The animation consists of seven different relationships with six different notation sets. Relationships inc lude 1-N Binary Non Identifying, 1-N Binary Identifying, N-N Binary, 1-1 Binary, 1-N Unary, Generalization (incomplete, overlap) and Generalization (complete, disjoint). Notation sets de-picted inc lude the Maximum, Minimum/Maximum, Martin (1989) notation (as used in Hoffer, Prescott & Topi, 2008), UML Class and the IDEF1X adopted by the US federal government. Al-so inc luded is the notation used by Kroenke (2006) and Kroenke and Auer (2008) in their many database textbooks. Other notation sets exist but this collection, while including some of the more well-known notation sets, orients students to the non-standardization that exists in symbols em-ployed in ER Diagram mode l development. Figure 1 depicts the ER Notations animation inter-face.
Figure 1: ER Notations Animation Inte rface
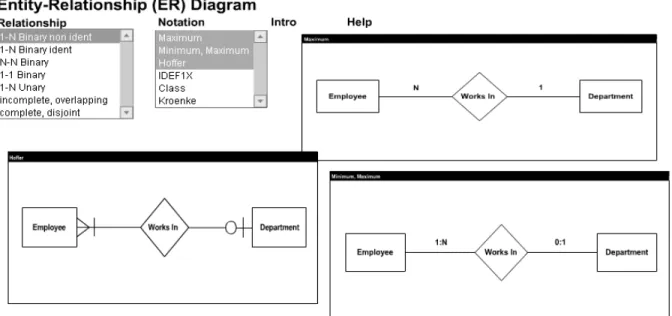
Figure 2 shows a 1-N Binary Non-Identifying Relationship in three different notations: Maxi-mum, Minimum/MaxiMaxi-mum, and Martin (from Hoffer, Prescott, & Topi, 2008). It is a binary rela-tionship because there are two entities involved. It is non-identifying as neither entity identifies the other. The numbers on each side of the relationship indicate cardina lity. Note that when there is only one number on each side, it always refers to maximum cardinality. According to the dia-grams in Figure 2, an Employee may belong to a maximum of one Department and a Department may have a maximum of many Employees. The minimum and maximum notation is a more com-plete description of the relationship, but also more complex. It reads, an employee may not work in any Department (zero) and may work in at most one department. A department has at least one employee (1) and may have many employees (N). Students often benefit from reviewing the maximum notation first followed by the minimum/maximum groupings. Also inc luded in this figure is the Martin notation which utilizes ‘crow’s feet’ to depict cardina lity. The oval corre-sponds to optiona l, the hashmark to one or mandatory and the crowfoot to many. It is easy to ex-pla in this notation, when it is compared side-by-side with the Minimum/Maximum notation.
Figure 2: Example One-to-Many Binary Re lationship using Three Diffe re nt Notations
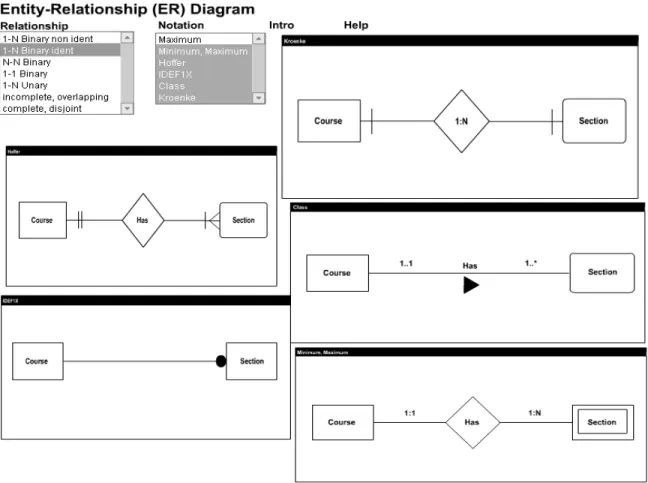
Figure 3 demonstrates the same relationship using three different notation sets. IDEF1X uses the dashed line to distinguish a one-to-many non-identifying re lationship. The Kroenke notation shows the maximum cardinality inside the diamond and the minimum cardinality close to the re-spective entities. The class diagram notation uses an asterisk to show a one-to-many relationship.
Figure 3: Example One-to-many Binary Re lationship Using Three Diffe re nt Notation Se ts
Figure 4 demonstrates how various notations sets depict an identifying re lationship. In an identi-fying relationship, a weak or dependent entity exists. A weak entity is one that cannot exist on its own. In this example, the weak entity is named ‘Section.’ A section of a course cannot exist
with-out a corresponding course. In an identifying relationship, the minimum cardina lity of the parent entity is always one or mandatory. In these notation sets, the weak/dependent entity is either de-picted as a round rectangle or a rectangle inside a rectangle.
Figure 4: Binary One -to-Many Ide ntifying Re lationship
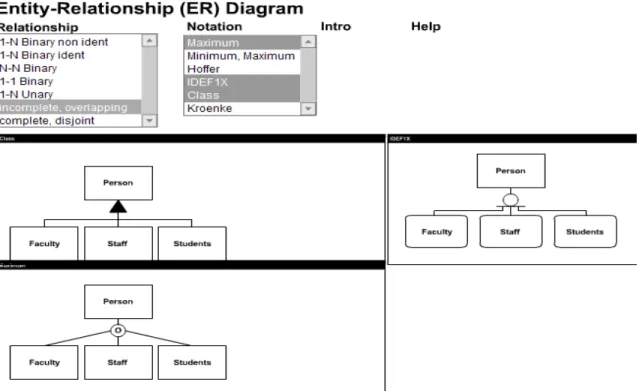
Other relationships inc luded in this sub-module inc lude unary relationships and generalization. In a unary relationship (also called recursive) there is only one entity involved and the relationships are between instances of the same entity. Generalization, referred to as an ‘is-a relationship’ represents supertype/subtypes. Figure 5 shows an example generalization in which the subtypes are overlapping (the supertype may also be represented in more than one subtype).
Figure 5: Ge ne ralization Re lationship De picte d in Diffe re nt ER Notation Sets
The ER notation animations may be used in the classroom when the topic of ER diagrams is in-troduced. One approach is to ask students to work through each of the relationships using only one of the notation sets. Then students are asked to explore various combinations of the relation-ships using various notation sets. Students should be directed to use this animation for future ref-erence when creating or interpreting ER diagrams.
Scenario to ER Diagrams
Data models are built from an analysis of a problem scenario and user requirements. These re-quirements are obtained by collecting data from users, input forms, reports and other related do-cumentation. Conceptual design includes the visua lization of the requirements in a graphical data mode l. As noted previously, the ER diagram is the most commonly used technique for mode ling data for relational databases. The ER diagram visually displays entities and the relationships that exist between them.
This sub-module inc ludes a set of eight different problem scenarios in which users are presented with four possible ER diagram solutions and asked to choose the best one. The scenario provided may be a problem specification, a form or a report. The first four scenarios are problem descrip-tions (Employees, Automobiles, Medical and Car Dealer), the next two are forms (Orders, Phone) and the last two are reports (Suppliers and University). Figure 6 shows possible ER diagram solu-tions for a scenario based on a problem description. Solusolu-tions may be viewed individua lly or all together. Users select the solution they believe to be correct and corresponding feedback is pro-vided.
Figure 6: Example Sce nario to ER Diagram Exe rcise
Animations in this sub-module may be introduced to students to reinforce classroom instruction related to constructing ER diagrams. Completing the exercises may be assigned as an in-class or out-of-class assignment. Students are asked to complete each of the listed exercises. For each scenario, students are instructed to read the scenario, view each of the possible ER diagram solu-tions and then choose the diagram they feel best meets the specificasolu-tions outlined in the scenario. Students are encouraged to work through the exercises until they feel they are able to easily iden-tify the ER diagram that most adequately meets the specifications provided.
ER to Table
The next step of the database design process are to map the data model into a physical database system. Entity Relationship diagrams form the basis for this physical implementation. Entities are mapped to tables and relationships are mapped to corresponding fore ign keys. In essence, an at-tribute column is duplicated between two tables. A set of rules exist that that define the best methods for implementing foreign keys. While these rules may be memorized, memorization does not necessarily result in understanding why those rules apply. This sub-module includes a set of seven different animated exercises that demonstrate where foreign keys should be placed. Five different relationships are provided inc luding one-to-many binary and unary, one-to-one bi-nary and many-to-many bibi-nary and ubi-nary. Each exercise offers the user the option to view the construction of an associated E-R diagram. The ER Diagram is constructed and data is automati-cally loaded in the tables. However, the tables have no relationships implemented. The user is asked to determine, from a choice of four possible options, the best way to map that relationship to tables. After each option, an animation is shown that completes the tables by adding foreign keys or association tables. The pros and cons of each option are illustrated through animation. An example of the initia l construction of the ER diagram and possible solutions is provided in Figure
Figure 7: Example ER Diagram Mapping to Tables
As with the Scenario to ER Diagram animations, these animations are used to reinforce classroom instruction. They can either be used in-class or as out-of-class assignments. For each scenario, students are asked to read the scenario, view the ER diagrams and the associated tables and then proceed to the exercise. Students should complete the exercise by choosing one of the possible answers and then reviewing the animation of the result of the answer they chose. Students are encouraged to work through each exercise and each answer until they feel they are able to apply the standard rules for mapping ER diagrams to tables for each of the relationship types presented.
Normalization
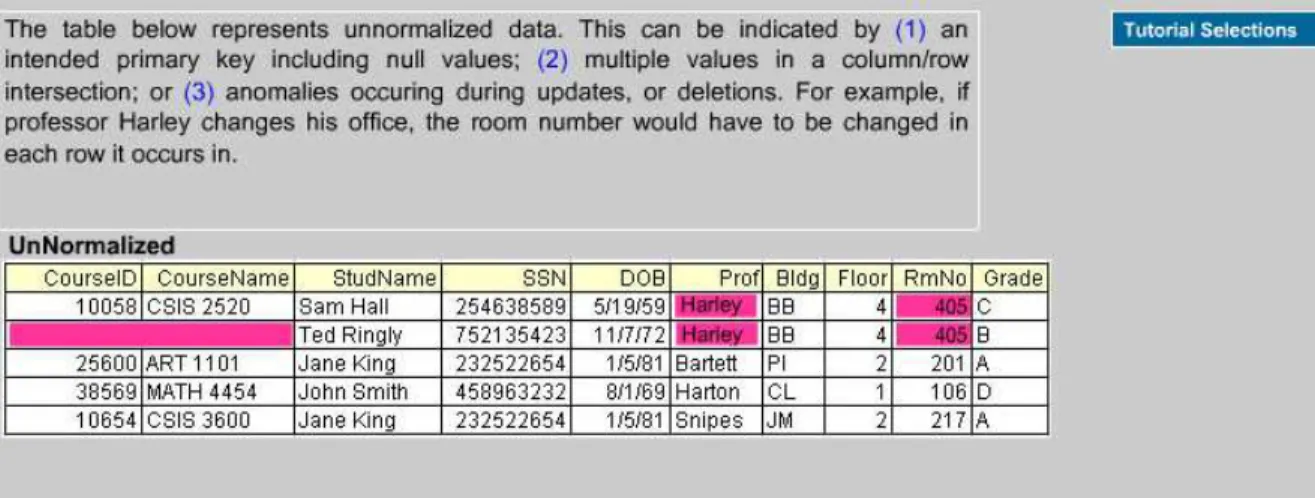
The objective of a good database design is to reduce redundancy and normalization is the process of organizing data into tables with the goal of reduc ing those redundancies. Unnecessary redun-dancy often results in poor performance and has the potential to introduce data anomalies increas-ing the risk of data inconsistency. Designincreas-ing normalized tables is a subject of great difficulty, yet, great importance. Normalization in categorized into forms with each higher-leve l form interject-ing a refinement of the lower-form. In practice normalizinterject-ing data to the third norma l form is most common. This sub-module includes a tutoria l that steps through the normalization of a large table into a set of tables complying to the rules of the third normal form. It also inc ludes descriptions and an example of how first, second and third norma l forms might be violated. Figure 8 shows the tutoria l screen which begins by displaying an unnormalized table.
Figure 8: Normalization Tutorial Introduction Scree n Showing an Unnormalize d Table
The tutoria l is followed by a set of exercises in which users are presented with a scenario, a set of data and a set of functional dependencies, and asked to normalize the data into tables adhering to the rules of third norma l form. Users choose attributes and create tables containing these attrib-utes. Clicking the finish button, reports on whether the normalization process has been completed correctly or not. Table 9 shows an example norma lization exercise.
Figure 9: Example Normalization Exe rcise
The tutoria l can be used in class to demonstrate the normalization process. Then students may be assigned to complete each of the six exercises working through them until they feel confident they understand the steps to normalize database tables to third normal form. In addition, a sub-module entitled ‘Anoma lies’ is also included. This sub-sub-module demonstrates problems that can occur when un-normalized tables are used.
Denormalization
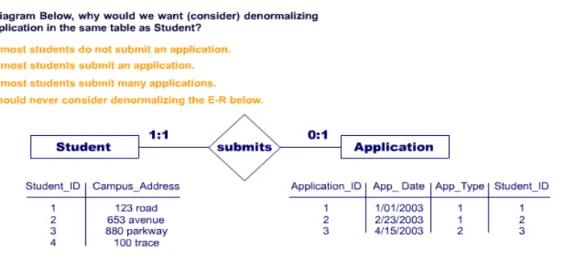
Although the usual approach in relational database design is to normalize tables in order to reduce redundancy and its associated problems, norma lization may not a lways be the most desirable de-sign strategy. Certain situations, including read only databases and the need for optimized query retrieval time, are more suitable to denormalization. The denomalization animation presents a scenario and asks users to choose the situation in which denorma lization might be appropriate. The result of each option, whether the best solution or not, is demonstrated. Figure 10 presents an example of a denormalization exercise.
Figure 10: Example De normalization Exe rcise
Conclusion
As more and more data is retained digitally in database systems, understanding what makes a good data mode l will grow in importance. Database technology is a core knowledge area in com-puting curriculum and database design is a core component of this curriculum. However, the ab-stract nature of data modeling makes it challenging for many students. Supplemental instructional materials provide students with additional learning opportunities. This paper provided an over-view of a set of animated courseware developed to support the teaching of database concepts. Topic areas covered in these animations inc lude mapping scenarios to ER diagrams, mapping ER diagrams to database tables and database normalization. The animations can be used in the class-room to provide additiona l means for demonstrating concepts. They can also be assigned as in-class or out-of-in-class assignments. Preliminary evaluations of the software have been positive. Student responses to surveys of their perceptions of the value of the animations and the results of a recently conducted usability study indicate that students perceive the animations to be valuable and contribute to their learning. In a pilot control group evaluation, students taught using the software outperformed those who did not on classroom examinations. Providing students with access to multiple learning channels and multiple modes of presentation, such as visualizations and animations, has been shown to increase student motivation, he lp students develop deeper un-derstandings and achieve higher leve ls of learning.
References
Allenstein, B., Yost, A., Wagner, P., & Morrison, J. (2008). A query simu lation system to illustrate data-base query execution. Proceedings of the 39th SIGCSE Technical Symposium on Computer Science
Education, SIGCSE '08. ACM, New York, NY, 493-497.
Chen, P. (1976). The entity-re lationship model - Towa rd a unified vie w of data. ACM Transactions on
Da-tabase Systems, 1(1), 9-36.
Chilton, M. A., McHaney, R., & Chae, B. (2006). Data modeling education: The changing technology.
Journal of Information Systems Education, 17(1), 17-20.
Hoffe r, J. A, Prescott, M., & Topi, H. (2008). Modern database management (9th ed.). Upper Saddle River, NJ: Prentice Hall.
Kroenke, D. (2006). Database processing: Fundamentals, design, and implementation (10th ed.). Upper Saddle River, NJ: Prentice Ha ll
Kroenke, D., & Auer, D. (2008). Database concepts (3rd ed.). Upper Saddle River, NJ: Prentice Ha ll Martin, J. (1989). Information engineering: Introduction. Upper Saddle River, NJ: Prentice Ha ll. Mayer, R. E. (2001). Multimedia learning. Ca mbridge: Ca mbridge Un iversity Press.
Steinke, M., Hu k, T., & Floto, C. (2003). He lping teachers develop computer animations for improving learning in science education. C. Crawford et al. (Eds.), Proceedings of the Society for Information
Technology and Teacher Education International Conference 2003. Chesapeake, VA: AACE,
3022-3025.
W3 Schools. (2009). SQL Tutorial. Retrieved March 8, 2009 fro m http://www.w3schools.com/ WINRDBI Educational Tool. (n.d.). Retrieved March 8, 2009 fro m http://www.eas.asu.edu/~winrdbi/ Woodcock, A., Burns, J., Mount, S., Ne wman, R., & Gau ra, E. (2005). Animating pervasive computing.
Proceedings of the 23rd Annual International Conference on Design of Communication, SIGDOC '05.
ACM, New York, NY, 116-122.
Biography
Dr. Meg Murray is an Associate Professor of Information Systems at
Kennesaw State University. She has extensive experience in both aca-deme and industry in the areas of software design, development and architecture. Her current work has focused on web services and using XML as a medium for data exchange. She is also actively involved in defining what it means to be IT literate in today’s world. She devel-oped a model for a healthcare information systems portal to facilitate the exchange of healthcare data stored in a variety of backend database systems. Twice she has been a semifina list for ‘Women of the Year in Technology in Georgia.’
Dr. Guimaraes is an Associate Professor of Computer Science at
Kennesaw State University where he teaches Database Management Systems. He has extensive experience in the development of educa-tional software and in teaching database content. Dr. Guimaraes has many years of experience both developing and coordinating the devel-opment of educational software and his software, ASA, has been commercialized throughout Brazil. He was a database administrator for the Brazilian Navy. Most recently, he completed a post-doctoral