Performance Analysis of Multilevel Parallel Applications on Shared Memory
Architectures
Gabriele Jost
*, Haoqiang Jin
NAS Division, NASA Ames Research Center, Moffett Field, CA 94035-1000 USA
{gjost,hjin}@nas.nasa.gov
Jesus Labarta, Judit Gimenez, Jordi Caubet
European Center of Parallelism of Barcelona-Technical University of Catalonia (CEPBA-UPC)
cr. Jordi Girona 1-3, Modul D6,08034 – Barcelona, Spain
{jesus,judit,jordics}@cepba.upc.es
Abstract
In this paper we describe how to apply powerful performance analysis techniques to understand the behavior of multilevel parallel applications. We use the Paraver/OMPItrace performance analysis system for our study. This system consists of two major compo-nents: The OMPItrace dynamic instrumentation mechanism, which allows the tracing of processes and threads and the Paraver graphical user interface for inspection and analyses of the generated traces. We apply the system to conduct a detailed comparative study of a benchmark code implemented in five differ-ent programming paradigms applicable for shared memory computer architectures.
1. Introduction
With the advent of parallel hardware and software technologies users are faced with the challenge to choose a programming paradigm best suited for the underlying computer architecture. With the current trend in parallel computer architectures towards clus-ters of shared memory symmetric multi-processors, parallel programming techniques have evolved that support parallelism beyond a single level. Multiple lev-els of parallelism can be achieved by a mix of processes and multithreading. Which programming paradigm is the best will depend on the nature of the given problem, the hardware architecture, and the available software. When comparing the performance of applications based on different programming para-digms, it is important to understand how the performance is influenced by what aspect of the
*The author is an employee of Computer Sciences Corporation.
digm. It is important to identify and quantify the per-formance metrics of a certain paradigm.
Quantification of performance characteristics can only be achieved by a detailed analysis. The Paraver [14] visualization and analysis tool was developed at CEPBA-UPC to provide the user with a means to ob-tain a qualitative global perception of the application behavior as well as a detailed quantitative analysis of program performance. Paraver allows the user to visu-ally inspect trace files collected during program execution. Traces are composed of state records, events, and communications, each with an associated time stamp. These three elements allow generating traces that capture the behavior of a program’s execu-tion. We used the OMPItrace module [12], which is optionally available with the Paraver distribution. The OMPItrace module allows dynamic instrumentation and tracing of applications with multiple levels of par-allelism.
There are very few published results containing de-tailed performance analysis data for multilevel parallel programs. We compare different implementations of one of the NAS Parallel Benchmarks [1] employing single and multiple levels of parallelism. We demon-strate how to conduct a detailed performance analysis to determine the impact of hardware and system soft-ware on the scalability of an application and its underlying programming paradigm.
The rest of the paper is structured is as follows: Sec-tion 2 gives a brief discussion of parallel programming paradigms applicable to shared memory architectures. Section 3 explains how Paraver/OMPItrace supports multiple levels of parallelism. Section 4 contains a comparative case study. Section 5 contains a brief dis-cussion of related work and the conclusions are presented in Section 6.
2. Parallel Programming Paradigms for
Shared Memory Architectures
Most shared memory architectures provide hardware support for a cache coherent globally shared address space. Process communication is usually supported by software but leverages the hardware support for the shared address space. This provides support for various programming paradigms.
2.1. Process Level Parallelism
We assume that each process has its own local memory. A well understood programming paradigm for process level parallelism is message passing. The com-putational work and the associated data are distributed among a number of processes. If a process needs to access data located in the memory of another process, the data has to be communicated via the exchange of messages. MPI (Message Passing Interface) [10], [11] is a widely accepted standard for writing message-passing programs.
The Shared Memory Access (SMA) programming paradigm is also based on the concept of processes with their own local memory, but it separates the communi-cation and synchronization step. In this programming model, a special memory area is allocated which is ac-cessible to all processes. Exchange of data is achieved by writing to and reading from the shared memory area. Data transfer between two processes is performed by only one side and does not require a matching operation by the other process. The correct ordering of memory access must be imposed by the user through explicit synchronization. The MLP library [18], developed at the NASA Ames Research Center, supports this pro-gramming paradigm by providing routines for process generation, shared memory allocation, and process syn-chronization.
2.2. Thread Level Parallelism
Parallel programming on a shared memory machine can take advantage of the globally shared address space. Compilers for shared memory architectures usu-ally support multi-threaded execution of a program. Loop level parallelism can be exploited by using com-piler directives such as those defined in the OpenMP standard [13]. OpenMP provides a fork-and-join execu-tion model in which a program begins execuexecu-tion as a single process or thread. This thread executes sequen-tially until a parallelization directive for a parallel region is found. At this time, the thread creates a team of threads and becomes the master thread of the new
team. All threads execute the statements until the end of the parallel region. Work-sharing directives are pro-vided to divide the execution of the enclosed code region among the threads. All threads need to synchro-nize at the end of parallel constructs; they also may synchronize at the end of each work-sharing construct or at specific points enclosed by the parallel construct. Data transfer between threads is done by direct memory references. In a nest of loops, parallelization directives can be applied to several of the loop levels. This allows groups of threads to work on different chunks of data. We consider nested OpenMP parallelism as multilevel parallelism, since grouping the threads imposes a hier-archy amongst them. Even though the nesting of parallelization directives is permitted by the OpenMP standard, it is not supported by many compilers. The NanosCompiler [3] was developed to show the feasibil-ity of exploiting nested parallelism in OpenMP and is used here.
2.3. Hybrid Parallelism
Process level parallelism and thread level parallelism can be combined into a hybrid paradigm to exploit par-allelism beyond a single level. The main thrust of the hybrid parallel paradigm is to combine process level coarse-grain parallelism, which is obtained i.e. in do-main decomposition and fine grain parallelism on a loop level which is achieved by compiler directives. The hybrid MPI/OpenMP approach has been used in various applications (e.g. [8],[9]).
The SMA programming model also allows a com-bination of processes and threads. We refer to the hybrid SMA/OpenMP programming paradigm as MLP (Multi-Level-Parallelism). MLP has been successfully applied at the NASA Ames Research Center [18].
3. Support for Performance Analysis of
Multilevel Parallel Programs
A trace-based visualization and analysis environ-ment consists of two basic components: the tracing package and the visualization tool. The power of the system depends on the individual capabilities of each component as well as on the proper interoperation be-tween them. The tracing tool must capture events that accurately characterize the behavior of the program. The analysis tool must post-process the trace informa-tion to display useful views and statistics.
3.1. The OMPItrace Module
We used OMPItrace [12] to instrument all the pro-gramming paradigms targeted by our analysis. The
basic OMPItrace mechanism traces OpenMP, MPI and hybrid MPI/OpenMP binaries without requiring source code modification or linking to special libraries.
The Paraver object model is structured in a three level hierarchy: Application, Task, and Thread. Each trace record is tagged with these three identifiers. This approach allows Paraver to support nested parallel pro-gramming models.
The SGI version of OMPItrace uses DITools [16] as the dynamic instrumentation mechanism. Calls to the dynamically linked OpenMP and MPI run-time librar-ies are intercepted by modifying the Global Offset Table (GOT)at load time. Events are emitted into the trace on entry and exit of MPI calls along with the message size and source/destination. Entry and exit of OpenMP parallel regions and work-sharing constructs are also tagged. In this programming model, the code regions that correspond to the body of the parallel re-gions/loops are outlined by the compiler and encapsulated as parallel routines. OMPItrace intercepts entry and exit to these routines as well as the run time calls that assign work when called by these outlined routines. Besides tracing these events, OMPItrace can read two hardware counters and emit their values to the trace. Reading the hardware counters poses a certain overhead, as it requires a system call. If hardware counters are not read, the overhead of the instrumenta-tion at one probe is about 1 microsecond. Reading the hardware counters increases the overhead by about 20-23 microseconds.
We extended OMPItrace to support process genera-tion and synchronizagenera-tion mechanisms different from those originally used for MPI and OpenMP. To support SMA and MLP it was necessary to add extensions to
dynamically intercept calls to the UNIX fork routine. We also added support for the state records that indicate MLP synchronization primitives and provided an in-strumented version of the MLP library to allow tracing.
3.2. Trace File Views
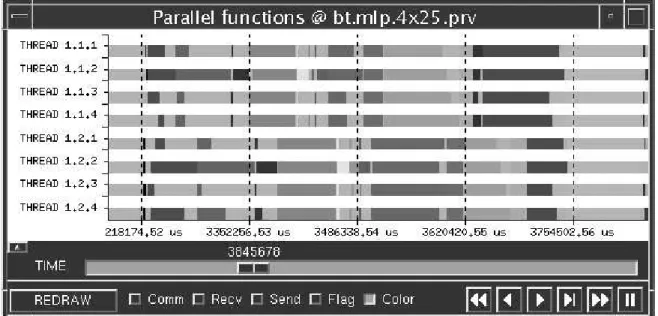
The traces collected during the execution of a pro-gram contain a wealth of information, which as a whole is overwhelming. We need to be able to screen out in-formation to gain visibility of a critical subset of the data. In order to understand the impact of various as-pects of hardware, operating system (OS), and program structure on the performance, it is necessary to correlate extracted subsets of information with each other. This can be done through timeline graphical displays or by histograms and statistics. Paraver provides flexibility in composing displays that are suitable for a particular problem. The timelines can be displayed at the level of individual threads but also at the level of processes. In the latter case, the values for each thread are combined to produce a value for the process. A user can specify through the Paraver GUI how to compute a given per-formance index from the trace and then save it as a configuration file. These configuration files can then be used to immediately pop up a view of the selected per-formance index. For example, it is possible to show when MPI calls are made, when parallel functions are being executed by each thread or what the MIPS or cache miss rates are for a given time interval. Figure 1 shows the parallel functions view of an MLP applica-tion with two processes and four threads in each process. The different colors indicate the parallel re-gions with light blue representing time that is spent
outside of parallel regions. Similar timelines can be obtained to indicate whether a thread is running, blocked, or in some other state.
Another interesting view can be obtained by masking time spent in process synchronization primi-tives, communication routines, time in OpenMP idle loops, OpenMP barriers and other OpenMP overhead. This allows to identify time intervals where useful computations are being done.
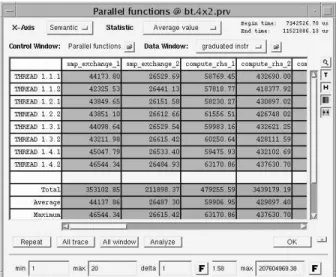
The quantitative analysis module in Paraver allows the display of profiles for each thread in the form of tables or histograms. It also provides mechanisms to correlate different types of profiles with each other. Typical statistics such as average, minimum, maximum values or standard deviation can be computed for any section of the timelines. The result is a powerful profil-ing capability. Example statistics that can be reported are time or hardware counter values for each thread within a user function or parallel routine. Histograms of certain function calls or the correlation between hard-ware counters and the given function call can also provide valuable information (see Figure 2).
Figure 2: Paraver analysis of graduated in-structions per thread and parallel function.
4. A Comparative Case Study
We used the BT benchmark from the NAS Parallel Benchmarks (NPB) [1] for our comparative study. The BT benchmark solves three systems of equations result-ing from an approximate factorization that decouples the x, y and z dimensions of the 3-dimensional Navier-Stokes equations. These systems are block tridiagonal consisting of 5×5 blocks. Each dimension is swept as depicted in Figure 3. We evaluated three parallelization approaches employing five programming models: Two pure process level parallel (MPI and SMA), two hybrid
parallel (MPI/OpenMP and MLP), and one nested OpenMP implementation of the same benchmark.
4.1.
Description of the Different Benchmark
Implementations
The MPI implementation of BT employs a multi-partition scheme [2] in 3-D to achieve load balance and coarse-grained communication. In this scheme, proces-sors are mapped onto sub-blocks of points of the grid such that the sub-blocks are evenly distributed along any direction of solution. The blocks are distributed such that for each sweep direction the processes can start working in parallel. Throughout the sweep in one direction, each processor starts working on its sub-block and sends partial solutions to the next processor before going into the next stage. Separate routines are used to form the left-hand side of the block tridiagonal systems before these systems are solved. A number of five- and six-dimensional work arrays are used to hold intermediate results. An example for one sweep direc-tion of a 2-D case is illustrated in Figure 4.
Figure 4: The multi-partition scheme in 2D.
x solve y_solve z solve add rhs init
Figure 3: Structure of the BT benchmark.
sweep direction sync points 3 0 1 2 2 3 0 1 1 2 3 0 0 1 2 3
Communications occur at the sync points as indi-cated by gray lines in Figure 4. We indicate the number of the process who owns the data within each square.
In the SMA implementation we employ the same al-gorithm, except that communications are handled by data exchange through the shared memory buffers and synchronization primitives.
The OpenMP implementation is based on the ver-sion described in [5]. The implementation is similar to that of the message-passing version, but the work arrays are reduced in size and a couple of the computa-tional intensive loops are fused. The code that we used contains nested OpenMP directives, which were auto-matically generated using the CAPO [6] parallelization tool. It also contains OpenMP extensions for nested parallelism supported by the NanosCompiler [3]. We used the NanosCompiler for the nested OpenMP code since nested OpenMP parallelism was not supported by the SGI compiler. The automatic generation of nested OpenMP directives using CAPO is described in [7].
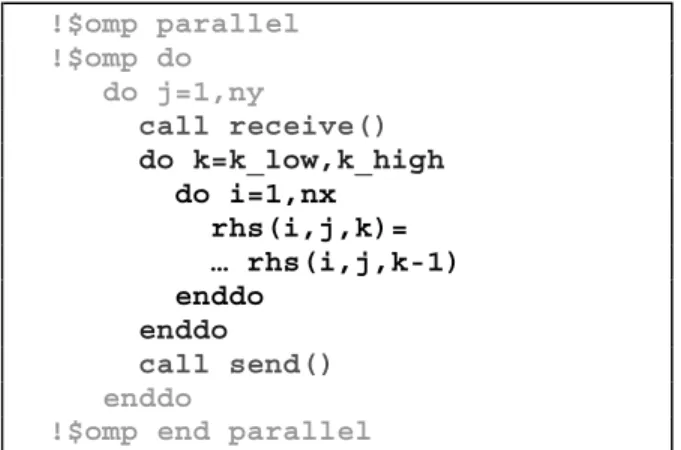
The hybrid MPI/OpenMP and MLP implementa-tions are also based on the versions described in [5], however, the memory requirements are higher than in the pure OpenMP code, since we have to provide the workspace for a one dimensional data distribution. The coarse-grained parallelization was achieved by using the CAPTools [4] parallelization tool to generate a message-passing version with a one-dimensional domain decomposition in the z-dimension. For the MLP implementation communications are handled by usage of the shared memory buffer. The OpenMP direc-tives were inserted by using CAPO for parallelization on the y-dimension. Since the data is distributed in the z-dimension, the call to z_solve requires communi-cation within a parallel region as depicted in Figure 5. The routine y_solve contains data dependences on the y-dimension, but can be parallelized by pipelined thread execution.
Figure 5: Code fragment of the hybrid routine z-solve.
In summary, we use three different parallel algo-rithms for the BT benchmark. SMA and MPI use the same algorithm, but different means of data transfer. MLP and MPI/OpenMP use the same algorithm, but different means of data transfer. The nested OpenMP implementation uses a third algorithm.
4.2. Performance Indices
We will use the following abbreviations for the vari-ous programming models under consideration:
• MPI: Process level parallelism employing mes-sage passing based on MPI [10].
• SMA: Process level parallelism employing shared memory buffers for data transfer.
• OpenMP: Thread level parallelism based on OpenMP [13].
• MLP: Hybrid process and thread level parallel-ism employing SMA and OpenMP.
• MPI/OMP: Hybrid process and thread level parallelism employing MPI and OpenMP. In order to compare and quantify the performance differences, we consider the following metrics, not all of which are applicable to all programming models. By useful instructions we mean instructions not spent on thread management, process synchronization, and communication.
• MEM: Number of L2 cache misses while exe-cuting useful instructions reported in millions.
• INS: Number of useful instructions reported in billions.
• COM: Percentage of time spent in MPI routines for point-to-point or global communication.
• SYN: Percentage of time spent in process syn-chronization. This includes the time in MPI barriers and wait operations and time spent in MLP synchronization routines.
• OMP: Percentage of time spent in OpenMP overhead, i.e. thread fork and join, OpenMP thread synchronization, user introduced syn-chronization for pipelined thread execution, thread idle time.
These simple metrics will not give a detailed expla-nation of a particular performance problem. They will, however, give hints on where further analysis is re-quired.
4.3. Comparing the Performance of Different
Paradigms
We ran the various implementations of BT on an SGI Origin 3000. We used the SGI compiler for all implementations. For the nested OpenMP code we used the NanosCompiler [3], which is based on the SGI
!$omp parallel !$omp do do j=1,ny call receive() do k=k_low,k_high do i=1,nx rhs(i,j,k)= … rhs(i,j,k-1) enddo enddo call send() enddo
compiler, but supports nested OpenMP parallelism. All our timings were obtained in batch mode with the ap-propriate number of CPUs. The CPUs were reserved for the duration of the run by the batch queuing system. In Figure 6 we show the execution time for various combinations of processes and threads for our hybrid implementations and for different choices of thread groupings in the nested OpenMP implementation. For the hybrid codes we indicate the nesting level as NPxNT, where NP is the number of processes and NT is the number of threads. For the nested OpenMP code we indicate the nesting level as NGxNT, where NG is the number of groups of threads and NT is the number of threads within one group.
The speedup from 1 to 144 CPUs for all implemen-tations is shown in Figure 7. For the hybrid codes and the nested OpenMP code we report the best times over various nesting levels. We calculate the speedup by the ratio of the execution time on N CPUs and the fastest time achieved on 1 CPU. The fastest single CPU run was achieved with the OpenMP code. Therefore we report a speedup of the MPI implementation on 1 CPU as 0.5, indicating that the MPI code takes twice as long as the OpenMP code on 1 CPU. As can be seen, the scalability of the different implementations varies widely. The process level parallel implementations outperform the hybrid and OpenMP implementations. To understand why, we conduct a detailed performance analysis using Paraver/OMPItrace. For our analysis we obtained traces for all implementations of BT discussed in Section 4.1.
We traced graduated instructions and L2 cache misses. We collected the traces with and without hard-ware counters. Tracing without hardhard-ware counters has minimal probe perturbation and should report detailed patterns of the temporal behavior of the application. Tracing with hardware counters introduces more over-head but provides extra detailed information. Based on the traces we can display performance views and com-pute the statistics. Statistics that do not depend on the
hardware counters are computed on the trace without counters to reduce instrumentation overheads.
Speedup BT Class A (64x64x64) 0 20 40 60 80 100 120 140 1 4 16 49 64 81 100 121 144 Number of CPUs S p e e dup MPI SMA MLP MPI/OpenMP Nested OpenMP
Figure 7: Speedup for different paradigms.
We chose a run with 100 CPUs and the class A prob-lem size for our investigations. The probprob-lem size for class A is 64 grid points in each spatial dimension. In Table 1 we summarize the statistics for the different benchmark implementations, which were obtained by applying the Paraver analysis module. We applied the analysis module to the state view in order to determine the statistics COM, SYN, and OMP. We used the Paraver analysis module to calculate useful instructions and L2 cache misses.
First we want to determine why the SMA code scales better than the MPI code, despite usage of the same algorithm. As can be seen from Table 1 SMA spends less time in communication and synchronization compared to MPI.
MPI SMA MPI/
OMP
MLP Open MP
MEM .45 0.6 5.1 3.8 1.
INS 1.2 1.4 1.4 1.5 1.3 COM 14% N/A 7% N/A N/A SYN 25% 12% 63% 5.5% N/A OMP N/A N/A 16% 65% 56%
Table 1: Performance metrics for a 100 CPU run.
In Table 2 we report the average duration per call for the four main time consuming routines.
x_solve y_solve z_solve rhs MPI 13.844 13.189 13.877 19.240 SMA 10.315 10.663 11.086 7.705
Table 2: User function timings (in ms) inclusive MPI and MLP calls.
BT Class A on 100 CPUs 0 5 10 15 20 25 30 35
MLP MPI/OpenMP Nested OpenMP
Programming Paradigm Tim e in seconds 100x1 50x2 25x4 10x10
We also obtained a view of the trace showing the time spent in the user functions, but taking out the time spent in MPI calls. These timings are reported in Table 3.
x_solve y_solve z_solve rhs MPI 9.715 10.098 10.723 4.343 SMA 9.808 10.123 11.003 7.024
Table 3: User function timings (in ms) exclu-sive MPI and MLP calls.
For the MPI implementation routine rhs is communication bound as inferred from the difference in the total duration versus the time it takes outside of MPI calls. The routine exchanges boundary data before each sweep. Each process performs a series of
MPI_Isend and MPI_Irecv followed by an
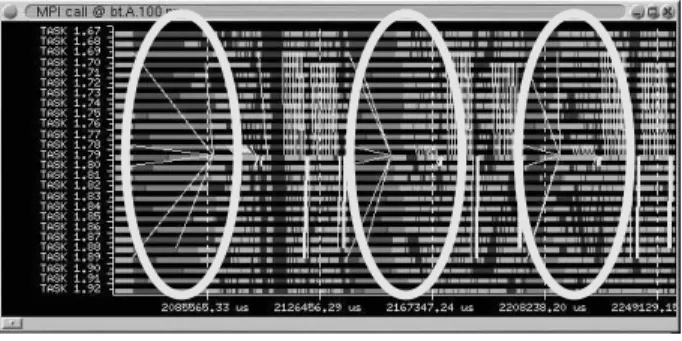
MPI_Waitall. In Figure 8 we show the timelines of MPI calls for a 100 process run. A striking effect is that the long time in MPI is not just in the MPI_waitall. The view of the MPI routines exposes some very long calls to MPI_Isend and MPI_Irecv. They corre-spond to marked dense areas in Figure 8. This shows that even if one thinks that the use of non-blocking MPI routines decouples communication and synchronization it does not seem to be true. The duration of a given call depends on whether the matching call has been posted. In case of many communication requests there is the possibility of contentions in the internals of the MPI library. The result is, that a process posting several con-secutive calls may be delayed in one of them, thus delaying the posting of successive calls. This effect propagates through the process dependence chain of the application in intricate ways.
The SMA implementation does not suffer from this effect. Data transfer takes place within the user code, by reading and writing the shared memory buffer. This increases the computation time slightly, but yields better scalability and better performance.
Now we can address the question of what limits the scalability of the multilevel parallel codes. We apply the view of useful computations described in Section 3. Based on this view it is possible to obtain the percent-age of time spent in useful instructions within each user routine. As an example we will demonstrate a detailed analysis of the MLP code and then summarize our find-ings for the other multilevel implementations.
For BT MLP we computed that only 12% of the time within routine rhs is spent in useful computa-tions. For routine x_solve it is 46%, for y_solve it is 31% and for z_solve it is 14%. In Figure 9 we show the view of useful computations for an MLP run on 10 processes with 10 threads each. This is not the
combination that scales best, but it is best suited to point out the performance issues. The dark area repre-sents time spent in useful instructions and light area indicates non-useful time. The initial part in Figure 9 represents parallel regions inside routine rhs. Analyz-ing the time behavior shows that parallel computations tend to get blocked for periods of time in the order of 10ms or multiples of that. A look at the view of instruc-tions executed by the threads in those intervals shows a very low number of instructions executed by at least one thread. We interpret this as the thread having been preempted. Until it regains a CPU, other threads get blocked at the barriers between OpenMP work sharing constructs.
The denser regions of useful computations corre-spond to the single parallel region in x_solve. This is the second marked area in Figure 9. Its behavior in terms of duration is fairly imbalanced and can be attrib-uted to effects like data placement and memory access time.
Routine y_solve has two major parallel regions; the second one containing pipelined thread execution within one MLP process. The thread pipeline within each process contributes to the overall poor percentage of useful computation in this routine. Routine
y_solve corresponds to the third marked area in Fig-ure 9.
The last marked area corresponds to the useful com-putations of routine z_solve. It contains a parallel region where every OpenMP thread uses signal and wait routines to synchronize with threads in other proc-esses. This creates a pipeline from the first to the last process. A time analysis shows a second pipeline with opposite direction, resulting in a V-shaped pattern of useful computation. These dependencies between threads contribute to the very low percentage of useful computation in this routine.
Figure 8: MPI calls in BT MPI on 100 proc-esses.
The analysis results for the other implementations of BT can be summarized as follows: The MPI/OpenMP implementation employs the same algorithm, but it does not show the problem of CPU preemption in rou-tine rhs that we identified in its MLP counterpart. The interaction of OpenMP and MPI causes less OS side effects than MLP. However, in this case it is the MPI library that causes problems. The MPI calls within the parallel region of routine z_solve have a low MIPS value. This low value can be explained by the process being preempted. We have also observed migration of threads during the whole run of the MPI/OpenMP code. This means that threads changed from one CPU to an-other during the execution of the benchmark. Even though a set of CPUs is reserved by the batch system, the OS scheduling can be such that threads belonging to the same job switch CPUs during the execution of the application. For the MLP code we observed thread mi-gration only during the initial phase of program execution. We inserted a system call into the MPI/OpenMP code which binds each thread to a particular CPU within the subset reserved by the batch system. This reduced the execution time quite dramati-cally and increased the performance to close to that of the MLP version.
We conclude that the fine grain parallelism intro-duced by hybrid parallelization leads to interactions
between OS activities, such as system interrupts, and the program synchronization operations. The impact of these interactions on performance increases with the number of processors. The blocking of processes maybe be caused by OS interrupts or context switches, but may also be done by the OpenMP or MPI library in order to support single and multi-user mode on the sys-tem. The behavior is dependent on the implementation of the run time libraries for parallel execution.
The OpenMP implementation has the best perform-ance for a single CPU run and has the lowest memory requirements. The implementation does not use pipe-lined thread execution but rather places the directives on the first dimension in some of the loops. The outer loop of the Class A BT benchmark has 62 iterations. Clearly, single level OpenMP parallelization will not scale beyond 62 threads. Nesting of OpenMP directives allows distributing the work in two dimensions thereby providing work for more threads.Employing 25 groups of 4 threads yielded the best performance with an aver-age of 44% of time spent in useful computations per iteration. All other combinations yielded a lower per-centage of useful time. The overhead time is mostly spent in idle time, not so much in synchronization and fork/join operations. The NanosCompiler provides its own thread library, which handles thread synchroniza-tion and scheduling efficiently. The thread idle time can
probably be reduced by optimizing the distribution of the loop iterations onto the threads. The NanosCom-piler provides clauses to allow detailed mappings of the iteration space onto threads, but in our study we have only used a simple block distribution.
5. Related Work
There are many published reports on the comparison of different programming paradigms. We can only name a few of them. In [19] Taft discusses the perform-ance of a large CFD application. He compares the scalability of message passing versus MLP. A compari-son of message passing versus shared memory access is given in [15] and [17]. The studies use the SGI SHMEM library for SMA programming. A discussion of nested OpenMP parallelization is given in [7]. Our current work differs from these reports in that we are exploiting performance analysis tools to obtain information about program behavior.
There are a number of commercial and research per-formance analysis tools that have been developed over the years. An example for a commercial product is Vampir [21], which allows tracing and analysis of OpenMP, MPI, and hybrid MPI/OpenMP applications. TAU (Tuning and Analysis Utilities) [20] was devel-oped at the University of Oregon. It is a freely available set of tools for analyzing the performance of the C, C++, Fortran and Java programs. Paraver provides more extensive analysis capabilities than other visuali-zation tools. The simple but complete trace format of Paraver allows to easily map new parallel paradigms like MLP in the Paraver hierarchical object model. To our knowledge neither of the above mentioned tools support the MLP programming paradigm.
6. Conclusions
We have used the Paraver/OMPItrace performance analysis system to conduct a detailed performance analysis of five different implementations of the BT NAS Parallel benchmark employing different pro-gramming paradigms. We have demonstrated how the performance analysis tool was used to calculate per-formance statistics and to expose patterns in the traces, which helped to identify performance problems.
A first conclusion of our study is that implementa-tion issues in the run time library and their interacimplementa-tion with the OS are very relevant to the total application performance. The hybrid implementations of our benchmark were particularly affected by the interaction of the run time libraries for process and thread paral-lelization. The interaction of these libraries with the batch system also played and important role.
We also observed several issues that are related to the programming model itself rather than the underly-ing run time library. The strength of the purely process based model lies in the fact that the user has complete control over process synchronization and data distribu-tion. When employing OpenMP this it not the case anymore.
The scalability of our hybrid codes suffered from the fact that process level communication was delayed until the OpenMP barrier synchronization points. The OpenMP required barriers also increases the overhead for nested OpenMP parallelism. It requires the nesting of parallel regions which introduces many barrier syn-chronization points into the outer region. This raises the question whether the OpenMP standard should be ex-tended to allow nested parallel loops without extra parallel regions.
The second issue concerns workload distribution. The coarse-grain well-balanced distribution of work, which yields the good scalability for the SMA imple-mentation, is not supported by OpenMP directives. It is possible to mimic the process level parallelization, by assigning specific loop bounds to each thread manually. However, this would defeat the advantage of OpenMP which is the ease of the programming paradigm. We are currently working with the NanosCompiler group to identify suitable OpenMP extensions to address this issue.
Finally we remark that the hybrid parallelization ap-proach is suitable for large applications with an inherent multilevel structure, such as multi-zone codes. For codes like the BT benchmark, where parallelization occurs only on one or more of the spatial dimensions, the use of either process level parallelization or OpenMP is appropriate.
Acknowledgements
This work was supported by NASA contracts NAS 2-14303 and DTTS59-99-D-00437/A61812D with Computer Sciences Corporation/AMTI, by the Spanish Ministry of Science and Technology, by the European Union FEDER program under contract TIC2001-0995-C02-01, and by the European Center for Parallelism of Barcelona (CEPBA).
References
[1] D. Bailey, J. Barton, T. Lasinski, and H. Simon (Eds.), “The NAS Parallel Benchmarks,” NAS Technical Report RNR-91-002, NASA Ames Re-search Center, Moffett Field, CA, 1991.
[2] D. Bailey, T. Harris, W. Saphir, R. Van der Wijngaart, A. Woo, and M. Yarrow, “The NAS Parallel Benchmarks 2.0,” NAS Technical Report
NAS-95-020, NASA Ames Research Center, Moffett Field, CA, 1995. http://www.nas.nasa.gov/Software/NPB.
[3] M. Gonzalez, E. Ayguade, X. Martorell and J. La-barta, N. Navarro and J. Oliver. “NanosCompiler: Supporting Flexible Multilevel Parallelism in OpenMP”, Concurrency: Practice and Experience. Special issue on OpenMP. vol. 12, no. 12. pp. 1205-1218. October 2000.
[4] C.S. Ierotheou, S.P. Johnson, M. Cross, and P. Leggett, “Computer Aided Parallelisation Tools (CAPTools) – Conceptual Overview and Perform-ance on the Parallelisation of Structured Mesh Codes,” Parallel Computing, 22 (1996) 163-195. http://captools.gre.ac.uk/
[5] H. Jin, M. Frumkin, and J. Yan, “The OpenMP Implementations of NAS Parallel Benchmarks and Its Performance”, NAS Technical Report NAS-99-011, 1999.
[6] H. Jin, M. Frumkin and J. Yan. “Automatic Gen-eration of OpenMP Directives and Its Application to Computational Fluid Dynamics Codes,” in Pro-ceedings of Third International Symposium on High Performance Computing (ISHPC2000), To-kyo, Japan, October 16-18, 2000.
[7] H. Jin, G. Jost, J. Yan, E. Ayguade, M. Gonzalez, X. Martorell, “Automatic Multilevel Paralleliza-tion Using OpenMP”, 3rd European Workshop on OpenMP, Barcelona, Spain, Sep. 2001.
[8] R.D. Loft, S. J. Thomas, J.M. Dennis, “Terascale Spectral Element Dynamical Core for Atmospheric General Circulation Models”, Proceeding of Su-percomputing, Denver, Nov. 2001.
[9] D. J. Marvripilis, “Parallel Performance Investiga-tions of an Unstructured Mesh Navier-Stokes Solver”, Technical Report NASA/CR-2000-210088, ICASE No.2000-13, ICASE, Hampton, Virginia, 2000.
[10] MPI 1.1 Standard, http://www-unix.mcs.anl.gov/ mpi/mpich.
[11] MPI–2: Extensions to the MPI Interface, http://www-unix.mcs.anl.gov/mpi/mpich.
[12] OMPItrace User’s Guide,
https://www.cepba.upc.es/ paraver/manual_i.htm. [13] OpenMP Fortran Application Program Interface,
http://www.openmp.org/.
[14] Paraver, http://www.cepba.upc.es/paraver.
[15] H. Shan, J. Pal Singh, “A comparison of MPI, SHMEM, and Cache-Coherent Shared Address Space Programming Models on a Tightly-Coupled Multiprocessor”, International Journal of Parallel Programming, Vol. 29, No. 3, 2001.
[16] A. Serra, N. Navarro, and T. Corts, “DITools: Ap-plication-level support for Dynamic Extension and Flexible Composition”, Proceedings of the USENIX Annual Technical Conference, June 2000.
[17] H. Shan, J. Pal Singh, “Comparison of Three Pro-gramming Models for Adaptive Applications on the Origin 2000”, Journal of Parallel and Distrib-uted Computing 62, 241-266, 2002.
[18] J. Taft, “Achieving 60 GFLOP/s on the production CFD code OVERFLOW-MLP,” Parallel Comput-ing, 27 (2001) 521.
[19] J. Taft, “Performance of the OVERFLOW-MLP Code on the NASA Ames 512 CPU Origin Sys-tem”, NASA HPCCP/CAS Workshop, NASA Ames Research Center, February 2000.
[20] TAU: Tuning and Analysis Utilities, http://www.cs.uoregon.edu/research/paracomp/tau/ [21] VAMPIR User’s Guide, Pallas GmbH,