Work in progress: Not for citation without authors’ permission
Health human resources planning and the
production of health:
Development of an extended analytical framework
for needs-based health human resources planning.
Stephen Birch, D. Phil
1Gail Tomblin-Murphy, Ph. D.
2Linda O’Brien-Pallas, Ph. D.
3George Kephart, Ph.D.
2Rob Alder, Ph.D.
41. McMaster University, Hamilton, Ontario 2. Dalhousie University, Halifax, Nova Scotia 3. University of Toronto
4. Med-Emerg International Inc., Toronto
Abstact:
Traditional approaches to health human resources planning emphasize the role of demographic change on the needs for health human resources. Conceptual frameworks have been presented that recognize the limited role of demographic change and the broader determinants of health human resource requirements. Nevertheless, practical applications of health human resources planning continue to base plans on the size and demographic mix of the population applied to simple provider or population-utilization ratios. In this paper an analytical framework is developed based on the production of health care services and the multiple determinants of health human
resource requirements. In this framework attention is focused on estimating the ‘flow’ of services required to meet the needs of the population that is then translated into the required ‘stock’ of providers to deliver this ‘flow’ of services. The requirements for human resources in the future is shown to depend on four elements: the size and demographic mix of the population (demography), the levels of risks to health and morbidity in the population (epidemiology), the services deemed appropriate to address the levels of risks to health and morbidity (standards of care), and the rate of service delivery by providers (productivity). Application of the framework is illustrated using hypothetical scenarios.
Introduction:
Health Human Resources Planning (HHRP) is aimed at having the right number of people with the right skills in the right place at the right time to provide the right services to the right people (Birch 2002). It involves comparing estimates of future requirements for and supplies of human resources and considering policy options for addressing any differences between requirements and supplies (Lomas et al. 1985). The focus of HHRP to date has been on the impact of demographic change on individual health care professions, i.e., the effect of an aging population on the requirements for particular health care providers, and the effect of an aging workforce on the capacity to
meet requirements (e.g., Denton et al. 1993, 1994, 1995, Ryten 1997, Newton and Buske 1998, Kazanjian 2000, Kazanjian et al 2000, Shipman et al. 2004) The general approach followed has tended to focus exclusively on particular provider groups and consist of estimating shortfalls or surpluses in those groups and calculating changes in the sizes of training programmes required to eliminate any such imbalances in human resources. As a result, HHRP has occurred largely in isolation of, or separately from, matters relating to other aspects of health care policy and population health (Birch et al. 2003). In this way, the research questions that HHRP has aimed at addressing have usually been unclear or poorly defined (Birch et al 1994, Lavis and Birch 1997). Research questions about ‘how many health care providers are required’ need to be developed and refined to incorporate the objectives for the use of health care providers and the contexts in which they will be used (i.e., how many providers are required to do what, and how, for who and under what circumstances?).
The requirements for providers are endogenously determined through the political or social choices that underlie the health care system being studied (Markham and Birch 1997). Systems that ration access to health care according to ability and willingness to pay will have different requirements for providers than systems that ration access according to relative needs for care, even where the levels and distribution of health are the same. Funding arrangements that influence the production of health care (the level and mix of different resources) will affect the requirements for a particular type of provider. Only where the social and political choices about the access to and delivery of care are explicit, can scientific methods be used systematically to derive the requirements for health care providers in a particular population.
In the absence of clear, contextualised research questions it is not surprising that most studies have focussed on the current numbers and demographic profiles of providers in the context of the current size and demographic mix of the population (i.e., provider to population ratios, in some cases adjusted for age and gender of populations and/or providers) applied to the future projected population. As a result HHRP has been largely an exercise in demography based on implicit assumptions that population age structure
determines the service needs of the population and that the age of providers determines the quantity of care provided (Birch 2002). By failing to incorporate health care needs and service provision into the analytical framework, it further assumes that the
relationships between age and needs, and between the numbers of providers and the quantity of services, are exogenous, independent of other factors and hence constant over time. However, if epidemiology and production processes are not ‘fixed’ then HHRP based on these assumptions will estimate human resource requirements inaccurately.
For example, much attention has been given to the challenges of an ageing population for health care systems. Because health risks differ by age and, after childhood, generally increase with age, an older population will generally have greater needs for care than a younger population all other things equal (Eyles et al. 1991). Denton and Spencer (2000) show that even on the assumption that age specific needs of the population remain the same over time (i.e., epidemiology constant) the impact of aging on health care expenditures will be modest and more than offset by savings arising from the impact of demographic change in other areas of government expenditures. However an aging population has other implications for HHRP since it is itself an indication of changes in age-specific needs for care. Observed cross sectional or ‘point in time’ differences in age specific needs cannot be used as a basis for modelling the needs of a future population. Health risks and hence the needs for care change over time. Life expectancies have increased over time at all ages (Evans 1994). Dramatic
improvements in health status have been reported over the last 10-15 years (Roos et al. 2001). Similarly it has been argued that over time morbidity in populations has been increasingly ‘compressed’ into the later years of life (Fries 1980). Not only have years been added to life but also life to years. In terms of the production of health in
populations, the effect of age on health has changed over time, i.e., 65 year olds on average can expect to be healthier, and hence have less health care needs, than 65 year olds on average 20 years ago. Hence models for HHRP need to embrace the dynamic nature of the health care needs of populations.
In the same way that need per capita population is not constant, the service output per provider will vary among providers and over time. For example, nurses do not provide care alone. Instead they use their skills in combination with other human and non human resources to provide services to meet the needs of the population. The average rate of service delivery per nurse will depend on the availability and use of other resources (Birch et al. 2003). Similarly, innovation involves the identification of new ways of production aimed at increasing the productivity of resources (i.e., more output from a given level or combination of resources). Improvements in the productivity of human resources provide a source of increased output in the health care sector. For example Gray (1982) found that changes in the delivery of dental care services in the UK were associated with substantial increases in dentist productivity. Similarly the
introduction of day case surgery increased the number of cataract replacements that an ophthalmology team can provide per time period. Sources of improvements in
productivity are not confined to major technological innovations. A family physician who manages a fixed roster of patients continuously over time will increase productivity since the average age, and hence the risks to health and health care needs increases over time. The human resources required to meet the needs of a population will therefore be dependent on the role human resources play in serving needs and the other resources available to use in combination with human resources in providing services.
Failure to identify changes in needs and productivity undermines HHRP processes by overestimating HHR requirements and the costs of health care services. Newton and Buske (1998) suggested that Canada faced a possible future shortage of physicians based on an estimated 31% reduction in the estimated physician-population ratio over the next 25 years. However if age and gender specific needs were to be reduced by 1% per annum and average productivity of physicians increased by 1% per annum the
physician-population ratio, after adjustment for changes in activity level and changes in needs, would increase by 27% over the same period! Hence current plans for physician training would be associated with more than enough physicians to maintain levels of services per capita after allowing for aging of the population. Hence, consideration might need to be given to reductions in, as opposed to expansion of training programmes. Shipman et al
(2004) note that the number of general pediatricians in USA will expand by nearly 64% by the year 2020 compared to an increase of only 9% in the child population. A
substantial increase in the physician-population ratio. The authors note that if
pediatricians are to maintain workloads they may need to “provide expanded services to the children currently under their care, expand their patient population to include young adults, and/or compete for a greater share of children currently cared for by
nonpediatricians”. No consideration is given to the appropriateness of these required changes to maintain workloads from a population perspective. Maybe instead of focussing attention on maintaining provider workloads consideration could be given to reducing the number of practicing pediatricians and/or the size of pediatric training programmes. Birch and Maynard (1985) previously noted the risk of planning for too many providers as a result of failing to take account of changes in needs and provider productivity in an appraisal of UK government plans to increase admissions to dental schools.
The focus of this paper is to develop existing HHR frameworks in order to relax the strict assumptions about epidemiology and production embodied in current practice of HHRP in order to accommodate changes in the levels and distribution of health care needs in the population and changes in levels of productivity of health care providers.
The needs-based analytical framework:
The purpose of the analytical framework is to provide a link between principles identified in theoretical models and the application of these principles in health human resources policy development. The theoretical basis of the analytical framework
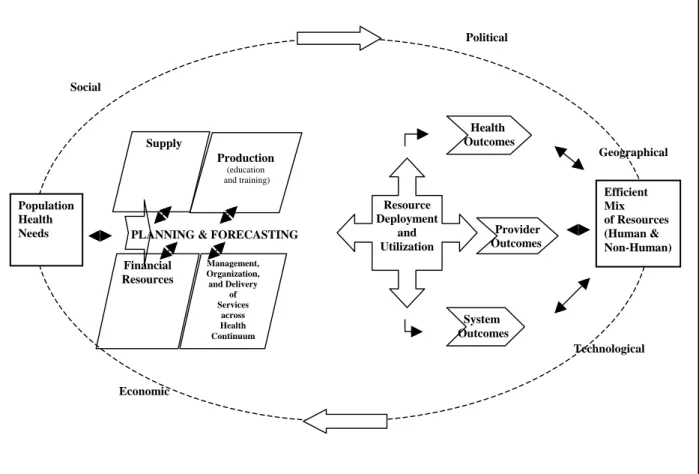
developed here is the HHRP conceptual model presented in O’Brien-Pallas et al. (2001a) (see figure 1).
Population Health Needs Geographical Political Efficient Mix of Resources (Human & Non-Human) Technological Economic Production (education and training) Management, Organization, and Delivery of Services across Health Continuum Health Outcomes Provider Outcomes System Outcomes PLANNING & FORECASTING
Resource Deployment and Utilization Financial Resources Supply Social
Figure 1: Health Human Resources Conceptual Model:
This conceptual model identifies the constructs that influence the requirements for and supply of human resources (population health needs, education and training, supply of providers, organisation of work and production and the prevailing contexts in which all these constructs are experienced) and the pathways, both direct (independent) and
indirect (interactions between influences), through which these influences operate. In particular the framework emphasizes that
• HHRP occurs within, as opposed to independent of, health care planning, and
• Health care planning occurs within, as opposed to independent of, other public policy planning.
There are a number of key features of this model:
1. Evidence-based approaches to needs:
Needs cannot be assumed to be indicated by (or to correlate with)
measures of service delivery (i.e., utilization measures), expenditures on care (i.e., demand measures) or availability of providers (i.e., supply measures) (Birch et al. 1996). Need is measured independently of these other health care constructs.
2. The ‘derived’ nature of requirements:
Requirements for health human resources are derived from the need for health care services that health human resources produce.
3. The production of health care:
Health care services are produced from the use of a range of health care inputs that include both human and non-human resources.
4. The contextual nature of requirements:
The production of health care services and the use of human resources in the production of those services occur in prevailing social, cultural, economic and political contexts. These contexts are largely determined outside of the immediate remit of human resources policy makers and planners. However the particular contexts will define the opportunities and constraints within which HHRP occurs.
5. The range of policy levers:
The capacity of training programmes is just one of many policy levers available to human resources policy makers aiming to respond to estimated gaps between future human resource requirements and supplies.
The model incorporates the essential elements of HHRP in a way that captures the dynamic interplay among factors that have previously been conceptualized as
separate and independent. The framework considers the prevailing levels of supply in the context of educational policies as well as the prevailing social, political, geographic, economic contexts.
The analytical framework consists of two independent components: provider supply and provider requirements.
Provider Supply
This part of the analytical framework asks ‘How many providers are (or will be) available to deliver health care services to the population?’ Supply can be seen as the ‘outcome’ of two determinants;
• The stock of individuals Mij, representing the number of providers in each age and sex group who are potentially available to provide health care services, and
• the flow of activities, Lsij, generated from the stock, representing the quantity of
input (e.g., time spent in the production of services).
The flow of activities depends on (a) the proportion of the current stock, lij, that is
active in the provision of health care (i.e., the participation rate) and (b) the level of activity, kij, of those active in the provision of health care (i.e., the activity rate). Hence
[ ] s ij ij ij ij ij ij L = l × ×k M
∑
∑
(1)If a full time equivalent (FTE) provider contributes W hours of labour per year then the provider supply Ns is given by
s ij ij ij ij ij ij s L l k M N W W ⎡ × × ⎤ ⎣ ⎦ =
∑
=∑
(2)Both participation and activity rates represent policy levels for HHR policy makers and hence alternative or complementary approaches for changing provider supply Ns.
In addition to changes in the flow of activities, the size of the stock in age group i and gender j at time t, Mtij, also changes over time. This is the result of new entrants to the
stock at time t, Itij (inflows of providers from other regions and other countries together
with new graduates within the region) and those leaving the stock, Otij(outflows of
providers to other regions and other countries, retirements and deaths among providers). Hence -1 t t t t ij ij ij ij ij ij t M =
∑
M =∑
⎡⎣M + −I O ⎤⎦ (3)where Mt-1ij is the stock of providers by age and gender in the previous time period, t-1.
This provider supply component is a common element of most approaches to HHRP research. However, unlike previous models, in this framework the levels of participation and activity are allowed to vary over time. Hence the supply of FTE providers at time t,
Ns,t is given by st t t t ij ij ij ij ij ij st t t L l k M N W W ⎡ × × ⎤ ⎣ ⎦ =
∑
=∑
(4)Provider Requirements
This part of the analytical framework asks ‘How many providers are required to ensure sufficient ‘flow’ of health care services to meet the needs of the population?’ Traditional approaches to estimating the required number of providers Nrhave largely been based on an implicit analytical framework based on just two elements – the demography and the current level of providers, i.e.,
t ij rt rt t ij ij ij ij ij N N N P P ⎡⎛ ⎞ ⎤ ⎢ ⎥ = = ⎜⎜ ⎟⎟ × ⎢⎝ ⎠ ⎥ ⎣ ⎦
∑
∑
(5)In this way the provider requirement is simply a weighted average of the size of different age-sex groups in the population irrespective of any changes in needs within population subgroups and changes in productivity among provider groups. In some cases the provider-population element is replaced by a utilization-population element, Qij/Pij
also assumed to be constant. Hence
t t ij ij rt rt t ij ij ij ij ij ij N Q N N Q P P ⎡⎛ ⎞ ⎛ ⎞ ⎤ ⎢ ⎥ = = ⎜⎜ ⎟ ⎜⎟ ⎜× ⎟⎟ × ⎢⎝ ⎠ ⎝ ⎠ ⎥ ⎣ ⎦
∑
∑
(6)However the link between services and providers , N ij/Qij, i.e., the productivity of providers, is also assumed to be constant over time. As a result the estimated
requirements for providers is determined entirely by demographic factors applied to existing levels of utilization per capita and output per provider, i.e.,
rt rt t
ij ij
ij ij
N =
∑
N = × ×a b∑
P (7)It is important to note that the need for services does not appear in equations (5) to (7). Yet, as argued above, both needs and the service requirements to meet needs (and hence the providers required to satisfy these service requirements) are dynamic concepts. Hence if Hijrepresents the average level of needs of individuals in age group i and gender j then the required number of providers, Nrt, can be presented as
t t t ij ij ij rt t ij ij ij ij ij N Q H N P Q H P ⎡⎛ ⎞ ⎛ ⎞ ⎛ ⎞ ⎤ ⎢ ⎥ = ⎜⎜ ⎟ ⎜⎟ ⎜× ⎟ ⎜⎟ ⎜× ⎟⎟ × ⎢⎝ ⎠ ⎝ ⎠ ⎝ ⎠ ⎥ ⎣ ⎦
∑
(8)Where each expression on the right hand side of (8) represents a separate determinant of the provider requirements:
Demography: Pij, represents the demographic determinant of provider requirements.
This captures the size and age distribution of the population, and changes to the distribution over time as a result of population aging, changes in migration, birth and death rates.
Epidemiology: The element Hij/Pij introduces the levels and distribution of needs in the
population explicitly as a determinant of provider requirements into the analytical framework. In this way different levels of need are incorporated into the estimation independent of the demographic mix in the population, Pij.
Level of service: Qij/Hijrepresents a level of service determinant of provider
requirements. If we want to increase service provision to a particular group, say by instituting more frequent screening of various risk factors, this increases Qij/Hij, the service weightapplied to the population of diabetic patients. With all other things equal, this increases the required number of providers.
Productivity: The expression Nij/Qij represents the inverse of the average level of
productivity of providers serving population group Pij. Productivity depends on a variety
of factors, including the intensity of work (proportion of paid hours given to patient care), how work is organized, technological inputs, and inputs of other types of professionals.
This enhanced, needs-based analytical framework estimates the number of health care providers required to meet the health care needs of each age and sex group in the population. These estimated requirements are summed over all age and gender groups to generate the total provider requirements.
Because levels of activity vary among providers (e.g., part-time, full-time, overtime) requirements are measured in activity-standardised units providers (i.e., FTE providers), the same units used to measure provider supply in (2). Although older populations may require more provider inputs (e.g., hours of care) to produce the same service output (i.e., address the same health condition), this variation in resource intensity by population age-sex group can be incorporated in the framework in terms of a severity or complexity adjustment to the levels of service component. Hence, in terms of equation (8) it is reasonable to treat Nij/Qij as invariant across population age-sex groups where incorporates some measure of resource intensity adjustment. In this way equation (8) can be expressed as ij t t t ij ij rt t ij ij ij Q H N N P Q H P ⎡⎛ ⎞ ⎛ ⎞ ⎤ ⎛ ⎞ ⎢ ⎥ = ⎜ ⎟ × ⎜⎜ ⎟ ⎜⎟ ⎜× ⎟⎟ × ⎢ ⎥ ⎝ ⎠
∑
⎣⎝ ⎠ ⎝ ⎠ ⎦ (9)Hence, provider requirements at time t, Nrt, can now be seen as the result of two empirical components – the production component (N/Q)t, and the need for services component covering the three separate determinants of level of service, epidemiology and
Applying the framework: Simulation Model
A simulation approach is used to apply the analytical framework to available data. The purpose of this approach is not to predict the future but to integrate knowledge of different components of the conceptual model in order to improve understanding of the dynamics of the system and analyse strategies and policies to address human resource problems. In particular the simulation results emerge from the interactions of different components of HHRP and provide an evidence-base for the relative impact of different policies over time. In this way the simulations provide insights on how to change the future to address current and emerging problems.
The simulation model specifies the mathematical relationships for the components of the analytical framework. The model is based on estimating and comparing provider supply, based on simulation modules for training and supply of labour components, and provider requirements, based on simulation modules for production of and needs for services components.
Supply of labour:
This estimate is based on the following factors.
The current stock of providers: The number of individuals in the existing population that are potentially available to provide health care services. This includes all individuals with the appropriate license or registration for a particular health care profession
irrespective of whether the individual is currently active in the production of health care services. The number of providers by age is projected forward in time based on age-specific entry and exit rates.
Entry to the stock: New entrants consist of new graduates of training programs, and entrants to the region from other places (providers migrating from other provinces or
other countries). The volume and source of entrances varies by age. At younger ages entry is dominated by new graduates while at older ages migration is the primary source of entry. Entry rates are estimated from registration data. The graduate entry rate by age is the output of the training module (see below). In-migration is also masured by the number of ‘migrant providers’ entering the stock in a particular year expressed as a proportion of current stock for each age group.
Exits from the stock: Exits consist of deaths and retirements among providers, those moving to positions in other jurisdictions and those who allow their registration to lapse as they pursue other occupations or activities. The volume and type of exits vary by age. Because exit rates are estimated from registration data which do not normally record reason for exit, sources of exit are not identified in the simulation. However changes in particular sources of exit can be simulated by adjusting exit rates at different ages. For example, adjusting exit rates over age 55 can be used to simulate alternative retirement scenarios.
Because the rates of entry and exit generally differ depending on age, the size and
characteristics of the future stock is a function of the initial age distribution of the stock. In the short-term, the age-distribution of a stock can exert a very powerful influence on growth or reduction in stock over time. For example, rates of exit are generally larger at older ages than younger ages, primarily due to retirements. Hence total losses will depend primarily on the proportion of the stock in those age groups with the highest incidence of retirement. Recent concerns have been expressed with regards to the large concentration of the stock of nurses in the older age groups (i.e., over age 55) because of the implications that has for exit rates in the immediate future.
The flow of services from the stock: The simulation defines the stock of providers as the population eligible to provide services, regardless of their employment status or activity level. Participation rates are based on registration data about employment status and type of activity (i.e., distinguishing between those employed in direct care provision and those employed in other activities, e.g., management or research involving no direct care
provision). Among that proportion of the stock that participates in direct care provision, the distribution of hours worked is used as a measure of activity rates. The activity rate embodies both differences in ‘contracted’ hours (e.g., part time, full time, overtime) and the variation in earned hours within any ‘contracted hours’ group (i.e., sickness and other absences from work). Changes in the distribution of participation and activity of the provider stock provide important policy options for changing provider supply.
The Training Module:
The training module focuses on estimating the number of graduates entering the provider stock. The number of ‘seats’ in a training programme is just one of several determinants of the number of new graduates. In addition, the length of the training programme (i.e., the distribution of years to graduation among cohorts of students), the attrition rate of the programme and the rate of entry to the profession of new graduates (e.g., graduates may take up positions as health care providers in other jurisdictions, and thus not enter the provider stock for the jurisdiction under consideration) influence the graduate entry to the stock of providers.
The effects of individual variables may not be confined to graduate entry to the stock of providers. Increasing the educational requirements for a profession may involve increasing the period of training which leads to a reduction in the number of new
graduates as students enter the extended period of training. However, the increased level of training might be associated with an increase in productivity once graduates enter the provider stock of providers. Hence policies aimed primarily at one element of the model may have impacts in other elements of the model.
The need for services module:
Data for the demography part of the needs for services are taken from Statistics Canada population estimates. For the epidemiology element, indicators of need will vary
depending on the type of provider under consideration. In the absence of any ‘gold-standard’ measure of the need for health care, four types of indicators of need are considered: health risks, morbidity, mortality and subjective measures of health status. The intention is not to measure needs in the population precisely but to identify data that will reflect or influence differences in needs for services within population groups and changes in needs over time. The appropriate indicators may differ by type of provider. For example, for health care professions whose services are predominantly in the primary care sector, and hence ‘driven’ largely by the demands of the population, measures of self-assessed health status are used since such self-assessments often provide the ‘trigger’ that leads to consultations with primary care providers. However self-assessed health status may not be an appropriate indicator of need for providers with more condition-specific activities that are accessed through referrals (e.g., respiratory therapists).
The purpose of the level of service element is to transform data on needs to requirements for services. For the application of the simulations, the current distribution of services by levels of need is derived by combining data on the quantity and resource intensity of service use by age and gender with survey data on self-reported use of services by needs for a sample of population. This assumes that the distribution of actual utilisation across need groups is the same as the distribution of self-reported utilisation by self-reported health status in health survey data.
For the purposes of illustrating the application of the model, the combined population of the four Atlantic provinces of Canada (New Brunswick, Newfoundland and Labrador, Nova Scotia and Prince Edward Island) is used as the baseline population. Because there is no crystal ball with which to identify the future levels and distributions of needs for care, three alternative scenarios for age and gender specific needs are used:
1. They remain constant over time,
2. They move to current levels observed for Canada as a whole over the next decade, 3. They change in accordance with the observed trend in the Atlantic Region over
The Work and Productivity Module:
The work and productivity module considers the average rate of service delivery per hour of work within provider groups. So, for example, in the case of hospital-based registered nurses the average number of RIW standardised episodes of care per 1000 worked hours will form a measure of average productivity of registered nurses (Birch et al, 2003). The level of productivity is influenced by several factors including the way human resources are used and the availability of other resources for use in service production. For example, O’Brien-Pallas et al. (2003) found that inpatient length of stay was higher in hospital units where over 90% of registered nurse time was devoted to direct patient care, even after allowing for differences in other factors such as patient acuity. In other words, productivity falls where the intensity of work exceeds this threshold. Similarly, average productivity of nurses was observed to be lower for units where a greater proportion of RN time was made up of overtime hours.
The adoption of current levels of many of the variables in the simulation model (e.g., productivity, level of service, training programme attrition, participation and
activity rates etc.) is used to only provide a starting point or baseline for simulations. It is not intended to imply that these levels represent some notion of an efficient use of health care resources. The modular nature of the simulation model, however, means that these levels can easily be replaced by other values in order to consider the effect of changing ‘current practice’ on the supply of and requirements for providers.
General simulations are used to understand the relative impact of different policies and combinations of policies on imbalances between human resource
requirements and supplies. Space constraints prevent a full range of simulations being presented in this paper. Data were taken from various populations and professions as were available during the development of the simulation model. As a result these simulations represent hypothetical situations for the purposes of illustrating the
application of the model. Simulations for a range of different professions for particular jurisdictions are underway but the results are not yet available. Simulations were run for a
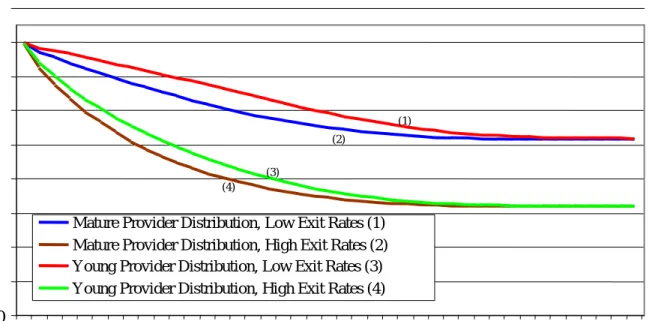
40 year period. Actual estimates of requirements and supplies 40 years ‘down the road’ are necessarily unreliable given the increasing levels of uncertainty associated with the various elements of the framework as the period of simulation increases. However, running the simulations over such a time frame is important to understanding system dynamics. Two provider age distributions were used to model the effect of a “mature” versus a “young” stock of providers together with two different distributions of exit rates by age to produce four different scenarios. The distributions were based on Registered Nurses data for two different Canadian provinces. Each of the four scenarios was applied to an initial stock of 10,000 providers, 500 training seats, 20% training program attrition, 50% graduate out-migration, 80% full-time employment, and age-specific entry rates based taken from the registration data of one Canadian province.
Figure 2 shows changes in the size of the provider stock for each scenario. Each scenario is associated with a reduction in the size of the stock of providers reflecting the large number of retirements anticipated even in the relatively young age distribution.
Figure 2: Total Activity-Adjusted Providers Over Time 900
(4) (3)
(2)
(1)
Young Provider Distribution, High Exit Rates (4) Young Provider Distribution, Low Exit Rates (3) Mature Provider Distribution, High Exit Rates (2) Mature Provider Distribution, Low Exit Rates (1)
5
0
0
Total Activity-Adjusted Providers
800 700 600 500 400 300 200 100 10 15 20 25 30 35 40 Future Years
The size and age distribution of a provider stock exposed to stable set of exit (and entry) rates will converge to a stable stock and age distribution regardless of the initial age distribution. Thus, the entry and exit rates of a provider stock imply a fixed age distribution if maintained. Large shifts in the age patterns of entry and exit rates over time resulting from policies that differentially affect younger versus older providers have on going impacts on supply through their effects on the age distribution of the stock. And implications for future service flows. Moreover, increases in training seats are not particularly helpful or effective at dealing with short term or time limited changes in human resource requirements because of the delay in outcomes (i.e., duration of training). Such changes are more effectively addressed by considering changes in the way the existing stock of providers is used as opposed to changes to the size of the stock.
Effect of Retirement Scenarios on human resources gap
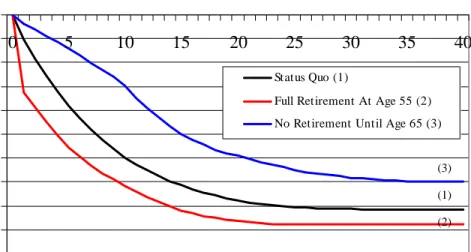
Three retirement scenarios were considered. The baseline scenario employed the mature age and high exit rates distributions. The high exit rates incorporate current estimates of retirement rates (i.e. exit rates over age 50) based registered nurses data for one Canadian province. The alternative scenarios assumed all providers exit at age 55 and providers exited at rate of 1% per year from age 55-65 at which point all remaining providers retired. The 1% rate allows for exits due to other factors such as death and disability within a scenario of no voluntary early retirement.
The baseline scenario shows the increase in provider gap resulting from a large share of the provider stock reaching retirement age. In the long-term, changing the age of retirement has relatively small effect on the provider gap. However, the early and late retirement scenarios have substantial short-term effects. The effects of the scenarios are sensitive to the assumed age distribution and the baseline level of exit rates. For example, the impact of the retirement scenarios is smaller if applied to a young initial age
Figure 3: Effect of Various Retirement Scenarios on Provider Gap -5000 -4500 -4000 -3500 -3000 -2500 -2000 -1500 -1000 -500 0 0 5 10 15 20 25 30 35 40 Future Years P ro v id er G a p Status Quo (1)
Full Retirement At Age 55 (2) No Retirement Until Age 65 (3)
(3) (1) (2)
On the other hand, a choice of baseline entry and exit rates that results in a future implicit age distribution that is more mature (i.e. low exit rates and higher entry rates at older ages) increases the long-term impact of the retirement scenarios. This shows that polices designed to delay retirement until age 65 have the potential to delay increases in provider gaps associated with a mature age distribution. Hence they may help to address provider gaps in the short term. However delaying retirement does not solve the problem of the loss of providers - it simply delays its onset. Moreover, the rate of decline in supply, once the older workers reach retirement will be more rapid. As a result policies to delay retirement should not be pursued in isolation from other interventions to address human resource gaps. They may be a useful strategy to ‘buy time’ while other
interventions are introduced.
Effect of Increases in the Number of Training Seats
Changing the number of training seats is often the first policy response to human resource gaps. The simulation model was applied to scenarios of changing the number of
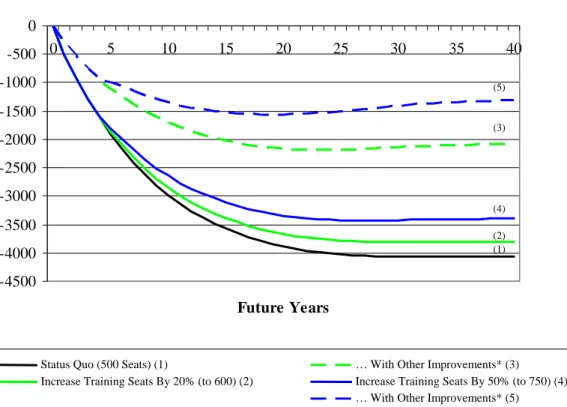
training seats. The simulations used the mature age distribution and high exit rate scenarios and used baseline assumptions of 80 per cent full-time employment among those involved with direct patient care, and age-specific entry rates based on registered nurses in one Canadian province. An initial balance between supply and requirements was assumed. The training programme was assumed to be four years long with 500 training seats, 20 per cent training programme attrition, and 50 per cent out-migration of new graduates. Simulations were run for increasing the number of training seats by 20 per cent and 50 per cent respectively. In addition consideration was given to how this would be affected by a combination of a 50 per cent reductions in programme attrition and graduate out migration and a 10 per cent reduction in exit rates from the stock of providers (labeled as ‘other improvements’ in the figure).
Figure 4: Effect of Various Training Seat Scenarios On Provider Gap
-4500 -4000 -3500 -3000 -2500 -2000 -1500 -1000 -500 0 0 5 10 15 20 25 30 35 40 Future Years P ro v id er G a p (5) (3) (4) (1) (2)
Status Quo (500 Seats) (1) … With Other Improvements* (3) Increase Training Seats By 50% (to 750) (4) Increase Training Seats By 20% (to 600) (2)
The solid lines in Figure 4 show the effect of training seat increases on the human resource gap without the other improvements. There was no effect the first four years because of the time lag between increasing the number of seats and the increase in the number of graduates exiting the programme. Despite the fact that both scenarios represent a large increase in seats, it takes 10-15 years before the seat increases have a substantial effect on the human resource gap because the number of additional graduates remains small as a proportion of the total provider stock. In the long-term, however, increasing the training seats had a substantial effect on the size of the gap.
The effectiveness of an increased seat policy is compromised if programme attrition, out migration and other exits are at high levels. Increasing training seats does not provide a quick fix for addressing human resource gaps and dealing with supply fluctuations over time. increasing the number of training seats is appropriate only where the number of new entrants into the provider stock will not, in the long run, be sufficient to maintain an overall stock of providers sufficient to meet future service requirements.
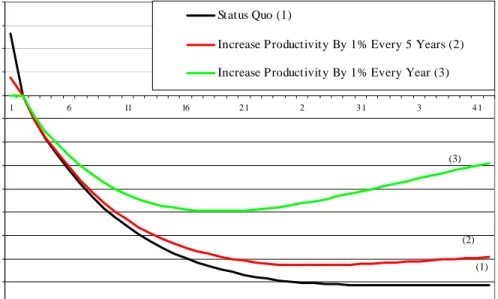
The Effect of Changes in Productivity on HR Surpluses and Gaps
Data on levels and trends in productivity are not generally available for the health professions. However it seems plausible to assume that many of the developments occurring in the ways health care services are organized and delivered are aimed at improving productivity and hence reducing the unit cost of service production. The productivity scenarios used in the simulation model were based on an average annual increase in productivity of 1 per cent and an increase in productivity of 1 per cent every 5 years respectively. An increase in productivity of 1 per cent every five years is very small and entails, for example, an increase in the severity-adjusted case load of a primary care practice from say 3000 to 3030 over 5 years. A 1 per cent per year increase in productivity is much larger, but still modest compared to average annual increases in labour productivity of around 2 per cent in the Canada.
Figure 5: Effect of Various Productivity Scenarios on Provider Gap -4 ,50 0 -4 ,0 0 0 -3 ,50 0 -3 ,0 0 0 -2 ,50 0 -2 ,0 0 0 -1,50 0 -1,0 0 0 -50 0 0 50 0 1,0 0 0 1,50 0 2 ,0 0 0 1 6 11 16 2 1 2 3 1 3 4 1 Future Years P ro v id er G a p Status Quo (1)
Increase Productivit y By 1% Every 5 Years (2) Increase Productivit y By 1% Every Year (3)
(3)
(2)
(1)
The simulations show that even small improvements in productivity have a substantial impact on human resource gaps (Figure 5). Productivity improvements have the potential to offset large reductions in supply resulting from retirements, provided that productivity improvement is used to support and maintain providing the same levels of service to an increased population as opposed to being drawn into unplanned increases in levels of services (what Evans (1984) refers to as the ‘illusions of necessity’).
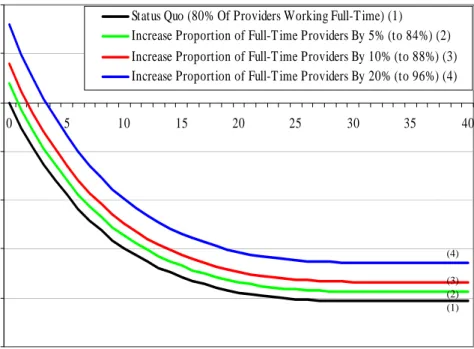
The Effect of Changes in the Distribution of Worked Hours on HR Surpluses/Gaps
Alternative levels of activity were used as the basis of the distribution of activity: not working and working full-time. As described above, for the baseline simulation 80 per cent of the stock were assumed to work full-time, and 20 per cent were not working. simulations then examined the effect of increasing the proportion working full time by 5, 10 and 20 per cent respectively. This corresponds to an increase in the share of all providers who are working full time from the baseline 80 per cent to 84, 88 and 96 per cent respectively.
Figure 6: Effect of Various Provider Worked Hours Scenarios on Provider Gap The (1) (2) (3) (4) -5000 -4000 -3000 -2000 -1000 0 1000 2000 0 5 10 15 20 25 30 35 40 Future Years P r ovi d e r Gap
Status Quo (80% Of Providers Working Full-T ime) (1) Increase Proportion of Full-T ime Providers By 5% (to 84%) (2) Increase Proportion of Full-T ime Providers By 10% (to 88%) (3) Increase Proportion of Full-T ime Providers By 20% (to 96%) (4)
(4)
(1) (2) (3)
Figure 6 shows that that changing the worked hour distribution is a powerful short-term policy option for addressing short term human resource gaps.
Changes in Needs
The needs module was applied to the population of one Canadian province to assess the effect of alternative scenarios concerning changes in population health status on acute care service requirements. Self-assessed health status was used as the indicator of need and based on data from the 2003 Canadian Community Health Survey. The demographic change in the population was based on Statistics Canada’s ‘medium’ projections for 2026 extended for the whole 40 year simulation period.
The ‘level of service’ component, was based on current rates of utilization by age, sex and self-assessed health status. This generated a distribution of use within each age group according to level of need.
Figure 7 Acute care resource requirements by needs scenario 100 120 140 160 180 200 220 240 260 280 1 3 5 7 9 11 13 15 17 19 21 23 25 27 29 31 33 35 37 39 41 Future Years A d ju s te d E p is ode s of C a re
No Change (1) Continuation of trend (2) Can Ave in 10 Yrs (3)
(1) (2) (3)
Three scenarios of changes in the distribution of self-assessed health status by age and gender were used. A baseline assumption where the distribution of self-assessed health by age and sex of the population remains unchanged; a continuation of trend assumption where the distribution of self-assessed health status continues to follow observed trends over the last decade; and a ‘catch up’ scenario where the population achieves Canadian average levels of age and sex specific self assessed health in ten years and then remains constant.
The effect of each of the needs scenarios on future acute care service
requirements is shown in Figure 7. The continuation of trend scenario results in future service requirements that are similar to the baseline trend (no change in health status). This reflects the fact that observed changes in the health status distribution from which the trend was developed did not follow a clear pattern. The largest effect is seen in the comparison with the improvement in health status to Canadian levels with the baseline over that period for which the improvements are assumed (i.e., the first 10 years). The increase in total requirements is around 25,000 inpatient episodes less (around 10 per cent) less under the ‘Canadian standards’ scenario than under baseline. This would be
much greater still if these improvements were to continue beyond the first 10 years. As a result, the failure to accommodate any improvements in health status within the
population could lead to substantial overestimates of the requirements for providers.
Discussion:
An important contribution of the needs-based approach to HHRP is the central role played by the needs of the population in ‘driving’ provider requirements. Previous approaches to health human resources planning have implicitly adopted age and sex as proxy measures of need. However, this fails to allow for variations in needs within age and sex subgroups of the population (e.g., needs among 35-45 year old males may differ according to economic, behavioural, social or environmental factors) and changes in these needs over time (Birch et al., 2003). The levels and distribution of needs in the population are introduced explicitly as a determinant of provider requirements into the analytical framework. So, for example, if the average health status of 65-75 year old males increases over time, the number of providers required to serve this subgroup of the population would fall, other things equal, because the number of services required by this subgroup to meet current levels of service would be lower.
Introducing different levels of need explicitly into the analytical framework means that some method is required for translating need into requirements for services , There are no ‘gold-standard’ ‘weights’ for this translation. Although we might expect populations with lower levels of health status to be provided with greater quantities of services, the size of the ‘health status-service provision’ relationship is largely the result of provider discretion guided by professional guidelines and ethics and subject to the constraints imposed by prevailing budgets. Because level of service is a determinant of provider requirements, changes in the level of service will affect requirements for
providers. Suppose research suggests more frequent screening of diabetic patients would improve patient outcomes and decision makers seek to change service delivery to this
patient group accordingly. Such a change increases the level of service and, with all other things equal, this increases the required number of providers.
Similarly a method is required for translating estimated service requirements into provider requirements. This translation will depend on the rate of productivity of
providers (i.e., services per provider). Productivity depends on a variety of factors, including the intensity of work (proportion of paid hours devoted to patient care), how work is organized, technological inputs, and inputs of other types of professionals. For example, research by O’Brien-Pallas et. al. (2003) found that above certain thresholds, increases in intensity of work (as measured by MIS workload measurement systems) reduce nursing productivity. In New Brunswick, the introduction of an automated pharmacy project was associated with a reduction in requirements for pharmacists to maintain service levels for the population (Maston T, River Valley Health Care, personal communication).
By identifying the separate determinants of provider requirements the analytical framework helps to avoid HHRP ‘falling’ for the ‘illusions of necessity’ of continuous increases in provider requirments (Evans 1984). Moreover it enables policy makers to evaluate the basis of, and justification for increases in the sizes of provider stocks and increases in education and training programmes as a method of achieving increased stocks.
References:
Birch S. (2002) Health human resource planning for the new milenium: Inputs in the production of health, illness and recovery in populations. Canadian Journal of Nursing Research, 33: 109-114.
Birch S, Maynard A. (1985) Dental manpower. Social Policy and Administration, 19:199-217.
Birch S, Lavis J, Markham B, Woodward C, O'Brien-Pallas L. (1994)Nursing requirements for Ontario over the next twenty years: Development and application of estimation methods. Report commissioned by the Ontario Nursing Human Resources Data Centre. Hamilton: McMaster University, 1994.
Birch S, Eyles J, Newbold B. (1996) Proxies for healthcare need among populations: Validation of alternatives - a study in Quebec. Journal of Epidemiology and Community Health, 50: 564-569.
Birch S, O’Brien-Pallas L, Alksnis C, Tomblin-Murphy G, Thomson D. (2003) Beyond demographic change in human resources planning: an extended framework and
application to nursing. Journal of Health Services Research and Policy, 8: 225-229.
Canadian Health Services Research Foundation (2001) Number of nurses increases in 2000, Links 4: 5.
Denton F, Gafni A, Spencer B. (1993) The SHARP computer system - A tool for resource planning in the health care sector, in Strategic Issues in Health Care
Management, M.Malek, J. Rasquinha and P. Vacani, Eds. London: John Wiley and Sons.
Denton F, Gafni A, Spencer B. (1994) System for Health Area Resource Planning (SHARP): an application to Ontario medical school enrolment. Canadian Medical Association Journal, 1151: 39-45.
Denton F, Gafni A, Spencer B. (1995) The SHARP way to plan health care services: A description of the system and some illustrative applications in nursing human resource planning. Socio-Economic Planning Sciences, 29: 125-137.
Denton F, Spencer B. (2000) Population aging and its economic costs: A survey of the issues and evidence. Canadian Journal on Aging, 19 (supplement 1): 1-31.
Evans R. (1984) Strained Mercy: The economics of Canadian health care. Toronto; Butterworths.
Eyles J, Birch S, Chambers S, Hurley J, Hutchison B. (1991) A needs-based methodology for allocating health-care resources in Ontario: Development and application. Social Science and Medicine, 33: 489-500.
Fries J. (1980) Aging, natuaral death and the compression of morbidity. New England Journal of Medicine, 303: 130-135.
Gray A. (1982) The production of dental care in the British National Health Service. Scottish Journal of Political Economy, 29: 59-74.
Kazanjian A. (2000) Nursing Workforce study: Volume 5. Changes in the nursing workforce and policy implications. Vancouver: University of British Columbia.
Kazanjian A, Rahim-Jamal S, Wood L, MacDonald A. (2000) Nursing workforce study: Volume 1. Demographic context in health system structure for nursing services in Canada. Vancouver: University of British Columbia.
Lavis J, Birch S. (1997) The answer is . . .now what was the question? Applying alternative approaches to estimating nurse requirements. Canadian Journal of Nursing Administration, 10: 24-44.
Lomas J, Stoddart G, Barer M. (1985) Supply projections as planning: A critical review of forecasting net physician requirements in Canada. SocialScience and Medicine, 20: 411-424.
Markham B, Birch S. (1997) Alternative approaches to estimating nurse requirements. Canadian Journal of Nursing Administration, 10: 7-23.
Newton S, Buske L. (1998) Physician resource evaluation template: A model for estimating future supply in Canada. Annals of the Royal College of Physicians and Surgeons of Canada, 31: 145-150.
O’Brien-Pallas L, Thomson D, Alksnis C, Bruce S. (2001) The economic impact of nurse staffing decisions: Time to turn down another road? Hospital Quarterly, 4: 42-50.
O’Brien-Pallas L, Thomson D, McGillis Hall L, Pink G, Kerr M, Wang S, Li X, Meyer R. (2003) Evidence-based standards for measuring nurse staffing and performance. Report for the Canadian Health services Research Foundation.
Roos N, Shapiro e, Bond R, Black C, Finlayson G, Newburn-Cook C, MacWilliam L, Steinbach C, Yogendran M, Walld R. (2001) Changes in health and health care use of Manitobans, 1985-1998. Manitoba Centre for Health Policy and Evaluation.
Ryten E. (1997) A statistical picture of the past, present and future of registered nurses in Canada. Ottawa: Canadian Nurses Association.
Shipman S, Lurie J, Goodman D. (2004) The general pediatrician: Projecting future workforce supply and requirements. Pediatrics, 113: 435-442.