January 2016
2015 Solid Waste Policy Report
Legislative charge
Minnesota Statute §115A.411 requires the Minnesota Pollution Control Agency to draft a solid waste policy report for the Legislature every four years. The report must contain information on the status of solid waste management in Minnesota and make
recommendations for new or modified policies to advance the management of waste in the state.
Primary authors
Anna Kerr Mark Rust Peder SandheiContributors/acknowledgements
David Benke Jim Chiles Madalyn Cioci Timothy Farnan Steve Giddings Wayne Gjerde Susan Heffron Colleen Hetzel Garth Hickle Kirk Koudelka Rick Patraw Sig ScheurleEditing and graphic design
Scott Andre Theresa Gaffey
Estimated cost of preparing this
report
(as required by Minn. Stat. § 3.197) Total staff time: 1847 hrs. $102,028 Production/duplication $0Total $102,028
The MPCA is reducing printing and mailing costs by using the Internet to distribute reports and information to wider audience. Visit our website for more information.
MPCA reports are printed on 100% post-consumer recycled content paper
manufactured without chlorine or chlorine derivatives.
Minnesota Pollution Control Agency
520 Lafayette Road North | Saint Paul, MN 55155-4194 |651-296-6300 | 800-657-3864 | Or use your preferred relay service. | [email protected]
Contents
Executive summary ...1
Minnesota’s current solid waste system and dynamics ...2
The waste management hierarchy ... 2
Roles and requirements ... 3
Funding ... 5
Data and reports: A foundation for prioritizing solid waste initiatives and policy recommendations ... 5
Waste measurement and data ... 5
Office of the Legislative Auditor Recycling and Waste Reduction (February 2015) ... 10
Recycling and Solid Waste Infrastructure Evaluation ... 10
Sustainable materials management: An evolution in the approach to solid waste management ... 13
The hierarchy and sustainable materials management ... 14
Better prioritization ... 16
Better measures ... 17
Recommendations for moving toward sustainable materials management ... 17
Recommendations for supporting the waste hierarchy ... 18
The economics of waste in Minnesota ... 19
What has been happening in the market lately ... 19
Economic activity associated with Minnesota’s reuse and recycling industries ... 20
Definitions ... 21
Public and private systems ... 22
Differences between Greater Minnesota and the Twin Cities Metro Area ... 22
Waste classification ... 23
Recommendations for clarifying waste classification ... 25
Greater Minnesota solid waste plan reform ... 26
Recommendations for county planning ... 28
Recycling market development ... 29
The role of MPCA in recycling market development ... 29
Recommendations for market development ... 30
Evaluation of new technologies ... 30
Recommendations for new technologies ... 31
Managing organic materials ... 32
Access to organics collection ... 33
Compostable product labeling ... 36
Markets for compost ... 36
Recommendations for organics recovery ... 37
Supporting product stewardship ... 38
Existing product stewardship programs ... 38
Batteries ... 38
E-waste ... 38
Architectural paint ... 39
Other problem materials ... 40
Mercury-containing lamps ... 40
Carpet ... 40
Mattresses ... 41
Agricultural plastic and boat wrap ... 41
Recommendations for product stewardship ... 41
Resource needs ... 43
Recommendations for financing and resource allocation ... 43
Appendix A: Summary of policy recommendations ... 44
Recommendations for moving toward sustainable materials management ... 44
Recommendations for supporting the waste hierarchy ... 45
Recommendations for clarifying industrial solid waste ... 45
Recommendations for county planning ... 45
Recommendations for new technologies ... 45
Recommendations for organics recovery ... 46
Recommendations for market development ... 46
Recommendations for product stewardship ... 46
Recommendations for financing and resource allocation ... 47
Appendix B: Past SWPR recommendations implemented in Minnesota ... 48
Appendix C: Efforts underway as recommended by OLA report ... 49
Reduction and reuse ... 49
Restriction on disposal ... 50
Improved data collection ... 50
Appendix D: Capture rate vs. recycling rate ... 52
Appendix E: Estimate of recyclable materials available for recovery ... 54
Appendix F: Market Development supplemental information ... 56
Executive summary
Minnesota’s Waste Management Act has been in place since 1980 and establishes criteria for the management of three types of solid waste – mixed municipal solid waste (MMSW), construction and demolition wastes (C&D), and industrial solid waste (ISW).
The waste management hierarchy establishes preferred management methods based on environmental impact. Reduction and reuse of materials are at the top of the hierarchy, followed by recycling,
composting and waste to energy, with the least preferable method land disposal.
The current management system focuses largely on discards and what to do with a material at the end of its life. However, the waste management system is evolving, and sustainable materials management (SMM) approaches are becoming more prevalent. SMM focuses on the best use and management of materials based on how they impact the environment throughout their life cycle.
As the population of Minnesota grows and the economy continues to improve, new and innovative ways of managing materials will be necessary. The Minnesota Pollution Control Agency (MPCA) should evaluate these methods based on SMM to determine how they fit into an integrated waste management system.
An effective SMM approach prioritizes management of materials based on highest and best use, while looking at all environmental impacts throughout that material’s life cycle.
This Solid Waste Policy Report draws from foundational information from The Office of the Legislative Auditor’s (OLA) 2014 Evaluation of Recycling and Waste Reduction, the Recycling and Solid Waste Infrastructure Evaluation conducted by the MPCA, and waste composition data.
Key issues addressed in this report include: • Sustainable materials management • The economics of waste
• Waste classification
• Recycling market development • Organics management
• Product stewardship
Minnesota’s current solid waste system and
dynamics
The Minnesota Waste Management Act (WMA), adopted in 1980, established criteria for managing solid waste.
The goal of the act is to protect Minnesota’s land, air, water, and other natural resources and public health by improving waste management in the state to:
• reduce the amount and toxicity of waste generated
• separate and recover materials and energy from waste
• reduce indiscriminate dependence on disposal of waste
• coordinate solid waste management among political subdivisions
• develop waste facilities in an orderly and deliberate way (including disposal facilities) and ensure their financial security
The waste management hierarchy
The waste management act defined in statute is designed to promote landfill abatement and encourage more environmentally favorable waste management methods in a manner appropriate to the
characteristics of the waste stream. It prioritizes waste reduction, reuse, recycling, and organics recovery above methods that preclude further use of the materials, including waste-to-energy (burning refuse to recover fuel or energy) and land disposal. See Figure 1 below.
Roles and requirements
In Minnesota, the responsibility of managing solid waste is primarily delegated to the counties, while the state retains oversight authority and supports local efforts through permitting, planning, financial support, and technical assistance. Counties develop solid waste management plans that include how the county will ensure waste is managed properly, how it will meet the goals and objectives of the WMA, and all efforts that will be undertaken to manage waste in accordance with the hierarchy. These plans are submitted to the MPCA for approval.
The Twin Cities Metropolitan Area1 and Greater Minnesota counties have different sets of requirements governing their solid waste planning, with the primary difference being Metropolitan County Solid Waste Master Plans must comply with the current Metropolitan Solid Waste Management Policy Plan (Metro Policy Plan), which is a 20-year plan updated every 6 years (Minnesota Statute § 473.149). Greater Minnesota County Solid Waste Plans must conform to Minn. Stat. § 115a.46 and Minnesota Rules Chapter 9215.
The current system — rules, laws, fees, and taxes — are aimed mostly at mixed municipal solid waste (MMSW) disposal. Although the WMA does address all types of solid waste and separate requirements exist for industrial (ISW) and construction and demolition C&D facilities, they currently receive less emphasis than MMSW. This needs to be rectified, and the focus of state and local programs in the future should be to ensure that all material — MMSW, ISW, and C&D — is managed to its highest and best use.
New and innovative approaches to using typically discarded materials as feedstocks for new products is one way reuse is being implemented by local Minnesota companies. Not only are these materials given a new life, the companies often recognize cost savings by eliminating the need to manufacture new materials. One example of these principles at work is Relan, who makes bags and computer cases out of vinyl banners and other discarded promotional items.
1 The Twin Cities Metropolitan Area includes seven counties: Ramsey, Hennepin, Anoka, Washington, Carver, Scott, and Dakota.
Case study: Relan: environmental and fashion trendsetters
Relan is a small company with a big mission, located in Mendota Heights, Minnesota. It began in 1995 as a company that was trying to keep vinyl banners out of the landfill, but has evolved into so much more. Relan takes outdated materials such as t-shirts, construction materials, banners and finish line mesh from other companies and uses these materials as a feedstock for new products like tablet cases, purses and lunch bags, replacing the need for virgin materials such as cotton, and wool or synthetic fibers. Relan’s business model is that the material is not processed from its original state through recycling or any other process but rather repurposed in its original state, with some
alterations such as cleaning, cutting, and sewing. To date the company has kept over 300,000 square feet of material from being wasted.
By repurposing materials, Relan is:
• Moving waste up the hierarchy from disposal or even recycling to reuse • Reducing the amount of material going to landfill
• Eliminating the manufacturing impact of new materials • Reducing the transportation costs of importing new materials • Supporting the U.S. economy by purchasing locally made products • Avoiding disposal fees for these materials
The CEO, Della Simpson, believes that sustainable fashion can help support our economy, save valuable resources, and give old materials a new life. As companies increasingly report that they are worried about material scarcity for their products, Relan has made a great business out of using what would have been a waste as its main feedstock.
Funding
State funding is currently provided to counties and waste districts via revenue generated from the state Solid Waste Management Tax (SWMT). During the 1997 legislative session, two taxes related to solid waste were eliminated:
• The Select Committee On Recycling and the Environment (SCORE) sales tax on garbage collection services, which paid for waste reduction and recycling programs.
• The Solid Waste Generator Assessment (SWGA), which paid for cleaning up old landfill sites that are environmental hazards.
A substitute tax –– the Solid Waste Management Tax (SWMT) –– was put in place to pay for the
programs currently funded by the two different state fees. This new tax system went into effect January 1, 1998. The SWMT is designed to raise the same amount of money for state programs but is more streamlined and efficient than the two separate fees in the old system. People who pay for garbage services in Minnesota now pay the solid waste management tax, with different rates applied to waste streams.
Seventy percent of the revenue from the SWMT goes to the Environmental Fund, which funds programs at the MPCA, including solid waste and landfill cleanup activities. The remaining 30% goes to the General Fund. Counties receive funding from the SWMT through the Environmental Fund, administered by the MPCA in the form of SCORE grants. Additional resources come from the competitive grant and loan programs and Capital Assistance Program (CAP) funding, which provides funding to local units of
government for projects to promote landfill abatement. SCORE grants are distributed to all counties and waste districts with approved Solid Waste Management Plans. In 2014, the Legislature appropriated additional funds for SCORE. For many years, the SCORE allotment was $14.25 million per year. In 2014, the Legislature increased funding to $18.25 million for 2015 and $17.25 for 2016 and beyond. SCORE grants are based on a formula. A minimum amount is provided for each county, and then the balance of the appropriated funds is allocated based on population. The minimum payment is established by the Legislature.
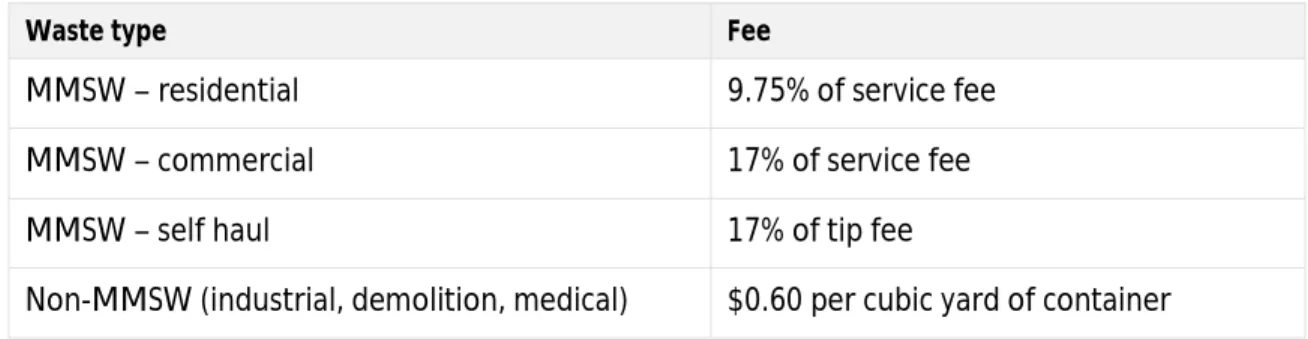
Table 1: Solid Waste Management Tax rates
Waste type Fee
MMSW – residential 9.75% of service fee
MMSW – commercial 17% of service fee
MMSW – self haul 17% of tip fee
Non-MMSW (industrial, demolition, medical) $0.60 per cubic yard of container
Data and reports: A foundation for prioritizing solid waste initiatives
and policy recommendations
Waste measurement and data
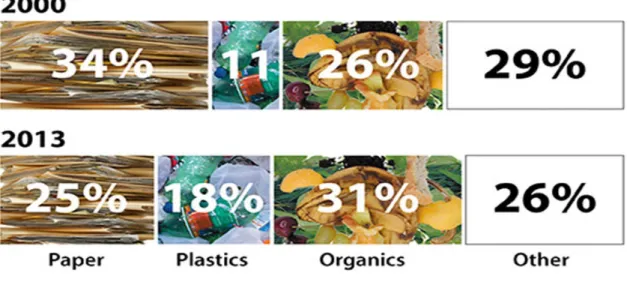
The MPCA conducted a waste characterization study in 2013 to determine the make-up of what is being disposed of in MMSW streams across the state (Figure 2). A similar study was conducted in 2000 and a
comparison of those results show the composition of mixed municipal solid waste is changing. The top three categories of MMSW — paper, plastics, and organics — remain the largest material types in the waste stream by weight; however, there was a reduction in the percentage of paper generated and increases in both plastics and organics (as a percentage of the total waste collected) from 2000 to 2013. Many of these materials could be recovered for reuse, recycling, or organics management. With
aggressive goals for recycling in statute for the seven-county Metro Area (75% by 2030), it will be necessary to recover more and dispose of less to meet these goals.
Figure 2. Composition of waste sent to disposal facilities
The 2013 SCORE report summarizes the current state of recycling and waste diversion of MMSW in Minnesota. The full report can be found at
http://www.pca.state.mn.us/index.php/view-document.html?gid=22484. The 2013 report is the most recent complete summary of recycling rates and materials management rates for the state. The 2014 SCORE survey results provide summary information on recycling will be available on the SCORE Report webpage.
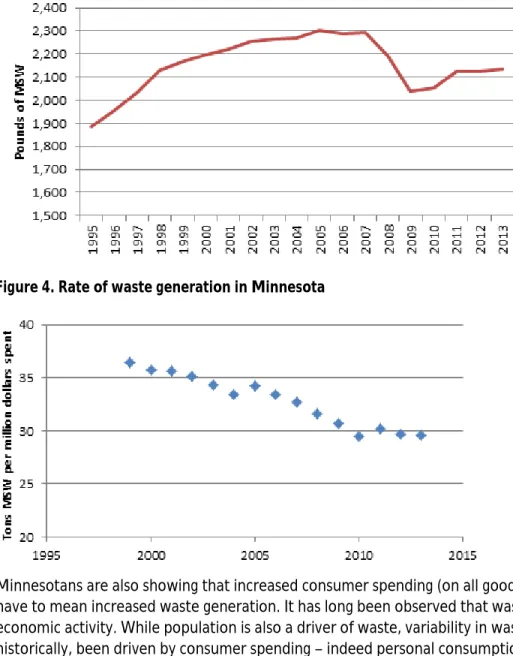
Minnesota continues to generate more total waste annually but is generating less waste per capita. After 4% and 5% declines in total MMSW generation during the economic recession years of 2008 and 2009, there has been a gradual uptick as the economy has recovered. Despite the increase, total generation in 2013 was 1.4% less than in 2005. Per capita, Minnesotans generated almost 7% less in 2013 than in 2005 (Figure 3).
Figure 3. Per capita MSW generation
Figure 4. Rate of waste generation in Minnesota
Minnesotans are also showing that increased consumer spending (on all goods and services) does not have to mean increased waste generation. It has long been observed that waste generation varies with economic activity. While population is also a driver of waste, variability in waste generation has, historically, been driven by consumer spending – indeed personal consumption expenditure (real PCE) explained over 96% of variability in waste nationally from 1960-1994. 2
Applying methods outlined in EPA’s National Source Reduction Characterization Report3 (including use of Personal Consumption Expenditure4 as tracked by the Bureau of Economic Analysis) to Minnesota, a trend emerged: expenditures have increased, while per capita MMSW generation has decreased (See Figure 4 above).
2 United States Environmental Protection Agency (1999). “National Source Reduction Characterization Report For Municipal Solid Waste in the United States” EPA530-R-99-034, http://nepis.epa.gov/Exe/ZyPDF.cgi?Dockey=100015V9.PDF
3 United States Environmental Protection Agency (1999). “National Source Reduction Characterization Report For Municipal Solid Waste in the United States” EPA530-R-99-034, http://nepis.epa.gov/Exe/ZyPDF.cgi?Dockey=100015V9.PDF
4 Bureau of Economic Analysis, Table 2.3.6:
http://www.bea.gov/iTable/iTable.cfm?reqid=9&step=1&acrdn=2#reqid=9&step=3&isuri=1&903=66
In 2005, Minnesotans generated 34.2 tons of MMSW for every million dollars spent. In 2013, they generated only 29.6 tons of MMSW per million dollars. So, even though an increase in personal spending is occurring, the per capita generation of waste is not increasing at the same rate, indicating the two do not have to be linearly related. This is important because it suggests that Minnesota can continue to put more money into the economy, but an increased rate of waste generation is not the inevitable result. Similar analysis has not been done with other waste streams like construction and demolition or industrial wastes.
While they are good signs, the downward trend in the rate of waste generation per dollar spent does not mean that our waste problems are solved. Though the waste per dollar is declining, and waste per capita has slowed, there is still an overall trend of increasing waste tonnage in Minnesota. Even though individuals are generating less waste, because of the continued population growth, the total amount of waste disposed of each year by Minnesotans as a whole is increasing.
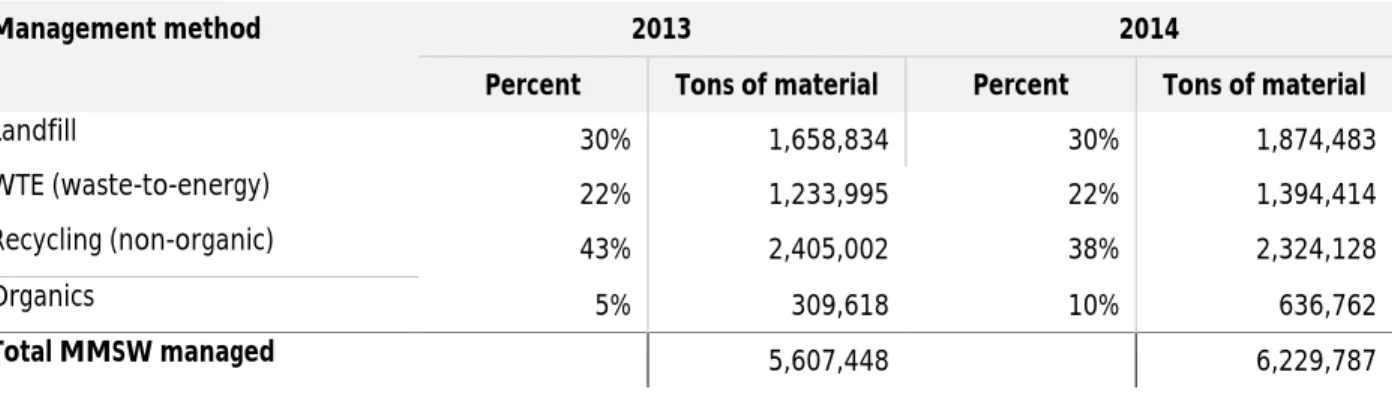
Due to changes in the way SCORE data was collected for 2014, some of the information was incomplete. Disposal information does not include out-of-state disposal for this single year due to reporting changes. Hauler reporting (which was passed in the 2015 legislative session) will help fill this temporary gap of information in future years. Therefore, we cannot calculate the precise recycling rate for 2014. Recycling and organics management methods were fully reported as can be observed in Table 2. This is a short-term issue as we transition to a new method of tracking this data.
Table 2. MMSW managed in Minnesota (as reported in SCORE)
Management method 2013 2014
Percent Tons of material Percent Tons of material
Landfill 30% 1,658,834 30% 1,874,483 WTE (waste-to-energy) 22% 1,233,995 22% 1,394,414 Recycling (non-organic) 43% 2,405,002 38% 2,324,128 Organics 5% 309,618 10% 636,762
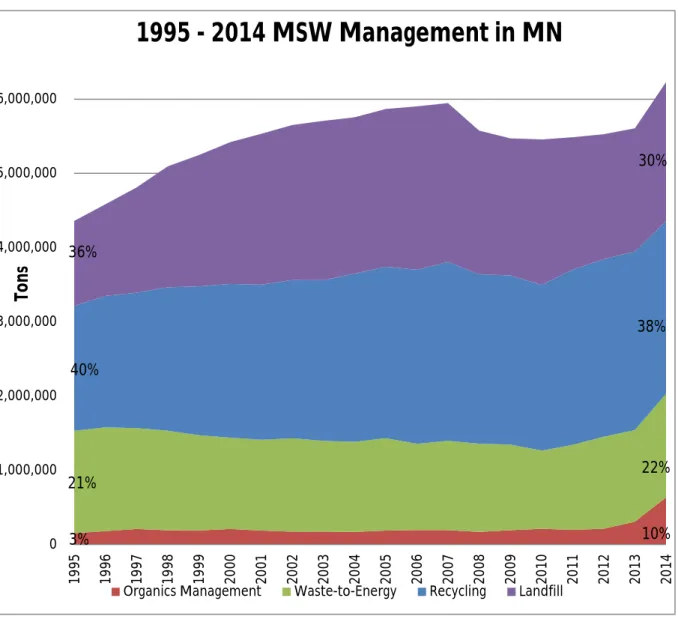
Figure 5. MMSW managed in Minnesota (as reported in SCORE)
Prior to 2013, yard waste was not included as a measured portion of the organics stream; rather it was added to the recycling rate by 5% if county programs demonstrated certain activities. In 2013, the MPCA stopped using estimates, and allowed yard waste tonnage, if documented, to count toward the organics number. In 2014, organics increased by 48% over 2013. Statewide recycling tonnages were slightly down in 2014.
There are challenges with organics collection, but due to the infancy of organics recycling collection programs, it’s easier to make substantial gains in that area than it is in traditional recycling, a well-developed program. Organics materials were defined as the largest portion of what Minnesotans continue to throw away in the 2013 Waste Characterization Study. This demonstrates there is a lot of potential material to remove from the disposal stream that can help advance the state toward the new goals established in the Metro Policy Plan and in state statute.
Despite large differences between Greater Minnesota and the Metro Area with regards to policies, the success of recycling is very similar between the two. The statewide recycling rate, including organics, is 48% (Table 3). The biggest difference in the data from these two regions of the state is the amount of waste being landfilled in Greater Minnesota. Both areas of the state face similar challenges of increasing
0 1,000,000 2,000,000 3,000,000 4,000,000 5,000,000 6,000,000 19 95 19 96 19 97 19 98 19 99 20 00 20 01 20 02 20 03 20 04 20 05 20 06 20 07 20 08 20 09 20 10 20 11 20 12 20 13 20 14
1995 - 2014 MSW Management in MN
Organics Management Waste-to-Energy Recycling Landfill
Ton
s
10% 30% 22% 38% 3% 21% 40% 36%organics diversion as the new frontier and continuing to reduce the amount of MMSW going to disposal and waste to energy (WTE). An additional challenge for Greater Minnesota is ensuring there is sufficient processing capacity for recycling, organics, and WTE.
Table 3. MMSW managed in Metro Area and Greater Minnesota (as reported in SCORE)
Office of the Legislative Auditor Recycling and Waste Reduction (February 2015)
The Office of the Legislative Auditor (OLA) prepared a report, Recycling and Waste Reduction, for the Legislature in 2014. The report (http://www.auditor.leg.state.mn.us/ped/pedrep/recycling.pdf)
examined various policies, financial and programmatic issues, and made recommendations on how to advance a successful integrated solid waste management system in Minnesota. The MPCA agreed with many of the findings of the report and offered additional recommendations, which can be found in the MPCA Commissioner’s response letter published in the OLA’s final report.
The primary findings from the OLA report include:
• Minnesota’s approach to managing waste focuses too narrowly on recycling, rather than on the full range of waste management activities.
• Establish goals for all tiers of the hierarchy, including landfill disposal, and track progress toward these goals.
• Incentivize activities that encourage management methods consistent with the waste hierarchy.
• Increase resources to develop markets that use recyclable materials.
• MPCA should ensure that, to the extent possible, waste is processed before it is disposed of in a landfill.
Overall, the report provides good insight into the existing system dynamics and areas that should continue to be improved. Additional findings from the OLA are examined in more detail and policy recommendations developed throughout the rest of this report.
Recycling and Solid Waste Infrastructure Evaluation
The state of Minnesota recently completed a Recycling and Solid Waste Infrastructure Evaluation (May 2015). (See full report: http://www.pca.state.mn.us/index.php/view-document.html?gid=23460.) The primary purpose of this report was to determine the current state of infrastructure in Minnesota and to identify major waste-sheds of material flow. The study is designed as a reference manual to help inform decisions regarding orderly facility development, statewide MMSW and recycling capacity needs, and capital improvement projects, to inform future planning priorities including things like Certificate of Need (CON). Some of the important findings are as follows:
Solid waste infrastructure
• Large portions of Minnesota are served only by MMSW landfills, generally in Greater Minnesota.
2014 Recycling Organics Waste to energy Landfill
Percent Tons Percent Tons Percent Tons Percent Tons
Metro 38% 1,313,603 8% 275,574 30% 1,026,758 24% 806,528
Greater
Minnesota 36% 1,010,525 13% 361,188 13% 367,656 38% 1,067,955
• Most of the waste-to-energy facilities are at capacity, with the exception of the Metro Area facilities and Olmsted County. Most of these facilities have been in operation for 20 years or more.
• There are approximately 15 logical waste-sheds in the state that each have unique waste management systems, and therefore have different levels of success. Roughly half of these waste-sheds are served by public facilities (Table 4).
• Private industry provides over 60% of the landfill capacity in the state, although much of that capacity is at the four landfills that serve the seven-county Metro Area.
Table 4. MMSW managed in Minnesota (as reported in SCORE)
Region Ownership of primary disposal facilities
Crow Wing Public and private East Central Public
Mar-Kit Public Metro Private Northeast Private Polk Group Public Pope/Douglas Public
Prairie Lakes Public and private Southeast Public and private Southwest Public
Traverse Private
Tri-County North Public and private Tri-County South Public and private West Central Private
Recycling infrastructure
• The Metro Area is served by large single-stream materials recovery facilities (MRFs) that are well capitalized and have excess capacity available.
• Roughly 80% of all recycled material in Minnesota was processed at the six largest facilities in 2013, all of which are located in the seven county Twin Cities Metropolitan Area.
• In Greater Minnesota, most of the MRFs are rapidly aging and nearing the end of their useful lives. These facilities are largely publicly owned.
• Over 760,700 tons of recyclable material are currently not being recovered, and instead are being disposed of, based on analysis of the 2013 Waste Characterization Study.
• Developing markets for recyclable materials in Minnesota should be a priority.
• Private industry provides the vast majority of the recycling processing capacity in Minnesota.
Overall
• In order to achieve the new legislative goal of achieving a 75% recycling rate by 2030 in the Metro Area, more private-public arrangements are necessary to expand collaboration between the public and private sectors.
The 2013 waste composition study, OLA report, and Waste Infrastructure and Capacity Assessment in addition to other solid waste data helped inform the MPCA on issues to be addressed in this Solid Waste Policy Report (SWPR). They are foundational pieces of information that provide insight on the current system and what is necessary to continue to improve the management and flow of solid waste in Minnesota.
Sustainable materials management: An evolution
in the approach to solid waste management
This report seeks to develop policies and approaches that will move Minnesota to a more sustainable future and by improving the management and flow of materials
throughout their life cycle to maximize environmental benefit. It starts from
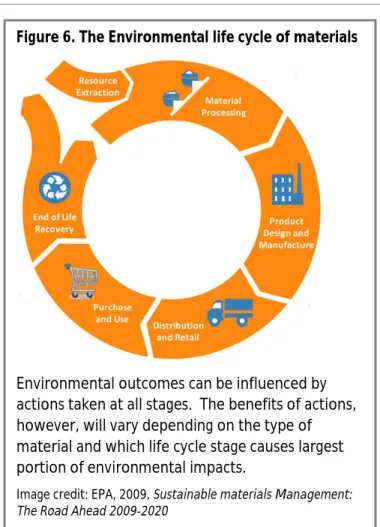
recognition that products and materials vary in the environmental impacts they cause throughout their life cycles, and that the largest portion of those impacts is typically caused in the extraction of raw materials, manufacturing, and sometimes use phases (see Figure 6).
Sustainable materials management (SMM) focuses on the best use and management of materials based on how they impact the environment throughout their life cycle. SMM considers impacts of extracting raw materials, scarcity of materials, product design, product use, and reuse. Traditional concerns of managing discards are also included in SMM — optimizing systems of recycling, energy recovery, and disposal.
This is not an entirely new concept; it builds on the foundation of work set in motion by
the Waste Management Act and past policy reports (e.g. resource conservation). The waste management hierarchy already emphasizes practices that have little to do with management of discarded products. “Reduce”, which refers to preventing creation of discards altogether, and “reuse” primarily involve changes in consumption and use materials, not management of discards.
While the waste management hierarchy puts reduction and reuse at the top, in practice, the main focus of the state, cities, counties, and private sector over the last 30 years has been on recycling and
disposing of the waste that has already been created. There are two reasons for this: 1. Over time, as noted in the OLA report, the waste management hierarchy has been
operationalized to create incentives for pursuing recycling or composting over reducing the size, material, or toxicity of an item. For example, because many state and local goals are tied to recycling rates of MMSW, there has been little incentive for state, local and private parties to develop ways to reduce or better manage MMSW.
2. It has been easier for the state, cities, counties, and industries to manage and measure discards instead of working to influence (and measure the impact of influencing) product design,
industrial practices, and community consumption patterns — the areas where reduction and reuse can be achieved. Reduction and reuse efforts often require a wider range of partners, more time, and data that is difficult to obtain.
Figure 6. The Environmental life cycle of materials
Environmental outcomes can be influenced by actions taken at all stages. The benefits of actions, however, will vary depending on the type of material and which life cycle stage causes largest portion of environmental impacts.
Image credit: EPA, 2009, Sustainable materials Management:
Framing Minnesota’s efforts to conserve resources and protect our air, land, and water by using a SMM approach requires evolution of the traditional waste management hierarchy put into state law 35 years ago. SMM provides a framework based on data and analysis tools developed since the hierarchy was established. That SMM framework will enable public and private efforts to better target specific materials that have the greatest overall impact on the environment, including energy, water, and resource use, as well as greenhouse gas generation. Within that framework, the hierarchy still holds as a model for managing discards. For example, past stakeholder efforts identified extending the life of computers as an excellent step for environmental benefits and resource conservation. The challenge will be putting staff and program resources in place to make these types of initiatives as much a part of our work as recycling and disposal has been to date. Collecting meaningful data to determine the success and effectiveness of such initiatives will also be a challenge.
While SMM offers important information on environmental impacts and helps policy makers focus efforts on achieving the highest and best environmental use of materials, neither SMM nor the hierarchy provides information on other important factors such as economic (e.g. jobs) and
social/political (e.g. environmental justice) considerations which would also need to be evaluated before final decisions are made. Though the focus of the Solid Waste Policy Report is primarily environmental, the MPCA has and will continue to consider all of these implications when making decisions on policy, planning, and implementation.
The hierarchy and sustainable materials management
Minnesota’s solid waste management hierarchy tells us to reduce, reuse, and recycle materials and then process remaining solid waste before landfilling. An SMM framework helps us understand that the hierarchy is a useful tool to be used as part of an integrated process of actions throughout materials’ life cycles rather than as a single choice at the point of discard – to reuse, recycle or throw away.
The ideal is to first engage in source reduction at the product design and manufacturing stage or at the citizen consumption point. This means first working with manufacturers to create durable, fixable, and lightweight products that use less material and materials with lower environmental footprints, and secondly, putting in place policies and infrastructure that extends the life of products, through repair, rental, refurbishing and reuse of all kinds. Ideally, goods are designed in a way that when they cannot be used or repaired further, the components are easily separated for recycling. Continued work is needed to support and develop recycling markets and recycling technologies for products where markets aren’t mature or technologies don’t yet exist.
The importance of recycling is reaffirmed in the SMM framework. The benefit of recycling is commonly thought to be in managing discards to reduce demand for disposal facilities, when in fact, the larger environmental value of recycling lies primarily in providing feedstocks to manufacturing and reduced need for extraction and processing of virgin raw materials. Thus, as addressed later in this report, developing the highest use markets for materials of highest environmental impact is preferred.
Case study: Minnetonka Middle Schools
Schools dump disposables for reusable utensils
When Minnetonka Middle Schools (East and West) decided to dump their plastic single-use knives and forks, they first considered switching to compostable products. But recognizing that reduction and reuse are higher on the waste hierarchy than recycling and composting, they instead switched to reusable stainless steel, with help from a grant from the MPCA. You might think that reusables for schools would increase water consumption as well as costs, but the schools discovered the opposite was true.
The switch in utensils prevented almost 6,000 pounds of trash per year and was expected to save the schools $26,000 over three years in purchase costs including purchase of the initial set of reusable utensils. And that’s not all.
Life cycle analysis estimates, which take into account the environmental footprint of manufacturing, revealed that the reusables had a much smaller total environmental footprint. Compared to the disposable plastic, the stainless steel reusable utensils reduced greenhouse gases by 77% and water consumption by over 80,000 gallons (after taking school dishwashing into account). In addition, the reusable stainless steel, resulted in 74% net reductions in air acidification (sulfur dioxides) and smog (oxides). How is this possible? Because instead of needing 700,000 plastic utensils manufactured, packaged and shipped each year, they only needed 12,000 metal ones. Reuse works to conserve materials and reduce pollution.
Better prioritization
SMM highlights at which point in the life cycle a material has the biggest environmental impact, and in turn, which type of materials management activity could make the most improvement. It goes beyond solid waste management and traditional focus on MMSW recyclables to consider high impact product categories like cement or specific types of food or textile fibers5. Under an SMM framework, therefore, C&D and ISW and their sources will be considered together with MMSW and its sources in determining priority work.
In our current system, incentives and resources are primarily put on increasing recycling of traditional recyclables in waste — even low-impact or low-tonnage materials. All recycling is of equal value, and all reuse is of equal value. Starting from a SMM perspective, it may prove more beneficial to focus
resources on capturing aluminum over another material, extend the life of computers, or replace asphalt shingles with more durable steel roofing. SMM will also allow focus on materials that have higher toxicity, helping to bridge toxics reduction and solid waste interests.
5 The Road Ahead. U.S. EPA. 2009
Case study: Mayo Clinic and MnTAP unwrap environmental benefits of
reusable sterilization containers
Healthcare facilities incur considerable annual expense in managing the surgical tool sterilization process. The volume of single use polypropylene blue wrap being disposed by larger facilities has been estimated to be as high as 20% of the surgical services waste stream or 5% of a hospital total waste stream. The Mayo Clinic Hospital, Saint Mary’s Campusallowed the Minnesota Technical Assistance Program (MnTAP) to study impacts of the sterilization process in their Rochester, MN facility. The cradle-to-grave assessment, conducted by MnTAP and University of Minnesota researchers, compared the environmental impacts of disposable blue wrap to reusable aluminum sterilization containers. The study included raw material extraction, product manufacture, use in the hospital, and end-of-life disposal.
Results showed the reusable cases reduce solid waste by 88% and have roughly half the greenhouse gas (GHG) emissions impact of the disposable wraps. The use phase has the greatest environmental impact due to the large amount of energy consumed during the sterilization and decontamination processes. The reusable cases had less use phase impact than disposable wrap. The lesson is clear, and reinforces the benefits of reuse.
Better measures
Decision-making informed by SMM can result in better overall environmental outcomes. However, adoption of this approach would require new measures for gauging progress. For example, if large companies in the state transition to use of reusable transport packaging rather than cardboard boxes, the amount of old corrugated cardboard (OCC) collected for recycling could decline, showing a drop in recycling rate. Using (and rewarding) current metrics of recycling rates, this action could seem a poor choice. The overall environmental benefits of waste prevention through source reduction are superior, but go unrecognized. This demonstrates that better measurement and evaluation of full life-cycle accounting is important.
Recent development and refinement of analysis tools and available data, including life cycle assessment, allow a more complete view of the environmental impacts of products and materials through a
product’s life cycle, a helpful addition to the traditional metric of tons managed. By incorporating these new tools, SMM can inform decision making that results in better overall environmental outcomes. Measuring capture rate of recyclables in addition to traditional overall recycling rate is recommended. A capture rate indicates how much of a specific recyclable material is captured, relative to the total amount of that specific material that has been discarded. A recycling rate, on the other hand, looks at how much of all recyclable material is captured, relative to all discarded materials. See Appendix D for additional information on capture rate v. recycling rate.
By allowing an apples to apples comparison of the amount of recyclables collected to the amount of recyclables available for collection, capture rate more precisely conveys the effectiveness of recycling programs. Additionally, using the above example, if OCC is replaced with lighter weight cardboard or with reusable boxes, the capture rate isn’t negatively affected.
Finally, while recycling rate measures have been instrumental in driving positive changes in solid waste management in Minnesota, a capture rate would allow improved targeting of specific materials for recycling or reuse initiatives based on their overall environmental impact.
Effectively promoting programs that advance the hierarchy, especially the top of the hierarchy, are important to achieving the environmental goals of the state. Targeting and measuring those materials and practices that have the greatest impact on our environment will help ensure we are successful. The SMM framework and related evaluation tools will allow policy and decision makers more targeted and effective information for future problem solving.
The Office of the Legislative Auditor Recycling and Waste Reduction (February 2015) audit of state and local solid waste programs finds:
“Minnesota’s approach to managing waste focuses too narrowly on recycling, rather than on the full range of waste management activities. We recommend the Legislature establish goals and
performance measures for all levels of the waste management hierarchy.”
The MPCA agrees with this assessment and further recommends that the state develop a more comprehensive and representative set of goals, including reduction and reuse goals that better reflect the priorities of Minnesota’s solid waste management hierarchy. This expanded approach will provide goals and recommend incentives to achieve the goals of the hierarchy based on an SMM approach.
Recommendations for moving toward sustainable materials
management
• MPCA will review and recommend research needed to develop and measure effective materials management goals for all types of materials, not just focusing on the MMSW stream. Findings will be shared and discussed with stakeholders for additional input, refinement, and
implementation.
2. Measure and report all waste.
• Currently other than what gets discarded and managed as MMSW, approximately two-thirds of solid, non-hazardous waste generated in Minnesota is not tracked. The reporting that does exist is present in facility annual reports, but is not reported in SCORE by counties, and, in turn, material that is recycled (i.e. shingles) does not “count” toward the recycling rate. Further, by not counting these materials, policies may be more MMSW-focused when the actual
environmental impacts from other waste streams are more damaging. Additionally, SMM principles need to be applied when evaluating waste streams to promote their highest and best use.
3. Determine a set of priority materials to focus on, based on life cycle environmental impacts.
• The MPCA will build on the 2009 solid waste stakeholder effort by bringing in other measures such as energy, resource and water impacts. This stakeholder work used the EPA’s limited lifecycle analysis based Waste Reduction Model. See Environmental Initiative, Integrated Solid Waste Management Stakeholder Process, 2009.
4. Measure the capture rate of recyclables in addition to the recycling rate.
• MPCA will work with a few communities to test and refine the measurement methodology and estimate the financial needs (e.g. sorting of recyclables and waste) that are necessary to support a broader use of this approach. Using the results of these pilots, the MPCA will determine how best to apply this approach to local, regional and state level analysis.
5. Require waste composition studies at all disposal facilities.
• Waste-to-energy facilities are currently required to conduct waste composition studies every five years. This requirement should be extended to all disposal facilities for consistency. The data provides important trend information on waste composition (types and quantities of materials disposed). The addition of landfill information will help policy, planning, and implementation efforts, such as assessing capture rates. This requirement should include all landfills, not just MMSW facilities.
6. Reform the waste deposit disclosure requirement and specifically require haulers to provide information to consumers on the final destination of their waste.
• Currently, some customers receive a list of all facilities a hauler may take the waste picked up at the curb. This does not provide sufficient information and can cause problems down the road if there is a question of liability for a specific waste. Ideally, this allows a customer to understand how their waste is managed and make informed decisions on selecting a hauler.
Recommendations for supporting the waste hierarchy
1. Reform SWMT structure to clearly dis-incentivize land disposal. Specifically, change tax/fees, the pay-as-you-throw policy, and other policies to ensure that the least preferable management methods are the most expensive.
• Currently all waste destined for disposal at either a waste-to-energy facility of landfill pay the same tax rate. The overall goal is to move material up the hierarchy to its highest and best use.
The economics of waste in Minnesota
Traditional waste management methods create the perception that land disposal is the most cost- effective solution. But there are externalities and hidden costs to land disposal that should be
considered. Generators should be aware of the true costs associated with any type of disposal option. All aspects of managing waste, including long-term management and monitoring costs, lost
opportunities for material recovery, and environmental impacts should be considered. Managing materials in accordance with SMM and the hierarchy supports economic growth and development in the creation of new industries, markets, and jobs necessary to support these endeavors.
Material that is recycled and reintroduced as a feedstock into a manufacturing process continues to generate economy activity. The very act of manufacturing adds value to material. Landfilling adds no further value to the material. Once material is landfilled, it ceases to produce any additional economic activity.
While the waste management hierarchy provides direction and focus on material recovery, the reality is that nearly one third of the material we generate in Minnesota ends up being landfilled. Given the significant volume and impact this material has now and into the future, it is important to explore some of the economic variables that influence waste disposal.
Further, the externalities of land disposal are not often considered when evaluating price associated with land disposal. All environmental, social, and economic factors should be evaluated in order to put a true cost on a waste management method. Minnesota’s Closed Landfill Program (CLP) provides
information and the long-term cost associated with historic landfills in the state. Although the landfills in the CLP were designed differently than today’s modern landfills and may have been higher risk for contamination, it is still true that landfilling waste is a higher risk option than other disposal methods. Financial assurance is paid by landfill operators with the intent of covering long-term costs. However, because we cannot predict the future, it is still unclear whether that will cover all costs needed for closer and long-term care at landfill sites.
What has been happening in the market lately
During the 1990s, the State of Minnesota and private industry invested millions of dollars in developing recycling end markets. The success of the current collection system and end markets for recycling that are in place today directly reflect those investments.
In the 2000s, the investment pace slowed down on the end market side to a crawl. The paper and steel industries experienced many rounds of consolidation and closure due to the increased amount of material being imported from China. The export of our domestic market capacity picked up speed with the massive investment by China in paper, steel, and plastic. China and other southeast economies Gross Domestic Product (GDP) was 8.45% in 2000 peaking at 14.2% in 2007. The GDP has trended downward since 2007 first quarter 2015 GDP about 7%.
The domestic collectors of recycled material relied on China for an increased portion of their sales in the 2000s. China consistently paid above market prices until about 2013. The domestic market saw a downward trend in pricing with the recession and dramatic price drops in 2013. In 2013, the Chinese government instituted a policy called the Green Fence. The policy banned the import of all but the cleanest, most organized bales of recyclables. The lack of investment in domestic markets since 2000 meant the domestic market could not take up the increased amount of material, which resulted in these price drops. The state of Minnesota’s emphasis has been on developing local, regional and domestic
markets in conjunction with partners. These partners include haulers, recyclers, national, state and local governments, and the domestic end markets.
It is important with poor markets and China’s slowing economy to invest in domestic markets. This would mean more processing and end market development. The opportunity exists to create jobs domestically. This will require financial investment by the state and private sector to take advantage of this opportunity. At the same time, we have to maintain and strengthen the existing markets. Currently there are low feed stock prices and Minnesota is experiencing a steady, but growing economy.
Economic activity associated with Minnesota’s reuse and recycling
industries
Since 1996, the MPCA has examined the economics associated with the recycling sector. Recently, the MPCA has also done studies on the economics of the reuse, rental, and repair industries as well as worked with the Minnesota Composting Council to evaluate the economics of organics6. MPCA’s studies report on the employment numbers associated with these industries as well as the economic activity such as gross annual sales information, percent of the state’s gross domestic product, annual wages, and individual income and sales tax. Most of this information was obtained by purchasing information from Dun & Bradstreet, but Regional Economic Models, Inc. (REMI) was also used to model things such as the indirect jobs, induced jobs, salaries, tax revenue and gross state product.
The recycling, reuse, rental and repair sectors of the economy generated an estimated $1.338 billion in federal, state tax and local tax revenue and employed approximately 63,500 thousand people in direct jobs. These jobs, in turn, supported another 74,500 thousand people downstream in indirect and induced jobs. All together these jobs, which paid a $6.28 billion in wages, represent a major force in Minnesota’s economy. This sector represents about $26 billion in sales, which is approximately 6% percent of Minnesota’s economy.
By not recovering materials that could be recycled, $2.3 billion of potential material was discarded between 1996 and 2013 in Minnesota.
Appendix F includes estimates of the potential market value lost because materials were disposed of and not used as feedstocks to make new products. It includes a breakdown of the types of material disposed and their potential market value.
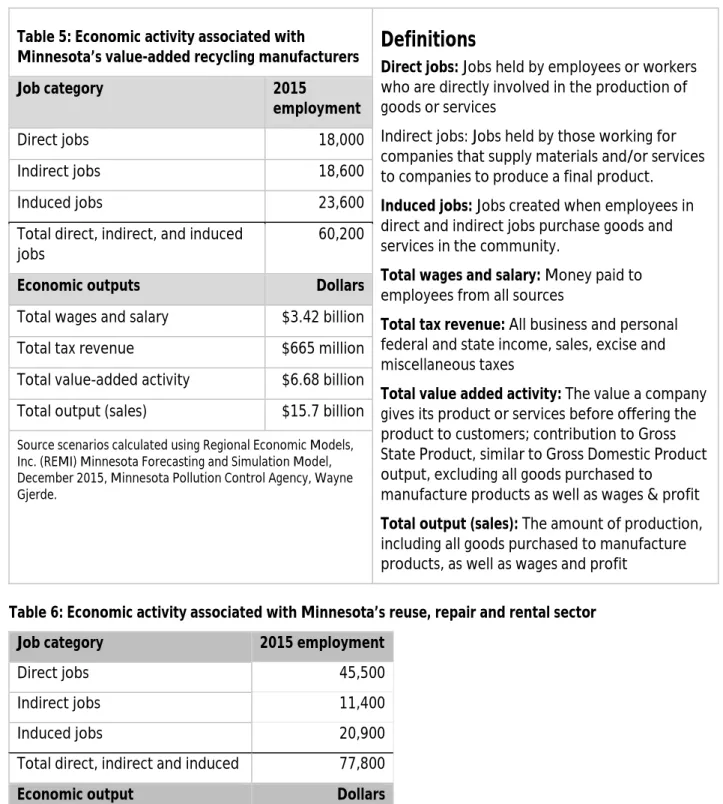
Tables 5 and 6 are intended to provide a snapshot in time of economic activity associated with the recycling value added manufacturing and reuse repair and rental sector. Caution should be exercised in comparing this analysis to the previous analysis, as the data sources are different than previous work.
6 A Study of the Economic Activity of Minnesota’s Reuse, Repair and Rental Sectors. Minnesota Pollution Control Agency. 2011.
Table 5: Economic activity associated with
Minnesota’s value-added recycling manufacturers
Definitions
Direct jobs: Jobs held by employees or workerswho are directly involved in the production of goods or services
Indirect jobs: Jobs held by those working for companies that supply materials and/or services to companies to produce a final product.
Induced jobs: Jobs created when employees in
direct and indirect jobs purchase goods and services in the community.
Total wages and salary: Money paid to
employees from all sources
Total tax revenue: All business and personal
federal and state income, sales, excise and miscellaneous taxes
Total value added activity: The value a company
gives its product or services before offering the product to customers; contribution to Gross State Product, similar to Gross Domestic Product output, excluding all goods purchased to
manufacture products as well as wages & profit
Total output (sales): The amount of production,
including all goods purchased to manufacture products, as well as wages and profit
Job category 2015
employment
Direct jobs 18,000
Indirect jobs 18,600
Induced jobs 23,600
Total direct, indirect, and induced
jobs 60,200
Economic outputs Dollars
Total wages and salary $3.42 billion
Total tax revenue $665 million
Total value-added activity $6.68 billion Total output (sales) $15.7 billion Source scenarios calculated using Regional Economic Models, Inc. (REMI) Minnesota Forecasting and Simulation Model, December 2015, Minnesota Pollution Control Agency, Wayne Gjerde.
Table 6: Economic activity associated with Minnesota’s reuse, repair and rental sector
Job category 2015 employment
Direct jobs 45,500
Indirect jobs 11,400
Induced jobs 20,900
Total direct, indirect and induced 77,800
Economic output Dollars
Total wages and salary $2.86 billion
Total tax revenue $673 million
Total value-added activity $6.97 billion Total output (sales) $10.26 billion
Source scenarios calculated using Regional Economic Models, Inc. (REMI) Minnesota Forecasting and Simulation Model, December 2015, Minnesota Pollution Control Agency, Wayne Gjerde.
Public and private systems
Minnesota’s solid waste system has evolved from being a public-only system put in place to provide sanitation services to protect public health to one that has both public entities and private businesses operating in a joint system. As private businesses began to play a larger role in the system and more business opportunities were recognized, the system matured to include services well beyond trash collection. In today’s complex waste management marketplace, we see the collection and management of recyclables, processing facilities for waste and recyclables, and more recently the expansion of organics collection from only yard waste programs to now include food, non-recyclable paper and other compostable materials.
Both public and private entities play an important role and must work together to maintain the integrity of the whole system as well as look for opportunities to manage materials more effectively, efficiently and in environmentally responsible ways. Both have made substantial investment in and play important roles in the operation of a successful marketplace.
Challenges do exist in the current system. Managing materials in accordance with the hierarchy does not always result in the lowest cost option. In
order to be more successful, the economics need to be adjusted so that the short-term costs and profits promote better
environmental outcomes. Although it can seem as though the public and private sectors are at odds when it comes to the current waste management system, it is important to
recognize the efforts and jobs created by private enterprises choosing to do business in Minnesota. These private entities help spur the state’s economy by creating and keeping jobs local while also providing a necessary service to residents of Minnesota. Therefore, it is
important to identify common goals between the public and private sectors to move toward sustainability.
Differences between Greater
Minnesota and the Twin Cities
Metro Area
In Greater Minnesota, counties have established transfer stations, MMSW
processing facilities, recycling facilities, and/or landfills. In these counties, waste collectors generally use public infrastructure to unload their trucks and manage waste. This has the effect of establishing a level playing field for waste collectors in terms of waste
management (after collection).
Waste haulers in the Twin Cities Metro Area
are heavily dependent on private infrastructure for waste management. There are only two large public
Impacts of flow control
Prior to the 1990s, public entities could, by state law and local ordinance, designate all waste generated within their jurisdiction to a specific solid waste facility. Federal litigation regarding county authority to direct the flow of waste effectively ended the use of what is commonly referred to as “flow control” via waste designation in 1994.
Since that time, counties have had to use subsidies, long-term contracts and other approaches to process waste higher on the hierarchy. These other methods have been less effective and more costly than flow control, primarily because most of the waste management infrastructure is owned by private waste management entities who have financial incentives to take waste to their own landfills or landfills that charge a lower tip fee than waste-to-energy facilities and counties have used subsidies to ensure waste flow to preferred facilities.
In 2013, a court decision revisiting the issue of flow control ruled that local governments can designate waste to publicly owned facilities. Because of this change, several Minnesota counties have expressed interest in designating their waste to publicly owned facilities and have started the process of updating existing or creating new designation plans and ordinances.
waste management facilities7 located in the Metro Area, the Hennepin Energy Recovery Center, and Hennepin County’s Brooklyn Park Transfer Station. The other essential infrastructure for waste
management including transfer stations, recycling centers, MMSW processing facilities, and landfills are privately owned.
There has been an increase in vertical integration by waste collection and management firms, where MMSW is collected and taken to privately owned landfills. Vertical integration is the process of a company owning assets in collection, transfer, and management of waste and recyclables. It results in the company saving money on tip fees and other costs that would be incurred if they had to deliver material to a competitor’s facility. Much of the permitted landfill capacity in and around the Metro Area was acquired by vertically integrated waste management companies to serve their collection operations and the needs of other waste haulers.
Waste classification
Definitional discrepancies concerning waste types, and in particular industrial wastes, may be interfering with implementation of the state’s long-standing waste hierarchy. Specific areas affected by this are Metro Area processing requirements for MMSW under Minn. Stat. § 473.848; conservation of MMSW landfill capacity under the Certificate of Need (CON) statute, risk management at landfills, and the difference in tax rates between MMSW and ISW.
In 1988, solid waste management in Minnesota looked like this:
• “Industrial waste” meant some variety of manufacturing or processing waste, or commercially generated waste that needed special handling if disposed along with industrial waste.
• There were no ISW landfills taking waste from a wide variety of commercial customers; the only ISW landfills were “captive landfills” owned by industries to dispose of their own residues such as coal ash, paper-mill sludge, and auto fluff.
• Taxes and fees on waste disposal for all types of solid waste (MMSW, ISW and C&D) were low. At that time, no one expected generators and haulers to shift commercially generated, organic MMSW materials into the ISW category. And state taxes had not yet been applied to waste disposal services (taxes that would later offer a significant rate reduction if classified as ISW), so there was no pressing financial incentive to reclassify traditional MMSW as ISW.
ISW received extra attention from inspectors and incurred extra expense due to classification and screening requirements, and ISW carried a perceived liability in the case of Superfund actions at landfills that took such waste. In addition, ISW landfills were more expensive due to waste testing, toxicity characteristic leeching procedure (TCLP) analysis, material safety data sheet (MSDS) documentation, and waste manifesting. All of these things made the disposal of industrial solid waste as a co-disposal item with MMSW much harder.
In 2014, the picture looked like this:
• 63% of industrial wastes are categorized as “other” on annual reports to the MPCA and are not specifically characterized in the same way that ISW streams were in the 1980s.
7 Ramsey and Washington Counties recently voted to purchase the Resource Recovery Technology (RRT) Processing Facility in Newport.
• MMSW separation requirements for recycling and organics are increasing, particularly in the Metro Area — but not for ISW and C&D.
• The nature of ISW being landfilled has changed, though a waste composition study is needed to confirm this. Observers report that the waste is less dense than it used to be and contains less foundry sand and contaminated soil.
• ISW landfills have lower regulatory requirements than MMSW landfills (no CON, less mandatory environmental review, lower fees on waste arriving at the gate, more flexible design
requirements, lower taxes on generators). One result is that Minnesota landfills now have 1,841 years of ISW space if current statewide volumes were to continue.
• A 2010 law that raised siting and financial requirements for new landfills (both MMSW and ISW landfills) is encouraging the industry to expand landfills already in operation, rather than build new ones. Under current laws, it is easier to expand an ISW or Class III demolition landfill than it is to expand an MMSW landfill.
In 2014, 6.6 million tons of solid waste was disposed of at landfills in Minnesota. This includes municipal, industrial, and construction and demolition wastes. Currently, these three waste streams are managed independently of one another, and non-MMSW, for which there is little data, makes up more than two thirds of the total. All waste types need to be tracked more effectively to ensure proper management and protection of human health and the environment.
Table 7. Waste disposed of in Minnesota in 2014
Waste type Landfill type Quantity
Industrial solid waste Non-MMSW landfills or non-MMSW
disposal cells at sanitary landfills 2.7 million tons* Construction and demolition Demolition landfill 2.0 million tons Mixed municipal solid waste MMSW landfill 1.9 million tons
*Of the 2.7 million tons of ISW disposed of in Minnesota in 2014, 1.7 million or 63% of that waste was labeled as “miscellaneous,” “other,” or described as a blend of multiple types.
Land disposal practices, waste characteristics, and financial incentives have changed dramatically over the last three decades, but the laws and rules have not kept pace. As Table 7 above demonstrates, 2.7 million tons of ISW was disposed of in 2014. Of that 2.7 million tons, 1.7 million tons was classified as miscellaneous, other, or as a mix of various types. Some information suggests a portion of the wastes that would have traditionally been classified as MMSW is now being managed as ISW. Some reasons for this may include the State’s current definitions of ISW in statute and rule and the current landscape of MSW and ISW capacity. Regardless of the reasons, the MPCA needs to look closer at the situation to determine if there are impacts to the system and discuss how data is classified and submitted for reporting. Additional data is needed on the makeup of the waste classified in the other category to determine what types of materials are being disposed and if facilities are equipped to manage those wastes.
This potential shift of waste from one category to another raises environmental concerns. One example of such a concern is where a portion of waste received might react with other waste in the landfill (chemically or biologically). Industrial wastes and municipal solid wastes are not, in some cases, compatible in the same landfill. The problem can arise when large quantities of industrial wastes are reactive in conditions typical of landfills taking MSW, which contain moist, biologically active organics that are slow to degrade when buried. Examples include aluminum smelting residues and baghouse dust. The reactions, which can produce elevated temperatures deep in the waste, and combustion
byproducts, is not addressed by long-standing hazardous waste regulations, as these rules have more difficulty characterizing chemically reactive materials than characterizing toxic materials. There is also the concern of ensuring landfill capacity is indeed being managed through the certificate of need process (CON)8 as intended by statute.
Until the definitions are updated and clear, there is the possibility for similar waste to be classified differently in various situations. Unlike other definitional categories such as demolition debris and medical-pathological that are tied directly to the inherent and visible nature of the waste itself, some in the solid waste field regard ISW as a flexible term. They see the term “ISW” less about the inherent, visible characteristics of waste and more on how generators, haulers, and landfills decide to separate and handle it. This allows for the potential selection between MMSW and ISW categories, depending on response to market demand, distance to facilities, facility capacity, liability risks, and public opinions about landfills in the neighborhood, local fees, and state taxes.
The MPCA rule definition of ISW is causing problems with the MPCA’s ability to implement state law and policy. The rule definition is more inclusive than the definition of “industrial waste” under Minn. Stat. § 115A.03, which requires thoroughly separate handling from cradle to grave. The Department of
Revenue’s implementation of the SWMT relies on the more restrictive ISW definition from Minn. Stat. § 115A.03, because the SWM tax law (Chapter 297H) directly references the 115A definition. Meanwhile, MPCA and regulated parties have been using the broad definition of ISW found in Minn. Rule Chapter 7035.
Recommendations for clarifying waste classification
1. Modify the current industrial definitions to ensure consistency between those found in both rule and statute.
2. Collect additional data on the types of wastes disposed of in Class III and Industrial Solid Waste landfills to determine the composition of these wastes.
8 CON is the process in which MMSW landfills apply for additional capacity in order to expand (Minn. Statute 115A.917). CON applies only to MMSW landfills.
Greater Minnesota solid waste plan reform
Solid waste plans were established in statute in the early 1970s (and updated significantly in the 1980s with the introduction of the Waste Management Act and adoption of solid waste rules) to provide a foundation and framework for solid waste management in Minnesota.
County plans do many things, including providing the framework for:
• The orderly and deliberate development of solid waste facilities
• Solid waste outreach and education efforts to support the existing local and regional systems
• An assessment of waste generation and opportunities for increased diversion
• An evaluation of the financial needs, policies, goals and strategies to support the system Approved solid waste plans are required for many programs that are important to state and county planners. These programs include solid waste permitting, calculation of landfill capacity needs (Certificate of Need), Environmental Assistance (EA) grants, SCORE grants, and Capital Assistance Program (CAP) grants, solid waste data, policy and research development (e.g., Statewide Waste Composition Study), and development of state and local solid waste policy and legislation.
Since its inception, there have been many changes that have created challenges to the effectiveness of county planning. Counties have seen reductions in the number of staff dedicated to solid waste activities. State staffing levels have also decreased from a high of 6 FTEs to the current level of 2 FTEs located in Duluth and Marshall. These reductions in staff have meant less time is available to develop the most effective, proactive, and innovative plans required to meet state and local polices and requirements.
Greater Minnesota county plans were initially updated every 5 years. As a result of state and local staff and resource challenges, the cycle was increased to 10 years in in the mid-2000s. While this reduced some of the burden and arguably paved the way for an increased focus of time and resources on implementation, the end result was pushing the problem down the road and a greater concentration of plans needing approval at one time. For example, 18 plans are set to be updated in 2023 and 26 plans are set to be updated in 2024.
While the MPCA plans to talk to the counties about ways to streamline the logjam, developing an effective plan takes time and resources. If both the state and counties invest so much time and resources in these documents, and they are crucial to so many of the state and county’s needs, more support and reform needs to occur over the next 4 years.
Using the Metropolitan Solid Waste Policy Plan as a model
The Metropolitan Solid Waste Policy Plan provides comprehensive recommendations for the
development of the solid waste system in the Metro Area. Individual Metro County Master Plans must conform to those polices. Having a common set of solid waste policies leads to a more coordinated
Case study: County-wide curbside recycling in Winona County
In 2012 Winona County became the first to offer county-wide curbside recycling in Greater Minnesota. Recycling participation rose by 50%, to reach 97%. Materials collected increased 60% from 3,000 to 5,000 tons per year. The county also saw a noticeable reduction in wind-related litter with the addition of recycling carts. Education was vastly enhanced with permanent education labels molded into the cart lids.
Current program costs
Curbside at households/small businesses $3.33 per month Multi-family and commercial as needed service $26.40 per stop
Total annual contract costs $852,000
Per capita annual costs $16.56
Tons recycled annually 5,000
Annual pounds per capita recycled 200
What’s in the future?
Winona County is looking to see if they can capture efficiencies through the use of dual collection trucks for rural trash collection and recycling since they are already out there picking up recycling.
system overall for the region. Greater Minnesota solid waste plans do not have a similar guidance document.
A statewide solid waste plan (that the existing Metro Solid Waste Policy Plan could be folded into) would provide a more comprehensive, coordinated framework and vision for solid waste management
throughout Minnesota. The plan would build on information from existing county and regional master plans, waste composition information, and other data and research (e.g., Recycling and Solid Waste Infrastructure Evaluation) and provide policy recommendations that individual and regional county plans would need to be consistent with.
Such a plan would also provide policy recommendations to reform the Greater Minnesota planning structure, including minimum requirements for basic plan development and incentives for counties and regions that go beyond the minimum requirements. By providing a range of planning options and associated incentives, counties that choose to focus on developing a basic plan will invest less time and resources than they currently do, while still focusing on the most important yet basic requirements. A stakeholder group consisting of county solid waste staff and the MPCA would review the existing plan structure and requirements and develop a proposal for a new planning structure. Most importantly, the statewide plan would be based in part on the principles of sustainable materials management, and priorities will focus on materials and practices that yield the greatest environmental benefit vs. a primary focus on discards management.
System accountability needs to be improved and minimum standards established for all counties such as making annual review and work