Revealing the burden of obesity using weight histories
Andrew Stokesa,1and Samuel H. Prestonb,1
aDepartment of Global Health and Center for Global Health and Development, Boston University School of Public Health, Boston, MA 02118; andbDepartment of Sociology and Population Studies Center, University of Pennsylvania, Philadelphia, PA 19104
Contributed by Samuel H. Preston, December 4, 2015 (sent for review August 4, 2015; reviewed by David B. Allison and John Bongaarts)
Analyses of the relation between obesity and mortality typically evaluate risk with respect to weight recorded at a single point in time. As a consequence, there is generally no distinction made between nonobese individuals who were never obese and non-obese individuals who were formerly non-obese and lost weight. We introduce additional data on an individual’s maximum attained weight and investigate four models that represent different com-binations of weight at survey and maximum weight. We use data from the 1988–2010 National Health and Nutrition Examination Survey, linked to death records through 2011, to estimate param-eters of these models. We find that the most successful models use data on maximum weight, and the worst-performing model uses only data on weight at survey. We show that the disparity in pre-dictive power between these models is related to exceptionally high mortality among those who have lost weight, with the nor-mal-weight category being particularly susceptible to distortions arising from weight loss. These distortions make overweight and obesity appear less harmful by obscuring the benefits of remain-ing never obese. Because most previous studies are based on body mass index at survey, it is likely that the effects of excess weight on US mortality have been consistently underestimated.
obesity
|
body mass index|
maximum weight|
mortality|
epidemiologyM
ost studies of the mortality risks of obesity are based on asnapshot. Body mass index (BMI) is recorded once, at the time of the survey, and individuals are followed forward from that point (1–19). As a consequence, there is generally no dis-tinction made between nonobese individuals who were never obese and nonobese individuals who were obese in the past and lost weight. This distinction would be important if individuals who were formerly obese were at higher risk than never-obese individuals. Evidence from the prior literature suggests that such a pattern may exist for at least the following reasons.
First, the effects of obesity may not be felt instantaneously but manifest themselves over time and cumulatively. When multiple observations of BMI in the course of life are introduced into a research design to study mortality, they each have predictive value (20). Similarly, mortality has been shown to be a positive function of the duration of obesity (20–22).
The second reason is that illness can cause weight loss through loss of appetite or increased metabolic demands. This relation-ship may explain why weight losers have been found to have high mortality in a number of studies (20, 23–25). The role of obesity in initiating disease may be obscured or erased altogether in cross-sectional accounts of weight and height that fail to address illness-associated weight loss (26). This type of bias, referred to as confounding by illness or reverse causation, has frequently been cited as a serious obstacle to obtaining unbiased estimates of the association between obesity and mortality (27–37). In contrast, evidence for the occurrence of such bias is said to be weak and inconsistent by other researchers (38–40).
One common strategy for reducing bias from reverse causation is to delay the beginning of analysis until several years after baseline because the bias from reverse causation is thought to be most severe in the early years after survey collection (28, 31). A second strategy is to exclude people with certain chronic condi-tions at baseline (28). The first approach has produced inconsistent
effects (41–43) and may be inadequate in light of evidence that weight loss often begins many years before death (44). A limitation of the second approach is that it fails to capture undiagnosed or subclinical illnesses (44). Both strategies eliminate large propor-tions of observapropor-tions, thereby reducing power and the external validity of results (45). Finally, both approaches risk eliminating observations in which disease is a product of obesity itself, pro-ducing a classic instance of“overadjustment bias”(46).
A recently developed approach that avoids these pitfalls is to replace BMI at survey with one’s maximum historical BMI. Because lifetime maximum BMI is unaffected by disease-associated weight loss, no subjects and no years of exposure need to be excluded to minimize the effects of reverse cau-sality (47).
In this article, we formally investigate the performance of var-ious models of the mortality risks of obesity. We use model se-lection criteria to compare the conventional approach, based on BMI at the time of survey, with alternative models that introduce a central feature of weight history: an individual’s maximum weight. These alternative models address reverse causality and represent enduring effects of past obesity status. We attempt to understand why some models perform better than others by examining age-standardized death rates and by investigating how disease profiles and mortality rates vary across combinations of maximum and survey weight.
Methods
We examined the association between excess weight and mortality using data from the 1988–1994 and 1999–2010 waves of the National Health and Nutrition Examination Survey (NHANES) (48, 49), linked to death certifi-cate records from the National Death Index through 2011 (50). NHANES is a nationally representative survey of the civilian noninstitutionalized pop-ulation of the United States. The survey was carried out periodically until 1999, at which time it became a continuous survey released in 2-y intervals. In addition to an interview component, examinations and laboratory testing
Significance
There is substantial uncertainty about the association between obesity and mortality. A major issue is the treatment of reverse causation, a phrase referring to the loss of weight among people who become ill. Weight histories are vital to addressing reverse causality, but few studies incorporate them. Here we introduce nationally representative data on lifetime maximum weight to distinguish individuals who were never obese from those who were formerly obese and lost weight. We formally investigate the performance of various models, finding that models that incorporate history perform better than the con-ventional approach based on a single observation of weight at the time of survey. We conclude that the burden of obesity is likely to be greater than is commonly appreciated.
Author contributions: A.S. and S.H.P. designed research; A.S. and S.H.P. performed research; A.S. analyzed data; and A.S. and S.H.P. wrote the paper.
Reviewers: D.B.A., University of Alabama at Birmingham; and J.B., Population Council. The authors declare no conflict of interest.
Freely available online through the PNAS open access option.
1To whom correspondence may be addressed. Email: [email protected] or spreston@sas. upenn.edu.
SOCIAL
SCIENCES
MEDICAL
were carried out by trained technicians at mobile examination units. Ex-tensive documentation of NHANES survey and examination procedures is available from the National Center for Health Statistics (51).
A key independent variable in our analysis, lifetime maximum BMI (max BMI) was constructed on the basis of a question in NHANES that asks re-spondents to recall their maximum lifetime weight, excluding weight during pregnancy for women. We combined maximum weight with height mea-sured at survey to construct max BMI. We also calculated BMI at the time of survey (BMI at survey) using data on measured height and weight. Social and demographic variables and smoking status were determined by interview.
We categorized BMI at survey and max BMI using the standard BMI categories developed by the World Health Organization and the National Heart, Lung, and Blood Institute (52, 53). These BMI categories are less than 18.5 kg/m2 (underweight), 18.5–24.9 kg/m2(normal weight), 25.0–29.9 kg/m2(overweight), and 30.0 kg/m2or more (obesity). The latter category was further dis-aggregated into 30.0–34.9 kg/m2(obese class I) and 35.0 kg/m2and above (obese class II).
We restricted the sample to adults aged 50–74 at the time of survey. Older adults were excluded to reduce measurement error in the maximum BMI variable and to reduce the risk for survivor bias, whereby the most suscep-tible obese individuals are selected out of the sample because of premature mortality. Follow-up was censored at age 85 y. Individuals were considered outliers and excluded if their max BMI was in the top 2.5 percentile of the distribution, corresponding to a value of 48.4 kg/m2or above, or the pro-portional difference between their self-reported and measured current BMI placed them in the top 2.5 percentile of reporting error. Use of alternative thresholds for defining outliers produced similar results. Because there were so few individuals whose maximum weight was in the underweight range (5 cases), these observations were not included in the analysis. In the small number of instances in which BMI category at survey exceeded max BMI (208 cases), we used the survey value in place of the maximum value. Among these cases, the median difference in the two values was 1.6 BMI units.
We also excluded ever-smokers, defined as having smoked more than 100 cigarettes in one’s lifetime. Smoking is a complex exposure with multiple dimensions of duration and intensity and is difficult to measure precisely in self-reported data, as comparisons of self-reports with serum cotinine levels make clear (54). A modest amount of measurement error in smoking, combined with the observed inverse association between smoking and BMI, produces a spurious negative relation between obesity and mortality (55). After applying the above exclusion criteria, our final analytic sample con-sisted of 6,276 subjects, among whom 875 died during a median follow-up of 8.0 y.
Cox proportional hazards models with age as the underlying timescale were used to estimate hazard ratios for mortality (56, 57). All models were adjusted for sex, race/ethnicity (non-Hispanic white, non-Hispanic black, Hispanic, other), and educational attainment (less than high school, high school or equivalent, some college or greater).
We estimated the parameters of four models. Model 1 (survey BMI only) uses data only on weight at survey and is the model that most commonly appears in the literature. The reference category in this model included people who were normal weight at survey. Model 2 (maximum BMI only) is similar to model 1 but substituted maximum values for survey values. The
reference category in this model consisted of people who were normal weight at their maximum, regardless of whether they remained normal weight at the time of survey or entered the underweight category.
Models 3 and 4 extend the first two models by combining data on weight at survey and maximum weight. Model 3 (survey BMI extended) differentiates between those in a particular surveyed weight class who had never been in a higher weight class and those in that survey weight class who had formerly been in a higher class. Model 4 (maximum BMI extended) differentiates between those who had reached a particular maximum weight class and remained there and those who had moved to a lower class by the time of survey. The reference category in models 3 and 4 consisted of people who were of normal weight at survey and maximum.
The most complex model that could be estimated using BMI at survey and maximum BMI would investigate all combinations of the two variables. However, this model involves estimating more parameters than is realistic, given the sample size. By grouping weight losers as we have done, we reduce the number of parameters to be estimated to eight, in contrast to the 15 parameters that would be required in the complete model.
We used the Akaike information criterion (AIC) and the Bayesian in-formation criterion (BIC) to compare the performance of the four models (58). They both capture the trade-off between model complexity and goodness of fit by introducing a penalty term for the number of parameters in the model, with the penalty term being larger in BIC than in AIC.
Hazard ratios generated from Cox models do not allow for comparison of mortality levels across different specifications of the BMI variable. To fill in this gap, we calculated age-standardized death rates. Age-standardization was carried out using 5-y age groups in the interval from 50 to 84 y. The standard population was drawn from US 2000 Census data.
We confirmed the proportional hazards assumption by testing the slope of Schoenfeld residuals by BMI category. This study did not require approval
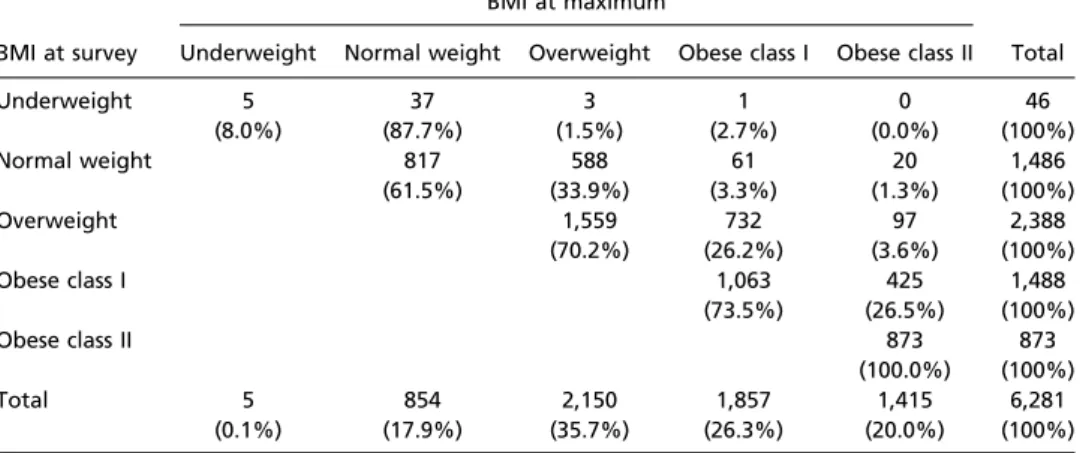
Table 1. BMI at time of survey and at maximum among US never-smoking adults aged 50–74 y, n(%)
BMI at survey
BMI at maximum
Total Underweight Normal weight Overweight Obese class I Obese class II
Underweight 5 37 3 1 0 46 (8.0%) (87.7%) (1.5%) (2.7%) (0.0%) (100%) Normal weight 817 588 61 20 1,486 (61.5%) (33.9%) (3.3%) (1.3%) (100%) Overweight 1,559 732 97 2,388 (70.2%) (26.2%) (3.6%) (100%) Obese class I 1,063 425 1,488 (73.5%) (26.5%) (100%) Obese class II 873 873 (100.0%) (100%) Total 5 854 2,150 1,857 1,415 6,281 (0.1%) (17.9%) (35.7%) (26.3%) (20.0%) (100%)
Underweight, less than 18.5 kg/m2; normal weight, 18.5–24.9 kg/m2; overweight, 25.0–29.9 kg/m2; obese class I, 30.0–34.9 kg/m2; obese class II, 35.0 kg/m2and above. Percentage distributions are weighted.
Table 2. Hazard ratios for mortality from all causes according to BMI at maximum compared to values estimated using BMI at survey
BMI category
Model 1: Survey BMI Model 2: Maximum BMI Estimate 95% CI PValue Estimate 95% CI PValue Underweight 1.70 0.65–4.48 0.277
Normal weight 1.00 1.00
Overweight 1.10 0.87–1.40 0.407 1.19 0.81–1.75 0.362 Obese class I 1.47 1.12–1.95 0.007 1.65 1.14–2.38 0.008 Obese class II 1.72 1.25–2.36 0.001 2.49 1.70–3.64 0.000 CI, confidence interval; underweight, less than 18.5 kg/m2; normal weight, 18.5–24.9 kg/m2; overweight, 25.0–29.9 kg/m2; obese class I, 30.0–34.9 kg/m2; obese class II, 35.0 kg/m2and above. Cox models adjusting for sex, race/ ethnicity, and educational attainment were used to estimate the hazard ratios. In model 2, there is no estimate for the underweight category be-cause of insufficient data. Estimates are weighted and account for complex survey design.
from an ethics committee, as we relied on anonymized secondary data. Analyses were carried out using STATA Version 13 (StataCorp). All estimates were adjusted for the complex survey design of the NHANES, with the ex-ception of AIC and BIC, which were adjusted for sampling weights, but not clustering and stratification. The SVY routine was used to estimate variances. Results
Table 1 shows a cross-classification of individuals according to BMI at survey and maximum lifetime BMI. Summing observa-tions on the diagonal shows that 69% of individuals in the sample were in their maximum BMI class at survey, whereas 31% had previously occupied a higher BMI class. This large volume of downward flows creates a significant opportunity for weight losers to affect the characteristics and survival of people in any particular survey class. The opportunity is especially salient among those of normal weight at survey, where 39% of indi-viduals in the sample had migrated into it from higher classes.
Table 2 presents hazard ratios for the first two models. Model 1, which replicates the approach used most widely in the litera-ture, is based on BMI at the time of survey only. Model 2 is similar but uses maximum values instead of survey values. In both models, each higher BMI category above the normal-weight category carried with it successively higher mortality. However, the degree of excess mortality associated with a particular BMI category was higher when that category referred to maximum weight rather than survey weight.
Tables 3 and 4 present hazard ratios from models 3 and 4. Relative to the reference category in model 3, all other cate-gories showed hazard ratios greater than 1.00. Among those who were in their maximum weight category at survey, hazard ratios rose steadily from 1.12 among the overweight to 2.18 among those in obese class II. Among those who had been in a higher weight category before the survey, hazard ratios were sub-stantially higher than for those who had remained in their highest category at survey. In other words, weight losers had exceptionally high mortality in model 3. Those in a particular weight class at survey can be thought of as consisting of two subgroups: those who were at their maximum weight at the time of survey and a group with much higher mortality who had previously occupied a higher weight class.
Model 4 is similar to model 3, except that weight losers are grouped according to their maximum weight achieved rather than their weight at survey. Tables 3 and 4 show that mortality rose with the highest weight achieved and that those who lost weight after achieving a particular BMI category actually had higher mortality than those who remained at that maximum. If mortality rates were a simple function of time spent in various weight classes, one would expect those losing weight to have a mortality level between those of the classes they occupied.
Instead, weight losers had even higher mortality than those who remained in the higher weight class they previously occupied. This pattern underscores the possibility that reverse causal pro-cesses are at work.
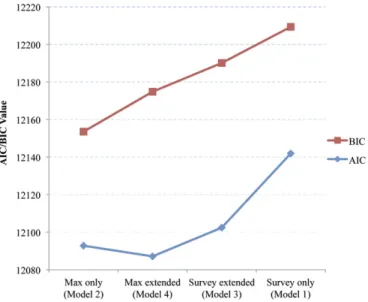
Which of these four models is to be preferred? Results of estimating the AIC and BIC values for the four models are presented in Fig. 1. Lower values on each of these criteria in-dicate a superior model. Results of applying the two criteria were similar. For both criteria, the best performing models introduced information on max BMI. The extended max BMI model was preferred using the AIC criterion, whereas max BMI alone was preferred by BIC, consistent with the fact that BIC imposes a stricter penalty on model complexity. Using either criterion, maximum-only was superior to the survey-only model and max-imum-extended was superior to the survey-extended model. The worst-performing model on both criteria was model 1, in which only BMI at survey was used.
Confining analytic attention to survey BMI alone thus sacri-fices important information provided by an individual’s maxi-mum BMI. The poor performance of the survey-only model is especially salient because models using only BMI at survey dominate the set of findings in the literature on the relation between BMI and mortality.
Differences in hazard ratios between the models in Table 2 are a product of differences in both numerators and denominators.
Table 3. Hazard ratios for mortality for the survey-extended model (model 3)
Survey BMI category
Survey matches maximum
Formerly in higher category Estimate 95% CI PValue Estimate 95% CI PValue
Underweight 2.12 0.82–5.49 0.119
Normal weight 1.00 1.58 1.00–2.48 0.051 Overweight 1.12 0.76–1.64 0.571 2.02 1.32–3.10 0.001 Obese class I 1.61 1.10–2.37 0.015 2.79 1.80–4.33 0.000 Obese class II 2.18 1.46–3.25 0.000
Underweight, less than 18.5 kg/m2; normal weight, 18.5–24.9 kg/m2; over-weight, 25.0–29.9 kg/m2; obese class I, 30.0–34.9 kg/m2; obese class II, 35.0 kg/m2 and above. Cox models adjusting for sex, race/ethnicity, and educational attain-ment were used to estimate the hazard ratios. Estimates are weighted and account for complex survey design.
Table 4. Hazard ratios for mortality for the maximum extended model (model 4)
Max BMI category
Survey matches maximum Currently in lower category Estimate 95% CI PValue Estimate 95% CI PValue Normal weight 1.00 1.57 0.52–4.77 0.424 Overweight 1.12 0.76–1.64 0.572 1.49 0.92–2.41 0.107 Obese class I 1.62 1.10–2.38 0.015 1.81 1.16–2.82 0.009 Obese class II 2.19 1.46–3.27 0.000 3.18 2.09–4.83 0.000 Underweight, less than 18.5 kg/m2; normal weight, 18.5–24.9 kg/m2; over-weight, 25.0–29.9 kg/m2; obese class I, 30.0–34.9 kg/m2; obese class II, 35.0 kg/m2 and above. Cox models adjusting for sex, race/ethnicity, and educational attain-ment were used to estimate the hazard ratios. Estimates are weighted and account for complex survey design.
Fig. 1. AIC and BIC values for models predicting the association between BMI and mortality. On both criteria, a lower value denotes a better-performing model. BIC imposes a stronger penalty on model complexity than AIC.
SOCIAL
SCIENCES
MEDICAL
To cast light on these differences, Table 5 shows age-standard-ized death rates according to both survey BMI and maximum BMI. Values in a particular category of BMI were within 13% of each other, with the exception of those in the normal-weight category. People of normal weight at survey had an age-stan-dardized death rate of 8.11/1,000, whereas individuals who were normal weight at their maximum (including both those who were normal weight and those who were underweight at survey) had a death rate of 6.37/1,000. So the death rate was 27% higher using survey weight than using maximum weight. As shown in Table 1, individuals in the sample who were normal weight at survey had the largest inflow of weight losers as a proportion of the total category, at 39%. This influx of high-mortality individuals raised the death rate of the normal-weight category well above what it would have been if the category contained only individuals whose BMI was never above normal weight.
To illustrate this point, Fig. 2 shows the death rates of indi-viduals who were normal weight at survey according to their maximum weight category. Individuals who were normal weight at max and survey had a death rate of 6.25/1,000 compared with 10.81 and 14.62 among normal-weight individuals who were formerly overweight or obese. Those who transitioned to normal weight from overweight and obese have thus raised the death rate in this category from 6.25/1,000 to 8.11/1,000. This influx into the reference category is the major reason why hazard ratios in Table 2 are much lower when survey BMI is used instead of maximum BMI.
Apart from the normal-weight category, Table 5 shows that the largest distortion from weight loss in any remaining category occurred in the obese class II category. When assessed at survey, this category had lost high-mortality individuals to lower cate-gories but gained none from higher catecate-gories. The result was a death rate for obese class II that was 13% lower using survey weight than maximum weight. The combination of increased mortality in the normal-weight category and reduced mortality in the obese II category produces a much lower hazard ratio for obese II when survey weight is used.
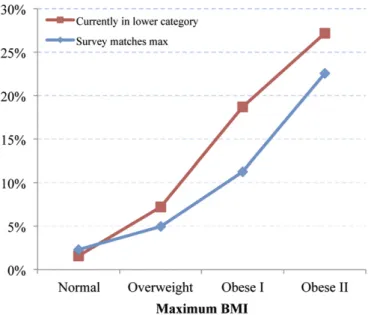
Tables 3 and 4 show that those who achieved a particular maximum BMI category and then lost weight to enter a lower category carried with them mortality even higher than that in the max BMI category that they have left. This pattern suggests that the weight losers may have been selected for high levels of illness. Fig. 3 investigates this relationship. It shows the prevalence of reported diabetes for individuals who have achieved various maximum BMI classes according to whether they remained there or moved to a lower BMI category. Among those currently oc-cupying their maximum weight class, 2.3% of normal-weight individuals were diagnosed with diabetes, a figure that rose monotonically to 22.6% among those in obese class II. Addi-tionally, those who achieved a particular maximum BMI class above normal but subsequently migrated to a lower class had higher diabetes prevalence than those who remained in that class.
Fig. 4 shows a similar relationship with respect to cardiovas-cular disease (CVD). The prevalence of CVD rose systematically from 2.4% among those who were normal weight at max and survey to 10.3% among those currently in the obese class II category. As in the case of diabetes, those who achieved a par-ticular maximum BMI above normal and moved to lower clas-ses had higher CVD prevalence than those who remained in that class.
The high prevalence of both diabetes and CVD among people moving to lower BMI classes demonstrates that weight loss is often associated with illness, helping to confirm the centrality of reverse causality as a source of bias when survey weight alone is used. The movement into the normal-weight category from above is a particular threat to unbiased estimates of hazard ra-tios: 33.9% of individuals in the sample who were normal weight at survey were formerly overweight (Table 1), and this group had three times the prevalence of diabetes and CVD relative to those who were in the normal-weight category at both max and survey. The morbidity patterns are entirely consistent with the mor-tality patterns shown in model 4 of Table 4. Disease prevalence and mortality both rise with increases in maximum BMI and rise even further for those who reach a particular maximum BMI category and then lose weight. These patterns strongly suggest that obesity raises the risk of diabetes and CVD and that, once Table 5. Age-standardized mortality rates per 1,000 person-years by BMI at survey and BMI at max
BMI category
Mortality rate, BMI at survey (95% CI)
Mortality rate, BMI at max (95% CI)
Mortality rate ratio (survey/max) Underweight 13.53 (1.95–25.11) Normal weight 8.11 (6.30–9.93) 6.37 (4.33–8.42) 1.27 Overweight 9.30 (7.71–10.88) 8.27 (6.44–10.10) 1.12 Obese class I 14.16 (11.11–17.21) 12.76 (10.05–15.47) 1.11 Obese class II 15.01 (11.73–18.30) 17.22 (13.92–20.53) 0.87
Underweight, less than 18.5 kg/m2; normal weight, 18.5–24.9 kg/m2; overweight, 25.0–29.9 kg/m2; obese class I, 30.0–34.9 kg/m2; obese class II kg/m235.0 kg/m2above. Mortality rates were age-standardized to the US 2000 Census using 5-y age groups between 50 and 84 y. For maximum BMI, there is no estimate for the underweight because of insufficient data in this category (n=5). Estimates are weighted and account for complex survey design.
Fig. 2. Age-standardized mortality rates for individuals who were normal weight at survey, stratified by maximum BMI. Normal weight, 18.5–24.9 kg/m2; overweight, 25.0–29.9 kg/m2; obese, 30 kg/m2and above (obese classes I and II, pooled). Mortality rates were age-standardized to the US 2000 Census, using 5-y age groups between 50 and 84 y. Estimates are weighted and account for complex survey design.
acquired, these diseases often precipitate weight loss (36). Ironically, that weight loss helps to obscure the role of adiposity in initiating the disease process when survey weight alone is used in the analysis. Only by using weight histories can this pattern of erasure be identified and corrected.
Discussion
We investigated four models predicting mortality that used dif-ferent combinations of maximum BMI and BMI at survey. Using either the AIC or BIC criterion for model selection, we find that the worst-fitting model used only weight at survey. Unfortunately, such a model is used in the large majority of studies of the relation between obesity and mortality (1–19).
The survey-only model fits so poorly because it obscures the distinction between those who never exceeded a particular weight category and those who have moved into that category from a higher weight. The weight losers have exceptionally high mortality: they do not simply carry with them the higher mor-tality levels of higher BMI classes but are negatively selected out of those classes. The normal-weight category is most affected by the influx of individuals from higher weights. This category had a 27% higher death rate when it was based on survey weight than when it was based on maximum weight. This category forms the denominator of all relative risks, and its high death rate when survey BMI is used understates the hazard ratios that are ob-served when a more comprehensive indicator of BMI is used.
Confining analytic attention to survey BMI alone sacrifices important information provided by an individual’s maximum BMI. Such information is incorporated in the remaining three models. Using the BIC criterion, the best-fitting model used only cate-gories of maximum BMI. When AIC is used, the maximum-extended model, in which weight losers are grouped according to their maximum weight, performs slightly better than the
maxi-mum-only model. In both cases, knowledge of one’s maximum
BMI is the central element in successfully predicting mortality. We noted earlier that weight histories contain valuable in-formation about mortality risks for at least two reasons. One is that obesity at a particular age may predispose to illness, re-gardless of weight at higher ages. The second is that weight loss is often associated with illness. These two mechanisms would lead to different patterns of association between weight change and mortality. The first would imply that weight losers would have death
rates between those associated with the different weight classes they have occupied. The second would imply that weight losers have even higher mortality than the higher weight class they first occupied; they would be negatively selected out of that class. Our results suggest that the latter mechanism, commonly referred to as reverse causa-tion, is dominant. Our analysis of diabetes and CVD provides ad-ditional confirmation of the importance of reverse causation: weight losers had a higher prevalence of diabetes and CVD than those remaining in the higher weight class.
These patterns highlight the importance of reverse causality as a bias in estimates of the mortality effects of obesity when those estimates are based on single snapshots of BMI.
A limitation of this study is that lifetime maximum weight was self-reported. However, studies that have assessed the validity of self-reported past weight indicate it is highly correlated with measured weight (59–62). These studies focused on weight recal-led at a particular age or time in the past. Self-reported maximum weight may be subject to less error because the question does not require remembering to a specific age or period in time but simply one feature of a weight trajectory. A future direction for research is to replicate the findings presented here in datasets in which maximum weight can be constructed from contemporaneous data on measured weight over the life course. Efforts should also be made to validate a recall-based measure of maximum weight by introducing the question into surveys with longitudinal designs.
The introduction of historical data in the analysis of smoking occurred more than a half century ago, when studies began to distinguish among current-, former-, and never-smokers. Be-havioral histories clearly matter for mortality, and in the case of obesity, they are especially valuable because of the bias that can result when current status alone is used.
Our results suggest the burden of overweight and obesity on mortality is likely substantially larger than commonly appreci-ated. If correct, this may have serious implications for the future of life expectancy in the United States. Although the prevalence of obesity may level off or even decline, the history of rapidly rising obesity in the last 3 decades cannot be readily erased (63). Successive birth cohorts embody heavier and heavier obesity histories, regardless of current levels. Those histories are likely to exert upward pressure on US mortality levels for many years to come.
Fig. 3. Prevalence of reported diabetes for individuals at their maximum BMI at the time of survey versus individuals below their maximum BMI at time of survey.
Fig. 4. Prevalence of reported CVD for individuals at their maximum BMI at the time of survey versus individuals below their maximum BMI at time of survey.
SOCIAL
SCIENCES
MEDICAL
ACKNOWLEDGMENTS.We are grateful to the reviewers of the manu-script for helpful comments and suggestions. This work was supported by a
grant from the National Institute on Aging at the National Institutes of Health (R01AG040212).
1. Berrington de Gonzalez A, et al. (2010) Body-mass index and mortality among 1.46 million white adults.N Engl J Med363(23):2211–2219.
2. Boggs DA, et al. (2011) General and abdominal obesity and risk of death among black women.N Engl J Med365(10):901–908.
3. Calle EE, Thun MJ, Petrelli JM, Rodriguez C, Heath CW, Jr (1999) Body-mass index and mortality in a prospective cohort of U.S. adults.N Engl J Med341(15):1097–1105. 4. Flegal KM, Graubard BI, Williamson DF, Gail MH (2005) Excess deaths associated with
underweight, overweight, and obesity.JAMA293(15):1861–1867.
5. Flegal KM, Kit BK, Orpana H, Graubard BI (2013) Association of all-cause mortality with overweight and obesity using standard body mass index categories: A systematic review and meta-analysis.JAMA309(1):71–82.
6. Manson JE, et al. (1995) Body weight and mortality among women.N Engl J Med 333(11):677–685.
7. Whitlock G, et al.; Prospective Studies Collaboration (2009) Body-mass index and cause-specific mortality in 900 000 adults: Collaborative analyses of 57 prospective studies.Lancet373(9669):1083–1096.
8. Zheng W, et al. (2011) Association between body-mass index and risk of death in more than 1 million Asians.N Engl J Med364(8):719–729.
9. Allison DB, Fontaine KR, Manson JE, Stevens J, VanItallie TB (1999) Annual deaths attributable to obesity in the United States.JAMA282(16):1530–1538.
10. Cohen SS, et al. (2012) Obesity and all-cause mortality among black adults and white adults.Am J Epidemiol176(5):431–442.
11. Flegal KM, Graubard BI, Williamson DF, Gail MH (2007) Cause-specific excess deaths associated with underweight, overweight, and obesity.JAMA298(17):2028–2037. 12. Gu D, et al. (2006) Body weight and mortality among men and women in China.
JAMA295(7):776–783.
13. Jee SH, et al. (2006) Body-mass index and mortality in Korean men and women. N Engl J Med355(8):779–787.
14. Jarrett RJ, Shipley MJ, Rose G (1982) Weight and mortality in the Whitehall Study.Br Med J (Clin Res Ed)285(6341):535–537.
15. Katzmarzyk PT, Craig CL, Bouchard C (2001) Underweight, overweight and obesity: Relationships with mortality in the 13-year follow-up of the Canada Fitness Survey. J Clin Epidemiol54(9):916–920.
16. McGee DL; Diverse Populations Collaboration (2005) Body mass index and mortality: A meta-analysis based on person-level data from twenty-six observational studies. Ann Epidemiol15(2):87–97.
17. Reeves GK, et al.; Million Women Study Collaboration (2007) Cancer incidence and mortality in relation to body mass index in the Million Women Study: Cohort study. BMJ335(7630):1134.
18. Sorlie P, Gordon T, Kannel WB (1980) Body build and mortality. The Framingham study.JAMA243(18):1828–1831.
19. Yi S-W, Ohrr H, Shin S-A, Yi J-J (July 23, 2015) Sex-age-specific association of body mass index with all-cause mortality among 12.8 million Korean adults: A prospective cohort study.Int J Epidemiol, 10.1093/ije/dyv138.
20. Preston SH, Mehta NK, Stokes A (2013) Modeling obesity histories in cohort analyses of health and mortality.Epidemiology24(1):158–166.
21. Abdullah A, et al. (2011) The number of years lived with obesity and the risk of all-cause and all-cause-specific mortality.Int J Epidemiol40(4):985–996.
22. Mehta NK, et al. (2014) Weight histories and mortality among Finnish adults: The role of duration and peak body mass index.Epidemiology25(5):707–710.
23. Ingram DD, Mussolino ME (2010) Weight loss from maximum body weight and mortality: The Third National Health and Nutrition Examination Survey Linked Mor-tality File.Int J Obes34(6):1044–1050.
24. Myrskylä M, Chang VW (2009) Weight change, initial BMI, and mortality among middle- and older-aged adults.Epidemiology20(6):840–848.
25. Zheng H, Tumin D, Qian Z (2013) Obesity and mortality risk: New findings from body mass index trajectories.Am J Epidemiol178(11):1591–1599.
26. Zajacova A, Ailshire J (2014) Body mass trajectories and mortality among older adults: A joint growth mixture-discrete-time survival analysis.Gerontologist54(2):221–231. 27. Ferrucci L, Alley D (2007) Obesity, disability, and mortality: A puzzling link.Arch
Intern Med167(8):750–751.
28. Hu F (2008) Obesity and mortality.Obesity Epidemiology, ed Hu FB (Oxford University Press, New York), pp 216–233.
29. Lawlor DA, Hart CL, Hole DJ, Davey Smith G (2006) Reverse causality and confounding and the associations of overweight and obesity with mortality.Obesity (Silver Spring) 14(12):2294–2304.
30. Manson JE, Stampfer MJ, Hennekens CH, Willett WC (1987) Body weight and lon-gevity. A reassessment.JAMA257(3):353–358.
31. Metha N (2015) Obesity and mortality.International Encyclopedia of the Social & Behavioral Sciences, ed Wright J (Elsevier, Oxford), 2nd Ed, pp 75–81.
32. Tobias DK, Hu FB (2013) Does being overweight really reduce mortality?Obesity (Silver Spring)21(9):1746–1749.
33. Wannamethee SG, Shaper AG, Walker M (2001) Weight change, body weight and mortality: The impact of smoking and ill health.Int J Epidemiol30(4):777–786. 34. Willett WC, Dietz WH, Colditz GA (1999) Guidelines for healthy weight.N Engl J Med
341(6):427–434.
35. Willett WC, Hu FB, Colditz GA, Manson JE (2005) Underweight, overweight, obesity, and excess deaths.JAMA294(5):551–553.
36. Manson JE, et al. (2007) Estimating the number of deaths due to obesity: Can the divergent findings be reconciled?J Womens Health (Larchmt)16(2):168–176. 37. Willett WC, Hu FB, Thun M (2013) Overweight, obesity, and all-cause mortality.JAMA
309(16):1681.
38. Flegal KM, Graubard BI, Williamson DF, Cooper RS (2011) Reverse causation and ill-ness-related weight loss in observational studies of body weight and mortality.Am J Epidemiol173(1):1–9.
39. Flegal KM, Kalantar-Zadeh K (2013) Overweight, mortality and survival.Obesity (Silver Spring)21(9):1744–1745.
40. Flegal K, Graubard BI, Williamson DF (2005) Underweight, overweight, obesity, and excess deaths: Authors’reply.JAMA294(5):552–553.
41. Allison DB, Faith MS, Heo M, Townsend-Butterworth D, Williamson DF (1999) Meta-analysis of the effect of excluding early deaths on the estimated relationship between body mass index and mortality.Obes Res7(4):342–354.
42. Allison DB, Heo M, Flanders DW, Faith MS, Williamson DF (1997) Examination of“early mortality exclusion”as an approach to control for confounding by occult disease in epidemiologic studies of mortality risk factors.Am J Epidemiol146(8):672–680. 43. Allison DB, et al. (1999) Simulation study of the effects of excluding early deaths on
risk factor-mortality analyses in the presence of confounding due to occult disease: The example of body mass index.Ann Epidemiol9(2):132–142.
44. Alley DE, et al. (2010) Changes in weight at the end of life: Characterizing weight loss by time to death in a cohort study of older men.Am J Epidemiol172(5):558–565. 45. Flegal KM, Graubard BI, Williamson DF, Gail MH (2007) Impact of smoking and
pre-existing illness on estimates of the fractions of deaths associated with underweight, overweight, and obesity in the US population.Am J Epidemiol166(8):975–982. 46. Schisterman EF, Cole SR, Platt RW (2009) Overadjustment bias and unnecessary
ad-justment in epidemiologic studies.Epidemiology20(4):488–495.
47. Stokes A (2014) Using maximum weight to redefine body mass index categories in studies of the mortality risks of obesity.Popul Health Metr12(1):6.
48. US Department of Health and Human Services (1994) Plan and operation of the Third National Health and Nutrition Examination Survey, 1988-94. Series 1: Programs and collection procedures.Vital Heal Stat1(32):1–407.
49. Zipf G, et al. (2010) National health and nutrition examination survey: Plan and op-erations, 1999-2010.Vital Heal Stat1(56):1–37.
50. National Center for Health Statistics, Office of Analysis and Epidemiology. (2009) The Third National Health and Nutrition Examination Survey (NHANES III) Linked Mortality File Matching Methodology (National Center for Health Statistics, Hyattsville, MD).
51. National Center for Health Statistics Survey (2012) Questionnaires, Datasets, and Related Documentation. Available at www.cdc.gov/nchs/nhanes/nhanes_questionnaires.htm. Accessed June 1, 2015.
52. National Heart, Lung, and Blood Institute (1998) Clinical Guidelines on the Identifi-cation, Evaluation, and Treatment of Overweight and Obesity in Adults: The Evidence Report.Obes Res6:51S–209S.
53. World Health Organization (2000) Obesity: Preventing and managing the global epidemic. Report of a WHO consultation. WHO Technical Report Series 894 (World Health Organization, Geneva).
54. Stram DO, Huberman M, Wu AH (2002) Is residual confounding a reasonable expla-nation for the apparent protective effects of beta-carotene found in epidemiologic studies of lung cancer in smokers?Am J Epidemiol155(7):622–628.
55. Renehan AG, Leitzmann MF, Zwahlen M (2012) Re: Body mass index and risk of lung cancer among never, former, and current smokers.J Natl Cancer Inst104(21):1680–1681. 56. Cox D (1972) Regression models and life tables.J R Stat Soc, B34(2):187–220. 57. Korn EL, Graubard BI, Midthune D (1997) Time-to-event analysis of longitudinal
fol-low-up of a survey: Choice of the time-scale.Am J Epidemiol145(1):72–80. 58. Burnham KB, Anderson DR (2003)Model Selection and Multimodel Inference: A
Practical Information-Theoretic Approach(Springer, New York), 2nd Ed.
59. Casey VA, et al. (1991) Long-term memory of body weight and past weight satis-faction: A longitudinal follow-up study.Am J Clin Nutr53(6):1493–1498. 60. Rhoads GG, Kagan A (1983) The relation of coronary disease, stroke, and mortality to
weight in youth and in middle age.Lancet1(8323):492–495.
61. Stevens J, Keil JE, Waid LR, Gazes PC (1990) Accuracy of current, 4-year, and 28-year self-reported body weight in an elderly population.Am J Epidemiol132(6):1156–1163. 62. Perry GS, Byers TE, Mokdad AH, Serdula MK, Williamson DF (1995) The validity of
self-reports of past body weights by U.S. adults.Epidemiology6(1):61–66.
63. Ogden CL, Carroll MD, Kit BK, Flegal KM (2014) Prevalence of childhood and adult obesity in the United States, 2011-2012.JAMA311(8):806–814.