International Journal of Emerging Technology and Advanced Engineering
Website: www.ijetae.com (ISSN 2250-2459,ISO 9001:2008 Certified Journal, Volume 3, Issue 11, November 2013)
362
Application of Data Mining Techniques to Model Breast Cancer
Data
S. Syed Shajahaan1, S. Shanthi2, V. ManoChitra3 1
Department of Information Technology, Rathinam Technical Campus, Anna University, Coimbatore. 2,3
Department of Computer Science & Engineering, Rathinam Technical Campus, Anna University, Coimbatore
Abstract — Breast cancer poses a serious threat and is the
second leading cause of death in women today and most common cancer in developed countries. As breast cancer recurrence is high, good diagnosis is important. Many studies have been conducted to analyze Breast Cancer Data. In this work, we explore the applicability of decision trees to predict the presence of breast cancer. Also it analyzes the performance of conventional supervised learning algorithms viz. Random tree, ID3, CART, C4.5 and Naive Bayes. Experimental results prove that Random Tree serves to be the best one with highest accuracy.
Keywords— Data Mining, Breast Cancer, Decision Trees, Classification, Prediction
I. INTRODUCTION
Data mining is a technique which is used to find new, hidden and useful patterns of knowledge from large databases. There are several data mining functions such as Concept descriptions, Association Rules, Classification, Prediction, Clustering and Sequence discovery to find the useful patterns. It is the process of discovering new patterns from large data sets involving methods from statistics and artificial intelligence and also database management. Data mining concept is actually part of the knowledge discovery process.
Classification is a supervised Machine Learning technique which assigns labels or classes to different objects or groups. Classification is a two step process: First step is model construction which is defined as the analysis of the training records of a database. Second step is model usage, the constructed model is used for classification. The classification accuracy is estimated by the percentage of test samples or records that are correctly classified.
Breast cancer occurs when a malignant tumor originates in the breasts. It occurs in both men and women. Breast cancers are potentially life-threatening malignancies that develop in one or both breasts. The interior of the female breast consists mostly of fatty and fibrous connective tissues. Breast cancer is not just a woman's disease. It is quite possible for men to get breast cancer, although it occurs less frequently in men than in women.
About 1 in 8 (12%) women will develop invasive breast cancer during their lifetime. Worldwide it is the fifth most common cause of cancer death.is the leading cause of cancer deaths among women ages 40—59.Factors that influence breast cancer are stage at diagnosis, age, genetic factors and family history. These factors of breast cancer can be used for developing a classification model.
This paper focuses on how data mining techniques are applied to predict breast cancer in Wisconsin data set. The study of related works are presented in section II. Section III tells about methods and materials which includes description about dataset, system design, supervised learning algorithms. The experimental results are described in section IV and finally section V gives the conclusion of the paper.
II. RELATED WORKS
H.S.Hota [5] built a classification model using various intelligent techniques such as ANN(Artificial Neural Network),Unsupervised Artificial Neural Network, Statistical technique and decision tree. Experimental results show a testing accuracy of 97.73% from which the efficiency of the ensemble model was highlighted.
S.VijayaRani et.al [14] studied about classification rule algorithm and analyzed the performance of c4.5, RIPPER and PART algorithm. Time and Number of rules generated were taken as the measures to analyze Breast cancer Wisconsin data and heart disease data. The author concludes that PART algorithm is best suited for the above said data.
S.Anumith et.al [2] proposed an improvised ID3 algorithm for building an accurate decision tree in reduced time using StepDisc, ReliefF, Forward Logit, Backward Logit and Fisher Filtering. Experimental data prove that error rate was reduced using ReliefF feature selection algorithm and accuracy is improved by building a decision tree of five levels.
A modest AdaBoost algorithm was proposed by Jaree Thongkam et.al [6] to extract breast cancer survivability patterns using K-means, Relief and modest adaboost. The performance measures analyzed were accuracy, sensitivity and specificity.
International Journal of Emerging Technology and Advanced Engineering
Website: www.ijetae.com (ISSN 2250-2459,ISO 9001:2008 Certified Journal, Volume 3, Issue 11, November 2013)
363 From the computational results the author demonstrated the effectiveness of modest Adaboost algorithm to achieve better classification accuracy.
A study on classification using feed forward artificial network was made by F.Paulin et.al [8] to evaluate Wisconsin breast cancer data. Many training algorithms like Back Propagation Network was used to train the network. Among that Levenberg Marquadt algorithm showed highest accuracy of 99.28%.Thus the author increased the accuracy of classification of breast cancer.
In March 2009, Shukla et.al [11] examined a knowledge based system for early diagnosis of breast cancer using Artificial Neural Networks(ANN) and Neuro fuzzy system. The performance measures considered were accuracy of diagnosis, training time, No. of neurons and No. of epochs. Simulation results show that this knowledge based system enhanced the survival rates effectively.
In Nov 2012, a system which detects the cancer stage as benign or malignant using Adaptive Resonance Theory (ART2)neural network was proposed by Sonia Narang et.al [12]. Neural network approach was adopted to handle Wisconsin breast cancer data. As it is a continuous data clustering was applied to extract knowledge and performance measures such as precision, recall and accuracy was analyzed. From the results it has been observed that using ANN model accuracy rate could be improved.
Palmena Andreeva et.al [9] made a comparative study of different learning models used in data mining and provided some practical guidelines to select an algorithm for a specific medical application. Many classification algorithms were applied for breast cancer, diabetes and iris data. Among various classification algorithms Bayesian classification and SMO served with highest accuracy.
Abdullah H. wahbeh et.al [1] conducted a research on comparison of four data mining tools namely weka, orange, tanagra, KNIME for classification purpose. In order to judge the toolkits nine different datasets were used by them. Results concluded Weka toolkit was the best one in terms of classifiers applicability issue.
An ensemble model was constructed by Pushpalatha Pujari et.al. [10] for improving classification accuracy by combining the prediction of multiple classifiers.
The performance measures gain,accuracy,specificity and sensitivity were analyzed to handle ionosphere data using CART,CHAID and QUEST classification algorithm. From the experimental results they concluded the ensemble model with feature selection achieved highest accuracy of 93.84% on test data.
D.Lavanya et.al [7] Proposed a hybrid approach and found out that by cascading classification with some data mining task improved classification accuracy. This approach was compared with Feature selection, classification with clustering and without feature selection in terms of accuracy. The experimental results show hybrid approach was much better than CART with feature selection and it was recommended as the best classifier for breast cancer data.
In this paper, a comparative study of various supervised learning algorithms are made to best predict the breast cancer dataset.
III. METHODS AND MATERIALS
To classify breast cancer Wisconsin data set with high accuracy and efficiency, supervised learning algorithms viz. Random tree, ID3, CART, C4.5 and Naive Bayes are used. Data pre-processing is performed using SPSS tool and the missing values are replaced using Linear Interpolation Method. In this paper TANAGRA and WEKA data mining tools are used for modeling breast cancer data. These are open source data mining software mainly used for academic and research purposes. It proposes several data mining methods from exploratory data analysis, statistical learning, machine learning and database.
A. Training Data set Description
Wisconsin Breast cancer data set used in this paper is collected from university of Wisconsin hospitals, Madison Dr.William H.Wolberg. He had introduced 699 instances with 10 attributes[17]. The class distribution is framed as Benign and malignant. There are 1 dependent variable and 9 independent variables. The values for the independent variables ranges from 1 - 10 and for class variable 2 for Benign and 4 for malignant tumor. The minimum possibilities for a person to get breast cancer is 1 and the maximum possibilities are represented by the value 10.
International Journal of Emerging Technology and Advanced Engineering
Website: www.ijetae.com (ISSN 2250-2459,ISO 9001:2008 Certified Journal, Volume 3, Issue 11, November 2013)
364
Table I
TRAINING DATASET DESCRIPTION
B. System Design
This section describes various steps involved in building the new classification model. Figure 1 depicts the system framework of the proposed system.
Figure 1. System Framework of Proposed System Attribute Name Description Categor y Range Values SCNo Sample Code Number Id - CT Clump Thickness Ordinal 1-10 UCSIZE Uniformity of Cell Size Ordinal 1-10 UCSHAPE Uniformity of Cell Shape Ordinal 1-10
MAF
Marginal Adhesion Fibrous: Fibrous bands tissue that form between two surfaces
Ordinal 1-10
ECSIZE
Epithelial Cell Size : Size of a single cell that forms tissues that lines the outside of the body and the passageways that lead to or from the surface
Ordinal 1-10
BN Bare Nuclei Ordinal 1-10 BC for the presence of Bare bodies Bland Chromatin: Evaluates Ordinal 1-10 NN Normal Nucleoli Ordinal 1-10 M Mitoses: Cell growth Ordinal 1-10 Dia Diagnosis of tumours Class 2,4
Model Evaluation Accuracy, Precision, Recall Knowledge Base
Rules from best Classifier Training Data
Breast cancer Data set
Pre-Processing the data
Handling Missing Value
Linear Interpolation Classification Model ID3,Rndtree,C4.5,CART, NaiveBayes Test Data Predicted Patterns Prediction Model Best Classifier
International Journal of Emerging Technology and Advanced Engineering
Website: www.ijetae.com (ISSN 2250-2459,ISO 9001:2008 Certified Journal, Volume 3, Issue 11, November 2013)
365 Initial step is to clean the collected data which is represented as preprocessing step. The data set is preprocessed to improve the quality of data. The raw data contains many missing values. In order to handle the missing values Linear Interpolation method is used. By applying various classifiers the dataset is analyzed. The accuracy measures such as Precision and recall are used to evaluate the performance of the classifiers.
C. Supervised Learning Algorithms
The supervised learning algorithms used for classifying the breast cancer data are as follows.
1) C4.5
C4.5 was developed by Quinlan Ross which is an extension to ID3[16]. It is mainly used for generating decision tree. The splitting area defined here is gain ratio. C4.5 classification uses entropy and information gain for tree splitting. It is suitable for handling both categorical as well as continuous data. A threshold value is fixed such that all the values above the threshold are not taken into consideration. The initial step is to calculate information gain for each attribute. The attribute with the maximum gain will be preferred as the root node for the decision tree.
Given a set S of cases, C4.5 first grows an initial tree using the divide-and-conquer algorithm as follows: [16]
• If all the cases in S belong to the same class or S is small, the tree is a leaf labeled with the most frequent class in S.
• Otherwise, choose a test based on a single attribute with two or more outcomes. Make this test the root of the tree with one branch for each outcome of the test, partition S into corresponding subsets S1, S2,... according to the outcome for each case, and apply the same procedure recursively to each subset.
2) Iterative Dichotomizer (ID3)
ID3 is a simple decision learning algorithm, developed by J.Ross Qunilan. It accepts only categorical data for building a model. The basic idea of ID3 is to construct a decision tree by employing a top down greedy search through the given sets of training data to test each attribute at every node. It uses statistical property known as information gain to select which attribute to test at each node in the tree. Information gain measures how well a given attribute separates the training samples according to their classification. [4] ) ( log ) ( 2 1 i m i i p p D Info
3) Classification and Regression (CART)
The expansion of CART is Classification and Regression trees. The main characteristics of CART are its ability to generate regression trees.
CART uses Gini index as the attribute selection measure. CART is capable of handling both numerical and categorical variables. Gini index measures how well a given attribute separates training samples into targeted class. Here binary splitting of attributes take place. It is most widely used statistical procedure. It provides a hierarchy of univariate binary decision. The CART monograph focuses most of its discussion on the Gini rule, which is similar to the better known entropy or information-gain criterion. It is given as, [4]
n j p j D gini 1 2 1 ) ( 4) Random Tree
Random Tree is a supervised Classifier developed by Brieman. It is an ensemble learning algorithm that generates many individual learners. It employs a bagging idea to produce a random set of data for constructing a decision tree. In standard tree each node is split using the best split among all variables. In a random forest , each node is split using the best among the subset of predicators randomly chosen at that node.
5) Naive Bayes
Naive Bayes Classifier is a probabilistic model based on Baye's theorem. It is defined as a statistical classifier. It is one of the frequently used method for supervised learning. It provides an efficient way of handling any number of attributes or classes which is purely based on probabilistic theory. Bayesian classification provides practical learning algorithms and prior knowledge on observed data.[4]
Let X be a data sample : class label is unknown Let H be a hypothesis that X belongs to class C Classification is to determine P(H|X), (i.e.,
posteriori probability): the probability that the hypothesis holds given the observed data sample X P(H) (prior probability): the initial probability P(X): probability that sample data is observed P(X|H) (likelihood): the probability of observing
the sample X, given that the hypothesis holds training data X, posteriori probability of a
hypothesis H, P(H|X), follows the Baye's theorem ) ( / ) ( ) | ( ) ( ) ( ) | ( ) | ( X X X X X P H P H P P H P H P H P
International Journal of Emerging Technology and Advanced Engineering
Website: www.ijetae.com (ISSN 2250-2459,ISO 9001:2008 Certified Journal, Volume 3, Issue 11, November 2013)
366 6) Accuracy Measures
Accuracy measure represents how far the set of tuples are being classified correctly.TP refers to positive tuples and TN refers to negative tuples classified by the basic classifiers [15]. Similarly FP refers to positive tuples and FN refers to negative tuples which is being incorrectly classified by the classifiers. The accuracy measures used here are precision and recall. [15]
Precision =
FP
TP
TP
Recall =FN
TP
TP
Accuracy =FN
FP
TN
TP
TN
TP
IV. EXPERIMENTAL RESULTS
The experimental results of basic classifiers are dicussed in this section using the data mining tool Tanagra [13]. Breast cancer data contains tumours which represents the severity of the disease. The two kinds of tumours are benign and malignant. To classify them correctly from the training data set the error rates and accuracy using classifiers are evaluated. The error rates of ID3 and Randomtree are given in Figure 2 & Figure 3.
Figure 2:Error Rate of ID3
Figure 3:Error Rate of Random tree
The error rates of various classifiers are compared and shown in figure 4.
Figure 4: Basic Classifiers Error Rate
From Figure 4 it could be observed that the random tree classifier has least error rate when compared with other basic classifiers in predicting breast cancer. The error rates and accuracies of each classifier are listed in Table II. Among them Random tree sounds better with 0 error rate and 100% accuracy. From this result we can infer that out of all classifiers random tree suits best for predicting breast cancer data.
Table II
Basic Classifiers With Error Rate And Accuracy
Figure 5.Accuracy of Basic Classifiers
The accuracies of various classifiers are compared and shown in Figure 5.
Classifier
Name Error Rate Accuracy
ID3 0.0732 92.99
C4.5 0.0381 95.57
CART 0.0454 92.42
Random tree 0.000 100
International Journal of Emerging Technology and Advanced Engineering
Website: www.ijetae.com (ISSN 2250-2459,ISO 9001:2008 Certified Journal, Volume 3, Issue 11, November 2013)
367
Table III.
Classifiers With Precision And Recall Values attributes are analysed to identify the error rates and The Breast cancer data with 683 tuples and 10 different
accuracy. In Table III the accuracy measures precision and recall explains the result of test data set. Figure 6 describes
the accuracy rate of each classifier respectively.
Figure 6. Accuracy of Basic Classifiers
Figure 7: Decision Tree using Random tree algorithm
Classifier Name Precision Recall Benign Maligna nt Benign Malignant ID3 0.9713 0.8566 0.9144 0.9498 C4.5 0.9953 0.9294 0.9629 0.9129 CART 0.9631 0.9292 0.9617 0.9331 Random tree 1.0000 1.0000 1.0000 1.0000 Naive Bayes 0.9778 0.9277 0.9607 0.9585
International Journal of Emerging Technology and Advanced Engineering
Website: www.ijetae.com (ISSN 2250-2459,ISO 9001:2008 Certified Journal, Volume 3, Issue 11, November 2013)
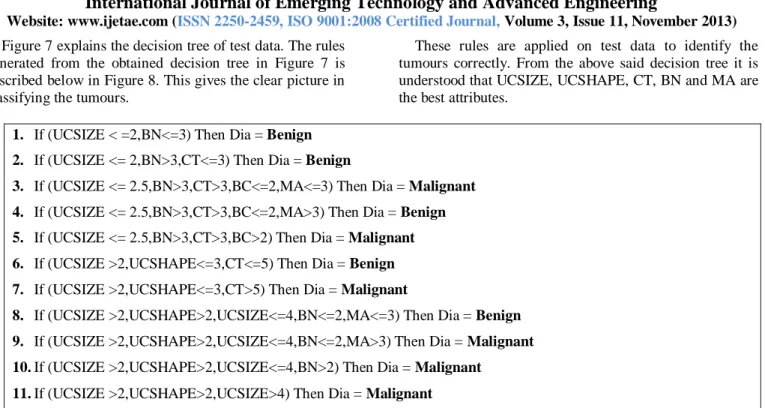
368 Figure 7 explains the decision tree of test data. The rules generated from the obtained decision tree in Figure 7 is described below in Figure 8. This gives the clear picture in classifying the tumours.
These rules are applied on test data to identify the tumours correctly. From the above said decision tree it is understood that UCSIZE, UCSHAPE, CT, BN and MA are the best attributes.
1. If (UCSIZE < =2,BN<=3) Then Dia = Benign 2. If (UCSIZE <= 2,BN>3,CT<=3) Then Dia = Benign
3. If (UCSIZE <= 2.5,BN>3,CT>3,BC<=2,MA<=3) Then Dia = Malignant 4. If (UCSIZE <= 2.5,BN>3,CT>3,BC<=2,MA>3) Then Dia = Benign 5. If (UCSIZE <= 2.5,BN>3,CT>3,BC>2) Then Dia = Malignant 6. If (UCSIZE >2,UCSHAPE<=3,CT<=5) Then Dia = Benign 7. If (UCSIZE >2,UCSHAPE<=3,CT>5) Then Dia = Malignant
8. If (UCSIZE >2,UCSHAPE>2,UCSIZE<=4,BN<=2,MA<=3) Then Dia = Benign 9. If (UCSIZE >2,UCSHAPE>2,UCSIZE<=4,BN<=2,MA>3) Then Dia = Malignant 10.If (UCSIZE >2,UCSHAPE>2,UCSIZE<=4,BN>2) Then Dia = Malignant
11.If (UCSIZE >2,UCSHAPE>2,UCSIZE>4) Then Dia = Malignant
Figure 8: Rules generated from Decision Tree
Thus from the above all results it is shown clearly that random tree algorithm gives the best accuracy for the breast cancer dataset of 683 records
V. CONCLUSION
In this research various supervised learning algorithms are compared to predict the best classifier. Experimental results shows the effectiveness of the proposed method. Model is also evaluated using precision and recall. It is found that among various classification techniques random tree outperforms of all other algorithms with highest accuracy rate. Therefore an efficient classifier is identified to determine the nature of the disease which is highly essential in a clinical investigation of life threatening disease like breast cancer.
REFERENCES
[1] Abdulah H.Wahbeh, Qasem A. Al -Radaideh, Mohammed N. Al-Kabi, and Emad M.Al-Shawakfa,"A Comparison Study between Data Mining Tools over some Classification Methods",International Journal of Advanced Computer Science and Applications.
[2] S. Anumitha, S. Diana, D. Suganya and S. Shanthi,"Improvisation of ID3 Algorithm Explored on Wisconsin Breast Cancer Dataset", International Conference on Computing and Control Engineering",12 &13 April 2012, ISBN:978-1-4675-2248-9 published by Coimbatore Institute of Technology.
[3] Gouda I.Salama,M.B.Abdelhalim and Magdy Abd -elghany Zeid,"Breast Cancer Diagnosis on Three Different Datasets Using Multi-Classifiers",International Journal of Computer and Information Technology,ISSSN:2277-0764,Vol.1,Issue 1,September 2012.
[4] Han J .and Kamber, M.,―Data mining: concepts and techniques‖,Academic Press, ISBN 1- 55860-489-8.
[5] H.S.Hota,"Diagnosis of Breast Cancer Using Intelligent Techniques", International Journal of Emerging Science and Engineering, ISSN:2319-6378,Vol.1,Issue 3,January 2013. [6] Jaree Thongkam,Guandong Xu,Yanchun Zhang and Fuchun Huang,
"Breast Cancer Survivability via AdaBoost Algorithms", School of Computer Science and Mathematics, Victoria University, Melbourne, Australia.
[7] D.Lavanya and K.Usha Rani,"A hybrid Approach to Improve Classification with Cascading of Data Mining Tasks",International Journal of Application or Innovation in Engineering & Management, ISSN:2319-4847,Vol.2,Issue 1,January 2013.
[8] F.Paulin and A.Santhakumaran,"Classification of Breast Cancer by Comparing Back Propagation training Algorithms", International Journal of Computer Science and Engineering, ISSN:0975-3397,Vol.3 No.1 Jan 2011.
[9] Plamena Andreeva,Maya Dimitrova and Petia Radeva,"Data Mining Learning Models and Algorithms for Medical Application". [10] Pushpalatha Pujari and Jyoti Bala Gupta,"Improving Classification
Accuracy by Using Feature Selection and Ensemble Model",International Journal of Soft Computing and Engineering, ISSN:2231-2307,Vol.2,Issue 2,MAy 2012.
International Journal of Emerging Technology and Advanced Engineering
Website: www.ijetae.com (ISSN 2250-2459,ISO 9001:2008 Certified Journal, Volume 3, Issue 11, November 2013)
369 [11] A.Shukla,R.Tiwari and P.Kapur, "Knowledge based approach for
diagnosis of breast cancer", Advance Computing Conference ,2009. IACC, 6 & 7March 2009. E-ISBN:978-1-4244-2928-8, published in IEEE xplore digital library.
[12] Sonia Narang,Harsh K Verma and Uday Sachdev,"Breast Cancer Detection using ART2 Model of Neural Networks", International Journal of Computer Applications, ISSN:0975-8887, Vol.57- No.5,November 2012.
[13] Tanagra data mining tutorials, http://data-mining-tutorials.blogspot.com.
[14] S.Vijayarani and M.Divya,"An Efficient Algorithm for Generating Classification Rules", International Journal of Computer Science and Technology,Vol.2,Issue 4, Oct - Dec.2011.
[15] www.cs.iastate.edu/~jtian/cs573/WWW/Lectures/lecture06-ClassifierEvaluation-2up.pdf, Classifier Evaluation Techniques. [16] Xindong Wu ,Vipin Kumar ,J. Ross Quinlan, et al.,‖ Top 10
algorithms in data mining‖, Knowledge Information System, Vol.14, pp.1–37.