Andrzej and Boczkal, Sonia (2017) On the evolution of microstructure
and texture in commercial purity titanium during multiple passes of
incremental equal channel angular pressing (I-ECAP). Materials Science
and Engineering A: Structural Materials: Properties, Microstructure and
Processing, 699. pp. 31-47. ISSN 0921-5093 ,
http://dx.doi.org/10.1016/j.msea.2017.05.040
This version is available at https://strathprints.strath.ac.uk/60774/
Strathprints
is designed to allow users to access the research output of the University of
Strathclyde. Unless otherwise explicitly stated on the manuscript, Copyright © and Moral Rights
for the papers on this site are retained by the individual authors and/or other copyright owners.
Please check the manuscript for details of any other licences that may have been applied. You
may not engage in further distribution of the material for any profitmaking activities or any
commercial gain. You may freely distribute both the url (https://strathprints.strath.ac.uk/) and the
content of this paper for research or private study, educational, or not-for-profit purposes without
prior permission or charge.
Any correspondence concerning this service should be sent to the Strathprints administrator:
[email protected]
The Strathprints institutional repository (https://strathprints.strath.ac.uk) is a digital archive of University of Strathclyde research outputs. It has been developed to disseminate open access research outputs, expose data about those outputs, and enable the
Contents lists available atScienceDirect
Materials Science & Engineering A
journal homepage:www.elsevier.com/locate/msea
On the evolution of microstructure and texture in commercial purity
titanium during multiple passes of incremental equal channel angular
pressing (I-ECAP)
Muhammad Jawad Qarni
a,⁎, Giribaskar Sivaswamy
a, Andrzej Rosochowski
b, Sonia Boczkal
caAdvanced Forming Research Centre (AFRC), University of Strathclyde, Inchinnan, Renfrewshire PA4 9LJ, UK bDesign, Manufacture and Engineering Management (DMEM), University of Strathclyde, Glasgow G1 1XJ, UK cInstitute of Non-Ferrous Metals in Gliwice, Light Metals, Division, ul. Pilsudskiego 19, 32-050 Skawina, Poland
A R T I C L E I N F O
Keywords:Commercially pure titanium
Incremental equal channel angular pressing (I-ECAP)
Grain refinement
Electron back scatter diffraction (EBSD) Twinning
Continuous dynamic recrystallization (CDRX)
A B S T R A C T
This paper presents an investigation on the evolution of microstructure and deformation characteristics of commercial purity Titanium (CP-Ti) during incremental equal channel angular pressing (I-ECAP). CP-Ti grade 2 was subjected to six passes at 300 °C following route BC, using a die with channel angle of 120°. Electron
backscatter diffraction (EBSD) technique was used to characterize the microstructure afterfirst, second, fourth and sixth pass, in theflow and transverse plane of the samples. Texture development through subsequent processing was also investigated using polefigures in both planes. Followingfirst pass, the grain boundary maps across bothflow and transverse plane showed a high degree of heterogeneity in grain morphology with the presence of elongated andfine grains. Also, misorientation peaks associated with {1012} tensile twins and a small fraction of {1122} compressive twins were observed in the microstructure. After second pass, microstructure was further refined and the twinning activity was greatly reduced with no noticeable activity after the fourth pass. Remarkable grain refinement was achieved after sixth pass with majority of grains in the ultrafine grain (UFG) range and with a relatively homogenous microstructure. Continuous dynamic recrystallization (CDRX) has been observed during subsequent I-ECAP processing. It was seen that twinning alongside CDRX acted as a dominant grain refinement mechanism during the initial passes of I-ECAP process beyond which slip was dominant deformation behaviour.
1. Introduction
Titanium alloys such as Ti-6Al-4V are being widely used in biomedical industry for its excellent corrosion resistance and mechan-ical performance[1,2]. However, alloying elements such as aluminium and vanadium can be toxic in the long term and are therefore undesirable for full bio-integration[3]. Due to its superior bio-compat-ibility, commercially pure Titanium (CP-Ti) is an attractive option, though limited strength of CP-Ti restricts its usage in most medical implants. An effective solution to improve the mechanical strength and performance of CP-Ti, is by grain refinement and achieving ultrafine grain (UFG) microstructure through severe plastic deformation (SPD). To date, strengthening of various metals via grain refinement has been demonstrated by numerous studies[4,5].
Equal channel angular pressing (ECAP) is by far the most promising SPD technique available. It is capable of producing bulk UFG materials, large enough for practical applications[6]. Developed by Segal et al.
[7], the technique involves pressing a billet through a die that consists of two channels with equal cross-sections, intersecting at an angle (Φ). As the billet passes through the intersection, it is subjected to simple shear, while retaining the original cross-sectional area. The same billet can therefore be passed through the die multiple times, in order to impart desired level of plastic strain. The billet is usually rotated about its longitudinal axis between the passes, creating different ECAP routes
[8]. Four distinct processing routes have been identified for use in ECAP
[9]. These routes are designated as route A, route BA, route BCand route C. Route A in which the billet is processed repetitively without any rotation, route BAin which the billet is rotated by 90° clock wise and counter clock wise alternatively between consecutive passes, route BC in which the billet is rotated by 90° in the same direction between consecutive passes and route C in which the billet is rotated by 180° between passes. Each route has a different shearing pattern and characteristic which subsequently effects the resulting microstructure
[10].
http://dx.doi.org/10.1016/j.msea.2017.05.040
Received 9 January 2017; Received in revised form 8 May 2017; Accepted 10 May 2017
⁎Corresponding author.
E-mail address:[email protected](M.J. Qarni).
Available online 20 May 2017
0921-5093/ © 2017 The Author(s). Published by Elsevier B.V. This is an open access article under the CC BY license (http://creativecommons.org/licenses/BY/4.0/).
ECAP has been applied on CP-Ti for the purposes of refining the grain structure and subsequently improving its strength. UFG structure in CP-Ti, not only improves the yield and tensile strength[11–16]but also improves fatigue behaviour and corrosion resistance considerably
[17,18]. Titanium has a hexagonal closed packed (HCP) structure at room temperature. Compared to face-centred cube (FCC) and body-centred cube (BCC) metals, it is regarded as‘hard-to-deform’because of its poor ductility. This presents significant challenges in processing by ECAP, as it is susceptible to cracking or failure during processing[19]. The inferior deformability, is mainly due to the limited slip systems available in HCP structure. The most common slip modes are the prismatic (1010), pyramidal (1011) and basal (0001) planes along the < 1120 > slip direction[20]. The three slip planes combined with the slip vector constitute a total of four slip systems. However, five independent slips systems are required to satisfy the von Mises criteria
[21]. To accommodate plastic strain during deformation, Ti exhibits various twinning alongside dislocation slip in response to tensile and compressive loading[22]. Therefore, twinning is an important defor-mation mechanism in CP-Ti. The most observed twins in CP-Ti are: {1011} and {1012} also known as compression and tensile twin, respectively[23–25]. The deformation behaviour of CP-Ti during ECAP is complex and is expected to be different from the cubic materials as it involves both slip and twinning.
Various studies have been performed to describe the microstructure and deformation mechanism during ECAP in CP-Ti. These studies have mainly used transmission electron microscopy (TEM) for investigation. For example, Stolyarov et al.[26]studied the influence of various ECAP processing routes on the grain refinement of CP-Ti. Experiments using Φ=90° die angle and temperature range of 400–450 °C, it was reported that route BC is the most effective for grain refinement, yielding equiaxed grains in sub-micrometre range compared to route BAand C. Kim et al.[27]studied the deformation mechanism of CP-Ti during
first pass of ECAP at 350 °C. TEM micrograph displayed very thin elongated bands of 80 nm in width. Detailed analysis of these bands revealed {1011} twin characteristics. It was concluded that {1011} twinning played a critical role in plastic deformation during thefirst pass of ECAP. Later on, the results were also confirmed by higher resolution electron microscopy (HREM)[28]. Shin et al.[29], using the same die and processing conditions, showed that prismaslip was the main deformation mechanism in CP-Ti grade 2 after second pass with route B. In a later work by Kim et al. [30], the effect of processing temperature on the microstructure was also studied. It was revealed that the deformation mechanism in CP-Ti grade 2 was strongly dependent on processing temperature. For example, pressing done at 200 °C resulted in thin parallel bands where slip was the dominant mechanism, though it is not clear if the use of such low temperature produced defect free billets. In contrast, processing at 350 °C {1011} twinning was found to be more dominant. Moreover, pressing at 600 °C showed some evidence of dynamic recovery and recrystallization alongside twinning.
Some recent studies have utilized electron backscatter diffraction (EBSD) technique to investigate the microstructure in CP-Ti during ECAP. Chen et al.[31,32], performed processing at 450 °C usingΦ=90° angle die. Investigations were performed using a combination of TEM and EBSD on the 3/4th pass sample. Results shows a weak presence of {1012} twin type during the fourth pass, however, overall the fraction of these twins was very low. It was concluded that continuous dynamic recrystallization (CDRX) was the pre-dominant mechanism. In another study by Chen et al.[33], CP-Ti grade 2 was processed at 450 °C for up to eight passes usingΦ=90° angle die. Mainly compressive twins {1011} with a small fraction of tensile twins {1012} were found to be active during thefirst pass. After pass two, CDRX played a dominant role in grain refinement. And finally more recently, Meredith et al. [34]
deformed CP-Ti grade 1 using Φ=90° angle die at 275 °C for up to four passes. It was concluded that {1011} twinning was active alongside CDRX during the first pass. However, beyond pass two, slip was the
dominant deformation mechanism.
With the exception of the last two studies mentioned above, all the other studies have characterized CP-Ti only after a certain pass, moreover the choice of TEM limits the scanned area under observa-tions. The current work aims to present a complete picture of the microstructural development and the textural evolution in CP-Ti using incremental equal channel angular pressing (I-ECAP) process. EBSD was employed to track and analyse large scan areas in flow and transverse plane of the samples. The purpose is to observe the deformation characteristics in detail and to study the dominant grain refinement mechanism.
I-ECAP is an extension of the ECAP process and is recognized as a separate SPD processing technique[35]. Developed by Rosochowski and Olejnik [36], it is capable of processing very long or even continuous billets, a distinct advantage over the conventional ECAP process. The I-ECAP process has been previously demonstrated as an effective technique for refining grain structures in long bars[37], plates
[38]and sheets[39], which makes it an attractive option for industrial implementation. In the present study CP-Ti was subjected to six passes of I-ECAP at 300 °C following route BC. The evolution of the micro-structure and crystallographic texture obtained from the EBSD analysis on unprocessed and processed samples afterfirst, second, fourth and sixth pass are studied in great detail and the mechanism of grain refinement in investigated.
2. Material and method 2.1. Material
The material used in the present study is commercial purity titanium (CP-Ti), grade 2. The material was received in the form of 12.5 mm thick hot rolled plate from Dynamic Metals Ltd (UK). The reported chemical composition (max wt%) was 0.08% C, 0.03% N, 0.18% O, 0.015% H, 0.20% Fe and balance Ti. Square cross-section billets measuring 10×10 mm2and 120 mm in length, were cut from the plate, using wire electric discharge machining (EDM) such that the longitudinal axis of the billet was parallel to the rolling direction of the plate. A small 1 mm chamfer was machined at the top edge of the billet, to facilitate theflow of material during the initial stage of processing.
2.2. I-ECAP experimental procedure
In classical ECAP, processing of very long billets is difficult due to the high force required to overcome friction during processing. I-ECAP process has been designed using FE simulations with the viewpoint of eliminating this limitation[40]. In the present study, the double-billet variant of the I-ECAP process, with a channel intersection angle (Φ) of 120° was used. This technique is capable of processing two billets simultaneously, therefore has twice the productivity. The schematic illustration of the process is shown inFig. 1(a). There are three main tools; die, plunger and punch denoted by A, B and C respectively. During processing, punch tool is oscillating with a certain frequency and therefore comes cyclically in contact with the billet top surface.
In I-ECAP, material pressing and deformation, takes place in two stages as opposed to ECAP[41]. In material pressing stage, while the punch tool is retracting, the billet material is pressed into the deformation zone in increments of distance ‘a’ by the plunger tool known as pressing stroke. In the deformation stage, the punch comes down and deforms the billets. The blue colour outline of the billets in
Fig. 1(a) represents the pressing stage whereas the red colour outline represents the deformation stage with the dashed outline representing the plastically deformed zone. The mode of deformation is similar to that in ECAP i.e. simple shear, provided the pressing stroke is not too large. Separating the pressing and deformation stages, reduces friction substantially. This in turn lowers the force required to press the material[42]; thereby enabling processing of very long or continuous
billets.
The I-ECAP process is realized on a customized 1000 kN servo-hydraulic press as shown inFig. 1(b). The press is controlled by Zwick's Control Cube using Cubus software. The punch is attached to the press actuator and follows a sinusoidal cyclic command during processing. The material pressing is carried out by a screw jack which is driven by a servo-motor. A dedicated LabVIEW application controls and synchro-nizes the material pressing by monitoring the punch oscillation. The application also records and captures deformation and pressing forces during processing. The arrangement of all these elements that consti-tute the I-ECAP rig is shown inFig. 1(b).
Before starting the I-ECAP experiments, the pair of lubricated billets was placed inside the die pre-heated to 300 °C for 15 min, in order to achieve homogenization temperature. Experiments were performed using a pressing rate of 0.2 mm/cycle (0.1 mm/s), punch oscillatory movement of 0.5 Hz and with a peak to peak amplitude of 1.6 mm. The die configuration leads to an imposed strain of ~0.67 per pass. The billets were processed repeatedly and were subjected to a total of six passes giving a total strain of ~4.02. Processing route BCwas followed as it is considered to be the most effective in achieving homogenous microstructure of grains separated by high angle boundaries[43,44]. Specifically for CP-Ti, route BCyieldsfiner equiaxed grains, produces better surface quality[26]and also improves the corrosion resistance
[45]compared to other routes. Following each pass, the billets were quenched in cold water and taken to room temperature quickly, in order to suppress grain growth. The quality of all the billets processed was excellent without any visible surface cracks or defects.
2.3. Electron backscatter diffraction (EBSD) and texture analysis
For the purposes of understanding it is necessary tofirst establish three orthogonal planes; X, Y and Z with respect to the billet. As illustrated inFig. 2, the X plane is the transverse plane perpendicular to the longitudinal axis of the billet whereas the Y and the Z plane areflow and longitudinal planes parallel to the side face and the top face of the
billet at the point of exit from the die, respectively[10,46]. Two groups were selected for analysis purposes, each group consisted of one unprocessed billet and four processed billets afterfirst, second, fourth and sixth pass of I-ECAP process. Samples from both groups were carefully obtained from the centre of the billets using a linear precision saw, following the cut plan as shown inFig. 2. All observations in group 1 samples were made on the Y-plane (FD-ND) while observations in group 2 samples were made on the X-plane (TD-ND), here FD, TD and ND represent theflow, transverse and normal directions respectively. Note that in I-ECAP process, the billet is pressed from the bottom as opposed to being pressed from the top in conventional ECAP, the ND direction is therefore shown to point downwards to make it consistent. The surface of each sample was polished using standard mechanical polishing techniques and was then ion milled on Leica RES101 as afinal step. The microstructure of CP-Ti before and after subsequent passes of I-ECAP were characterized by scanning electron microscopy (SEM) using electron backscatter diffraction (EBSD) analysis. The SEM used was a FEI Inspect F50 with an EDAX TSL EBSD detector. The sample was tilted 70° from the horizontal for EBSD data collection, at a 20 kV accelerating voltage and 200 mA beam current. A step size of 0.40 µm was used for the unprocessed material and 80 nm for the I-ECAP processed material.
3. Results
3.1. As received microstructure
Microstructural characteristics in CP-Ti before and after I-ECAP process was analysed using SEM based EBSD technique.Fig. 3shows the coloured inverse polefigure (IPF) map of the unprocessed material, in the (a)flow (Y) and (b) transverse (X) plane, respectively. The colour code; red for (0001), blue for (1010) and green for (2110) as shown in the standard stereographic triangle (inset inFig. 3(a)), corresponds to the crystallographic orientation of each grain. The colour variations within the grains qualitatively represents difference in internal misorienta-tions.
It appears that the grains are more or less equiaxed in morphology and the grain size analysis reveal an average grain size of 20 and 22 µm, in theflow and transverse planes, respectively. The grain boundary maps obtained from the EBSD analysis (not shown here) confirms that the boundaries of the grains in bothflow and transverse plane are high angle (θ> 15°) in nature with minor misorientation variation within the grain interiors. This minor misorientation is also evident in the IPF maps which shows slight colour variations within the grain interiors.
Fig. 4shows the experimental polefigures recorded on basal (0001), prismatic (1010)and pyramidal (1120)planes representing the texture of the unprocessed material in the (a) flow and (b) transverse plane, respectively. These textures were recorded on the samples at the same measurement areas as used for the IPF maps in Fig. 3. Fig. 4(a),
Fig. 1.(a) Schematic illustration of double-billet variant of I-ECAP process (A=Die, B=Plunger and C=Punch) and (b) the I-ECAP experimental rig (1=I-ECAP die, 2=1000 kN servo-hydraulic press, 3=screw jack and servo motor, 4=Zwick Controller and 5=LabVIEW control application).
Fig. 2.Illustration of the three orthogonal planes (X, Y and Z) with respect to the billet, alongside the cut plan to obtained group 1 and group 2 samples in theflow and transverse plane for microstructure analysis respectively (polishing done on the grey surface of the representative samples).
representing the texture characteristics of the grains in theflow plane, exhibited typical rolling texture observed in HCP materials. (0001) pole
figure shows the presence of split basal texture with c-axis of the majority of grains inclined at an angle ± 30–60° from TD towards FD. The (1010) and (1120) polefigures indicates that a-axis of the HCP lattice are randomly oriented in the rolling plane, and no preferred orientation for prismatic and pyramidal planes (Fig. 4(a)). The textures show that the basal planes of the grains are preferentially oriented parallel to the rolling direction. As a result, a ring texture forms in the (0001) polefigure in which the intensity of the basal pole densities are distributed 360° non-uniformly at the periphery of the pole figure (Fig. 4(b)).
3.2. Microstructural evolution with subsequent passes 3.2.1. Flow (Y) plane
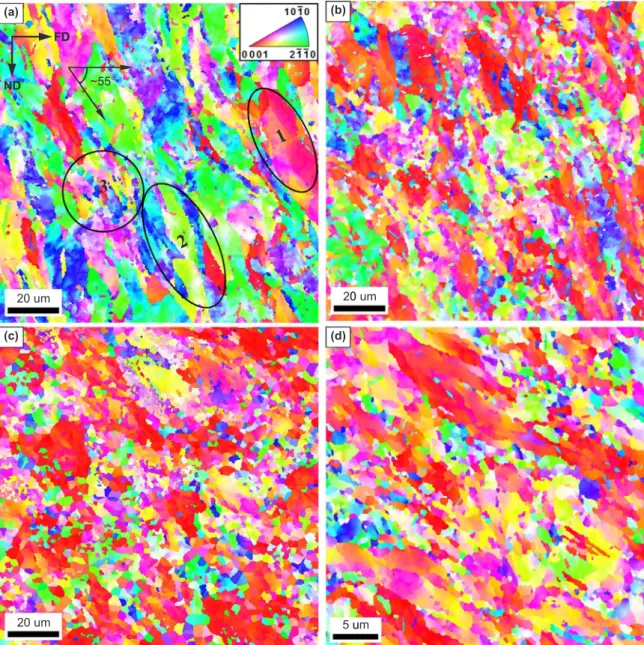
The post deformation microstructure was examined using high resolution SEM-EBSD technique.Fig. 5shows the coloured IPF maps, representing the evolution of microstructure and deformation charac-teristics in theflow (Y) plane of the CP-Ti samples subjected to (a)first (b) second (c) fourth and (d) sixth pass of I-ECAP process, respectively. As mentioned earlier, each pass gives a strain of ~0.67 so these IPF maps corresponds to a total strain of 0.67, 1.34, 2.68 and 4.02, respectively. The FD and ND direction applicable for all the IPF maps in theflow plane is shown inFig. 5(a). It is also important to emphasize that the samples for EBSD analysis were taken from the centre region of
Fig. 3.Coloured inverse polefigure (IPF) maps obtained from EBSD analysis showing the microstructure of unprocessed CP-Ti grade 2 sample in the (a)flow (Y) and (b) transverse (X) plane. The colour corresponds to the crystallographic orientation shown in the standard stereographic triangle. Colour variations within grains qualitatively represents change in internal misorientations. (For interpretation of the references to color in thisfigure legend, the reader is referred to the web version of this article.)
Fig. 4.Experimental polefigures illustrating the evolution of texture on0001(left),1010(middle) and1120(right) planes in un-processed CP-Ti grade 2 sample in the (a)flow (Y) and (b) transverse (X) plane. The representative colour scale bar for the corresponding polefigure are shown as well.
the processed billets to avoid any end and surface defects due to friction.
EBSD scan of the sample subjected tofirst pass of I-ECAP inFig. 5(a) shows that most of the grains are elongated and forming a typical banded style microstructure due to the shearing process. The tilt of the elongated grains is ~55° to theflow direction. The metalflow pattern is similar with those developed in FCC and BCC metals afterfirst pass of ECAP processing[43]. This pattern is mainly influenced by the channel intersection angle (Φ) during thefirst pass. In general, the microstruc-ture is heterogeneous and three regions can be identified similar to
Fig. 2(b) in Ref. [47]. Region 1 is a coarse grain which has been elongated and appears to be largely deformation free, with the size similar to pre-existing coarse grains. Colour variation within this coarse grain suggests minor misorientation are accumulated within the grain. With further straining, these misorientations will increase, which are likely to result in formation of new smaller grains with high angle boundaries. Region 2 consists of a thin banded structure, which have likely deformed to form new elongated grains. The bands measure, tens
of micrometres in length and a few micrometres in width, therefore are not considered to be ultrafine grain structure. Region 3 consists offine equiaxed grains in the size range less than 3 µm, it is also seen that some of these fine grains have nucleated around the grain boundaries of elongated grain. Microstructure having suchfine grains along the grain boundaries is termed as necklace structure. The smallest grains are down to ~500 nm, however the fraction is quite low. This however shows that ultrafine grains have already begun to form after thefirst pass.
As seen inFig. 5(b), after second pass of I-ECAP processing, the microstructure is further refined compared to thefirst pass. As a results, many more fine grains have formed while the number of elongated grains have decreased considerably. Also, the length and width of these remaining elongated grain have been greatly reduced due to the total amount of strain induced. The majority of these elongated grains have orientation which range from basal plane 0001 (red) to either half way to1010 (pink) or less than half way to 2110 (orange). Overall, the texture is seen to have been weakened compared to thefirst pass.
Fig. 5.Coloured inverse polefigure (IPF) maps obtained from EBSD analysis showing the evolution of microstructure and deformation characteristics in processed CP-Ti grade 2 samples in theflow (Y) plane after (a)first, (b) second, (c) fourth, and (d) sixth pass of I-ECAP process at 300 °C usingΦ=120° angle die. The colour corresponds to the crystallographic orientation shown in the standard stereographic triangle (inset). Colour variations within the grains qualitatively represent differences in internal misorientations. Note that scale bar used in (a) to (c) is 20 µm whereas in (d) is 5 µm, due to high magnification image. (For interpretation of the references to color in thisfigure legend, the reader is referred to the web version of this article.)
Fig. 6.EBSD based grain boundary maps of CP-Ti grade 2 samples in theflow (Y) plane after the (a)first (b) second (c) fourth and (d) sixth pass of I-ECAP process at 300 °C usingΦ=120° angle die. Here blue lines represent low angle grain boundaries (LAGB) where 1.5°≤θ≤15°, whereas red lines represent the high angle grain boundaries (HAGB) whereθ> 15°. Figure on the left represents the corresponding histogram of the grain size distribution and cumulative distribution function along with the average grain size. Figures on the right represents the corresponding histogram of the misorientation distribution and the cumulative distribution function along with the percentage of HAGB and LAGB.
Fig. 5(c) represents the microstructure after the fourth pass of I-ECAP processing in theflow plane. The microstructure has significantly changed from the first pass microstructure as the banded nature has been lost completely alongside the tilted materialflow pattern. It is observed that a great amount of grain refinement has taken place, this is confirmed by the almost non-existence of elongated grains and the domination of equiaxedfine grains.
Fig. 5(d) shows the EBSD microstructure after six passes, notice the use of higher magnification evident by 5 µm scale bar compared to 20 µm in previous three images. The grains are mostly equiaxed in morphology with the formation of UFG structure, however it is seen some grains are slightly elongated and generally oriented to the billet extrusion direction, considered to be the characteristic of route BC[9]. Although tremendous grain refinement has taken place, it seems that with further passes more refinement in grain size is possible.
Fig. 6(a–d) shows grain boundary maps of the IPF maps presented in
Fig. 5(a-d). In thesefigures, the light blue lines represent the low angle grain boundaries (LAGB) with misorientation angle (θ) between 1.5 and 15°, whereas the thick red lines represent the high angle grain boundaries (HAGB) with misorientation angle (θ) greater than 15°. The figure on the left of each grain boundary map shows the corresponding histogram of grain size (equivalent circle diameter) with the solid line representing the cumulative grain size distribution function. Thefigure also includes the value of calculated average grain size. Accordingly, thefigure on the right of each grain boundary map shows the corresponding histogram of grain misorientation with the solid line representing the cumulative grain misorientation distribution function. Thefigure also includes the calculated fraction of LAGB and HAGB in percentage. Note that, 1P, 2P, 4P and 6P in theFig. 6(a–d) represents the respective I-ECAP pass numbers.
These plots demonstrate a very clear evolution of microstructure in theflow plane with increasing number of passes. In general, the grain size histogram shows that the bars are shifting towards the left, indicating the increase in grain refinement achieved after subsequent processing. Moreover, the grain misorientation histogram reveals that the fraction of HAGB is gradually increasing with increasing number of passes in theflow plane.
The grain boundary map in Fig. 6(a), confirms the existence of mostly elongated grains with small fraction of fine grains in the microstructure. There is some evidence of thesefine grains alongside with grain boundary of larger elongated grains. The corresponding grain size histogram ofFig. 6(a) reveals a tiny fraction of grains which are above 20 µm. This confirm the presence of pre-existing deformation free coarse grains which were seen as an elongated grain (circled as 1) in the Fig. 5(a). The grain boundary map also reveals that the microstructure has mostly low angle grain misorientations, as evident by the abundance of blue lines after the first pass of I-ECAP. The corresponding grain misorientation histogram confirms this as well. By examining the grain boundary misorientation histogram carefully, twinning behaviour during the deformation can be observed. The histogram shows a noticeable peak of misorientation at around 85°, which would indicate that these boundaries corresponds to the {1012} tensile twin boundary [22]. There is also a minor peak in the misorientation histogram at ~65°, signalling that the {1122} twins were also operative during deformation. Twinning behaviour will be discussed further in the following section.
The grain boundary maps after second pass inFig. 6(b) shows that the grains have been further refined with more than 90% of the grains smaller than 10 µm and with 40% of the grains between 0.7 and 2.0 µm size. The fraction of elongated grain has been reduced considerably. Careful observation of the grain boundary maps reveals that some of the grains contains incomplete HAGB segments, the individual location of these incomplete HAGB are pointed by a black arrow. These HAGB does not seems to be fully enclosed. These boundary segments are believed to be arising due to continuous dynamic recrystallization (CRDX) process. It is also seen that the fraction of LAGB has been reduced
whereas the fraction of HAGB has been increased, compared to thefirst pass. Similar tofirst pass, the corresponding histogram for the second pass also shows a misorientation peak around 85°, which would indicate the presence of {1012} tensile twins. However, the peak around ~65° misorientation has been reduced, indicating a much decreased activity of {1122} twins.
Fig. 6(c), which represents the grain boundary map after fourth pass, shows that majority of grains have been refined, with close to 80% of the total area fraction between 1 to 4 µm. As can be seen, the grains are now mostly equiaxed and the size distribution is becoming homogenous. Examination of the corresponding misorientation histo-gram does not show any preferential peak for suspected twins. This is consistent with the experimental results reported in literature, whereby
finer sized grains hinder deformation twinning[48]. As the grain size decreases the stress required to activate deformation twinning increases greatly compared to the stress required for slip type dislocations[49]. Therefore for higher passes as the grain size continue to decrease, deformation by slip mode becomes more favourable.
Fig. 6(d) continue to exhibit the remarkable trend towards grain refinement; notice again the use of a higher magnification image. The average grain size after six passes have reduced the initial size of 20 µm to 1.3 µm only. Moreover, the percentage fraction of HAGB has been increased to 51%. It is also interesting to note from the grain boundary map, that the sub-grains formed having LAGB have mostly clustered towards the HAGB. As explained in detail later, this is a feature of CDRX, whereby, existing HAGB act as nucleating sites for sub-grain formation.
3.2.2. Transverse (X) plane
In order to study the homogeneity of microstructure during I-ECAP processing, the microstructure is also analysed in the transverse plane.
Fig. 7 shows the coloured IPF maps obtained using SEM-EBSD
technique, representing the evolution of microstructure and deforma-tion characteristics in the transverse (X) plane of the CP-Ti samples, subjected to (a)first (b) second (c) fourth and (d) sixth pass of I-ECAP process. The TD and ND directions are shown in Fig. 7(a) and are applicable to all the IPF maps in transverse plane.
IPF map of the sample subjected tofirst pass in the transverse plane is shown in Fig. 7(a), it differs immensely from the microstructure observed in theflow plane (Fig. 5(a)). There is no tilt in materialflow along any direction and as a consequence there is no occurrence of elongated grains. Unlike in theflow plane, here majority of the grains are more or less equiaxed in morphology with the boundaries of some grains decorated byfine grains. Evidence of some twin boundaries is also seen in the microstructure. The microstructure can be regarded as being highly anisotropic (heterogeneous), because it consists of large grains,fine grain and twins after thefirst pass.
IPF map in Fig. 7(b) reveals further grain refinement of the microstructure after second pass. As expected, materialflow is observed at a tilt (see the black arrows), this is consistent with second pass processing with route BCin the transverse plane[9]. It is also observed that most of the larger grains have been broken down intofine grains with size range of 1–5 µm (Fig. 8(b)). The heterogeneity of the microstructure in terms of grain size has been greatly reduced. However, most of the grains after second pass are in green colour which suggests that the crystallographic orientation is close to pyrami-dal (2110) plane.
Fig. 7(c) represents the microstructure after the fourth pass of I-ECAP processing. It is seen that the microstructure has been again completely transformed compared to after thefirst pass. After fourth pass, there is abundance offine grains which results in a relatively homogenous microstructure. Majority of the grains after the fourth pass are still green in colour, however careful examination of the micro-structure reveals that colour code of thefine grains is different from green. This suggests that the new grains which are being formed as a result of grain refinement process have mostly HAGB.
Fig. 7(d) shows the EBSD microstructure after the sixth pass. To better appreciate the fine grain structure, higher magnification is employed again as evident by 5 µm scale bar compared to 20 µm in previous three images. The grains are mostly equiaxed in morphology with the formation of UFG structure. Weakening of the texture has however taken place due to the significant grain refinement in grain sizes as evident by the variation of colour across the grains in microstructure.
Fig. 8(a–d) shows grain boundary maps of the IPF maps presented in
Fig. 7(a-d). As previously presented, thefigure on the left of each grain boundary map shows the corresponding histogram of grain size (equivalent circle diameter) with the solid line representing the cumulative grain size distribution function. The figure also includes the value of calculated average grain size. Accordingly, thefigure on the right of each grain boundary map shows the corresponding histogram of grain misorientation with the solid line representing the cumulative misorientation distribution function. The figure also in-cludes the values of calculated fraction of LAGB and HAGB in
percentage.
As was the case in microstructure in theflow plane, the plots here also demonstrate a very clear evolution of microstructure in the transverse plane with increasing number of passes. As previous, in general, the grain size histogram shows that the bars are shifting towards the left, indicating level of grain refinement achieved after subsequent processing. On the other hand, the misorientation histo-gram is gradually shifting towards the right, indicating the increase in fraction of HAGB with increasing number of passes.
Fig. 8(a) represents the grain boundary map after thefirst pass of I-ECAP process. It is evident that although the microstructure is hetero-geneous (coarse andfine grains co-existing), still majority of the grains are equiaxed in morphology. Moreover, formation offine grains around the grain boundaries (necklace structure) is apparent as well. Thesefine grain contributing to the formation of necklace structure are less than 2 µm in size and account for 20% of the area fraction after thefirst pass. It is very interesting to mention that the grain boundary map analysed for the sample in the transverse plane prior to any processing, displayed
Fig. 7.Coloured inverse polefigure (IPF) maps obtained from EBSD analysis showing the evolution of microstructure and deformation characteristics in processed CP-Ti grade 2 samples in the transverse (X) plane after (a)first, (b) second, (c) fourth, and (d) sixth pass of I-ECAP process at 300 °C usingΦ=120° angle die. The colour corresponds to the crystallographic orientation shown in the standard stereographic triangle. Colour variations within grains qualitatively represent differences in internal misorientations. Note that scale bar used in (a) to (c) is 20 µm whereas in (d) is 5 µm, due to high magnification image. (For interpretation of the references to color in thisfigure legend, the reader is referred to the web version of this article.)
Fig. 8.EBSD based grain boundary maps of CP-Ti grade 2 samples in the transverse (X) plane after the (a)first (b) second (c) fourth and (d) sixth pass of I-ECAP process at 300 °C using Φ=120° angle die. Here blue lines represent low angle grain boundaries (LAGB) between where 1.5°≤θ≤15°, whereas red lines represent the high angle grain boundaries (HAGB) where
θ> 15°. Figure on the left represents the corresponding histogram of the grain size distribution and cumulative distribution function along with the average grain size. Figures on the right represents the corresponding histogram of the misorientation distribution and the cumulative distribution function along with the percentage of HAGB and LAGB.
an even distribution of LAGB across the entire scanned area including within the grains. However, it is seen that after thefirst pass, the LAGB are starting to cluster around the HAGB of large grains to form sub-grains. The corresponding misorientation histogram again suggests the presence of {1012} and {1122} twins because of the observed peaks around 85 and 65° misorientation angle, respectively.
The grain boundary maps after the second pass inFig. 8(b) shows grain refinement in action, with the formation of large regions offine grains. Here grains less than 2 µm in size occupy 45% of the total area fraction. This is reflected by the sharp initial rise in the black line representing the cumulative distribution function. The grain boundary maps again reveals that some of the grains contains incomplete HAGB segments (pointed by black arrows). In terms of the twinning, similar behaviour is observed asflow plane sample. The peak around 65° has diminished, with a peak (although reduced) still exists around 85° misorientation. This suggest that there is some fraction of {1012} twins in the microstructure. However interestingly after the second pass as the microstructure is refined, it appears that LAGB have been re-distributed fairly evenly across the whole scanned area including inside of the grains (compare the blue background inFig. 8(b) withFig. 8(a)). This indicates increase in the number of sub-grain formation. Also, as seen by the grain misorientation histogram that although the overall fraction of LAGB has remained same at 64%, the fraction of sub-grains with LAGB less than 5° has actually slightly decreased and LAGB between 5° and 15° has slightly increase, compared to thefirst pass.
Fig. 8(c), which represents the grain boundary map after the fourth pass, shows that the majority of grains have been refined. Similar to the
flow plane, up to 80% of the grain size fraction lies between 1 to 6 µm. The grain misorientation histogram shows a reduction in percentage of LAGBs and an increase in HAGBs. Moreover, there are no noticeable peaks at misorientation angles corresponding to any twins, which again suggests that there is no noticeable twins fraction present in the microstructure as the grain size is refined.
Finally, the grain boundary map following the sixth pass as shown in Fig. 8(d) displays substantial further grain size refinement. The fraction of grains above 2 µm has been greatly reduced with only less than 15% accounting for larger size. The average grain size in the transverse plane after the six passes of processing have been reduced from an initial size of 22 µm to 1.1 µm only, with an increase in HAGB as indicated by the misorientation histogram. It is again interesting to note from the grain boundary map, that the LAGBs have been significantly reduced and they are again mostly accumulated in the vicinity of HAGB.
3.3. Texture evolution with subsequent passes 3.3.1. Flow plane
Evolution of crystallographic textures was tracked by obtaining pole
figures via EBSD analysis after I-ECAP processing. Fig. 9 shows the experimental textures recorded on basal (0001), prismatic (1010) and pyramidal (1120)crystallographic planes of the CP-Ti samples in the
flow plane, processed though (a)first, (b) second, (c) fourth and (d) sixth pass of I-ECAP process, respectively. The texture intensities are represented by the colour scale bar corresponding to the representative pole figure. These pole figures have been recorded at the same measurement areas where the IPF maps shown inFig. 5were obtained. As evident by the pole figure in Fig. 9(a), the off-basal texture present in the unprocessed material as seen in Fig. 4(a) has been weakened, this is mainly due to the significant changes in microstruc-ture caused by shear deformation in first pass processing. The peak intensity value inFig. 9(a) is considerably lower than inFig. 4(a). This intensity however gradually increases with increase in number of passes, reaching a maximum strength after the fourth pass (see the maximum value in the colour scale bars).
In particular it is also seen that the basal texture is dominant after the second and the fourth pass processing, see the (0001) polefigures
provided inFig. 9(b) and (c). Most of the grains in the scanned area shown by IPF maps inFig. 5(b) to (c) are also seen to be red in colour, which indicates the development of stable orientation during shear deformation towards basal.Fig. 9(b) which represents the polefigures after second pass processing revealed the development of basalfibre {0001} <1120> as a prominent texture component. Possible texture components and their characteristics in the case of HCP materials are listed in Table 2 in[50]. In addition to that, based on the polefigures after the second pass suggests that majority of the grains reoriented their c-axis parallel to TD. Moreover the <1120> direction and the {1010}planes of the grains on theflow plane becomes parallel to shear direction and shear plane, respectively. Beausir et al.[51]identified
five ideal shear texture components (P, B, Y, C1and C2) in the case of HCP materials subjected to ECAP process. (1010) and (1120) polefigures of the second, fourth and sixth pass samples also shows the develop-ment of ideal shear texture components. Increase in the intensities close to ideal locations on the polefigures confirmed the development of P
fibre. Note that the positions are slightly rotated from the ideal locations as indicated by dotted lines in (1010) pole figure, this is consistent with the finding reported in [51] after second pass and beyond. There is also some evidence of the formation of B fibre component after sixth pass (see (1010) plane pole figure in Fig. 9). Among thefive ideal shear texture components P and B are known to occur more commonly during ECAP of HCP materials[52].
Development of six clusters at an angle interval of 60° is noticed in the (1010) and (1120)polefigures of the second, fourth and sixth pass samples in Fig. 9(b) to (d). It was reported that these clusters are introduced by the crystallographic symmetry of {1010} family of planes (six) and <1120> family of directions (six) in the case of pure titanium subjected to shear deformation[53]. Slight reduction in the intensity of texture is observed after the sixth pass which indicates weakening of the texture. This is also supported by the IPF map inFig. 5(d), which shows the reduction in the fraction of grains in red colour. Formation offine grains with HAGB after the sixth pass is attributed to this.
3.3.2. Transverse plane
Fig. 10shows the experimental textures recorded on basal (0001), prismatic (1010) and pyramidal (1120) planes of the CP-Ti samples along transverse plane, processed through (a)first, (b) second, (c) fourth and (d) sixth pass of I-ECAP process, respectively. These polefigures have been recorded at the measurement locations similar to the IPF maps in
Fig. 7.
After thefirst pass, in contrast to theflow plane polefigures which showed a decrease in peak intensity values compared to the unpro-cessed material, here the values have actually increased. This was also observed by the presence of mostly green coloured grains as shown in
Fig. 7(a), which indicates strengthening of texture after thefirst pass. After the second pass, it is seen that the peak intensity does not change much in value. However, the peak intensity value reaches a maximum after the fourth pass, whereby texture is strengthened drastically followed by significant weakening after the sixth pass. This is also confirmed by the presence of mostly green coloured grains as seen in
Fig. 7(c), followed by the formation of new fine grains of random orientation after sixth pass (Fig. 7(d)).
The polefigures also confirms the development of {1120} fibres. Thesefibres here started to evolve after the second pass and are seen to be getting stronger up to fourth pass. Compared to the second pass pole
figures, the three polefigures inFig. 10(c), shows that the intensity of the peaks are now appearing at ideal locations of thefibre texture components. Normally the {1120}fibres in HCP materials are expected to occurs at certain ideal location irrespective of thecvalue as reported in[50].
4. Discussion
4.1. General characteristics of microstructure through 1–6 passes
The study provides a thorough investigation documenting the microstructural and textural evolution in CP-Ti grade 2 billets subjected to six passes of I-ECAP at 300 °C using a die withΦ=120° following route BC. Exceptional grain refinement was achieved in bothflow and transverse plane of the samples. To appreciate the level of grain refinement during the I-ECAP process, Fig. 11 presents the average grain size prior to any processing and after subsequent I-ECAP proces-sing in (a) flow and (b) transverse planes, respectively. The average
values were obtained from the histogram of grain size distribution (Figs. 6 and 8) following the EBSD analysis. The error bars in the graph represents the standard deviation, which is an indication of the level of dispersion in the grain size from the average value. These figures confirm the remarkable microstructural changes taking place during the I-ECAP process. The graphs display the grain refinement taking place as the number of passes increase, evident by the rapidly decreasing average grain size value. More importantly, it also displays that the size of the error bars is decreasing considerably with subsequent processing. This highlights that the microstructure is evolving into a more homogenous state after each pass.
It is convenient to define a refining factor (η) to understand the
Fig. 9.Experimental polefigures illustrating the evolution of texture on the0001(left),1010(middle) and1120(right) planes in processed CP-Ti grade 2 samples in theflow (Y) plane after (a)first, (b) second, (c) fourth and (d) sixth pass of I-ECAP process at 300 °C usingΦ=120° angle die. The texture intensities here are represented by the colour scale bar for the corresponding polefigure.
efficiency of grain refinement during the I-ECAP processing, which is given by Eq.(1) [33]: η d d d = 0− 0 (1)
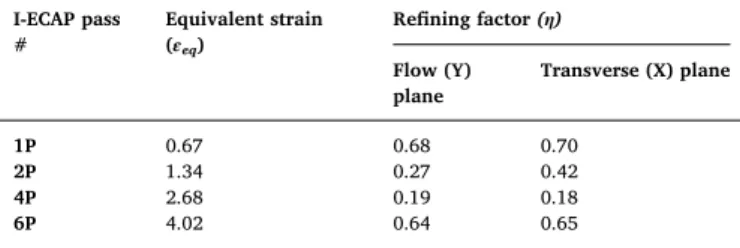
whered0anddare the average grain sizes of the previous and current pass, respectively. The calculated values of η along both flow and transverse planes are listed inTable 1, for subsequent passes. As can be seen by the values, the first pass sees the highest values ofη. After which the values decrease gradually until pass four. However, it can be seen that the value of η at the final sixth pass for both flow and transverse planes is relatively high, this suggests that grain refinement has not reached a saturation point. Upon further processing, even more
grain refinement is possible. This is in contrast to result reported in
[33], where processing of CP-Ti grade 2 was done up to eight passes and saturation in ηwas seen after the sixth pass. The difference in die channel of 90° and processing temperature of 450 °C used is likely to be the reason. Overall, theηvalues forflow and transverse planes are more or less similar to each other in the current study which shows that refinement is taking place at a similar rate across both planes.
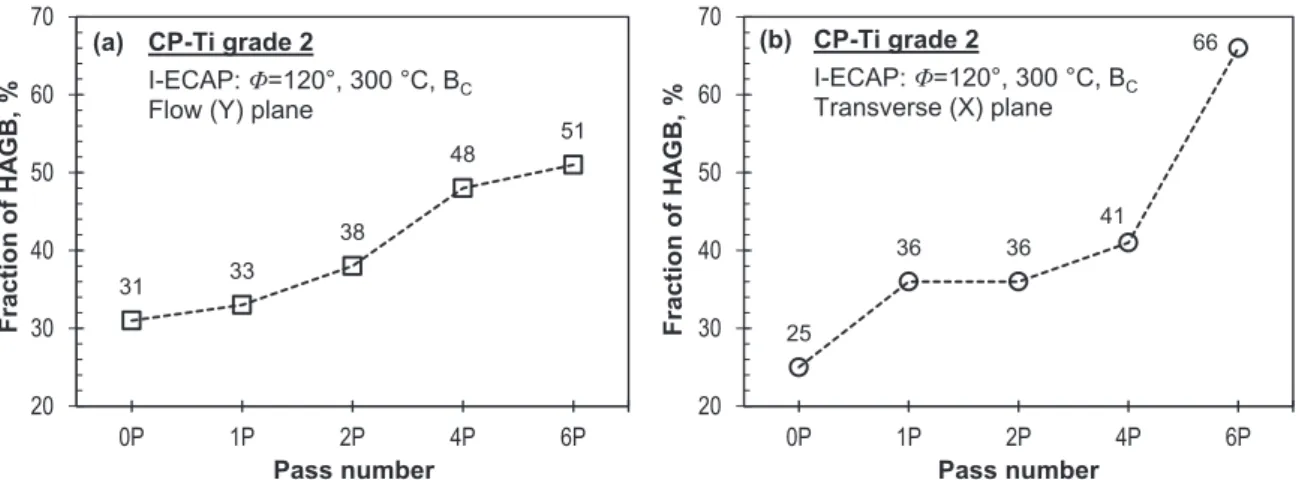
For bulk UFG materials, it is not only enough to achieve extreme grain refinement, the microstructure should also consist of grains with mostly HAGB [54]. The high fraction of HAGB in UFG material is important in order to achieve advanced and unique properties[55]. To access the evolution of misorientation during I-ECAP processing, two measures; average misorientation and the fraction of HAGB as a
Fig. 10.Experimental polefigures illustrating the evolution of texture on the0001(left),1010(middle) and1120(right) planes in processed CP-Ti grade 2 samples in the transverse (X) plane after the (a)first, (b) second, (c) fourth and (d) sixth pass of I-ECAP process at 300 °C usingΦ=120° angle die. The texture intensities here are represented by the colour scale bar for the corresponding polefigure.
function of subsequent passes are presented inFigs. 12 and 13, for the (a) flow and (b) transverse plane, respectively. It is seen that the average misorientation in theflow plane increases gradually over the subsequent passes, with a maximal value reaching 33° in the end. Meanwhile, in the transverse plane, the value initially rises sharply after the first pass and does not changes much until the fourth pass. Beyond fourth pass the value rises rapidly and reaches a relatively high average misorientation value of 47° in the sixth pass. Regarding the percentage fraction of HAGBs in theflow plane, the value is seen to increase gradually except between second and fourth pass, where there is a jump of 10% in the fraction of HAGBs. Fraction of HAGB in the transverse plane displays a similar trend as the average misorientation. Here again, there is an increase beyond the fourth pass with the HAGB fraction abruptly increasing by as much as 25% and reaching a considerably high value of 66% after the sixth pass. In general, it is seen that both the value of average misorientation and the fraction of HAGBs are considerably higher in the transverse plane.
4.2. Mechanism of grain refinement 4.2.1. Twinning
Pure Ti has an axial (c/a) ratio of 1.587, which is markedly different from the ideal value of 1.633 for HCP crystal structure. This along with the limited slip systems present in its crystal lattice results in a complex deformation mechanism consisting of both slip and twinning modes. Studies have shown that the microstructural evolution of CP-Ti during ECAP is quite different compared to FCC and BCC metals[56]. During ECAP deformation, cubic metals normally form shear bands due to slip being the dominant deformation mechanism. However in CP-Ti, twin-ning has been observed to accommodate the plastic deformation during ECAP [27–30]. On application of stress, perpendicular to the basal plane during deformation, the role of twinning in HCP metals is to orient substantial portions of the grain along twin orientation. A slip type deformation is then possible along any favourable re-orientations
[57]. Moreover, as twinning alone cannot accommodate the large plastic strain during ECAP, it is normally accompanied by dislocation slip.
As mentioned earlier, most of the work related to studying grain refinement mechanism during ECAP of CP-Ti has relied on TEM. Although TEM is a powerful tool for analysing the microstructure, however, the scan area under observation is limited in size. Therefore, the mechanism observed can just be local and may not entirely represent the general deformation behaviour. It was only recently when studies conducted by Chen et al.[31–33] and Meredith et al.
[34]using SEM-EBSD, established CDRX alongside twinning during the initial passes of the ECAP process. In the last decade, EBSD measure-ment technology has evolved considerably. The advantage of using
Fig. 11.Average values of grain size in CP-Ti grade 2 samples in the (a)flow (Y) and (b) transverse (X) plane, before and after subsequent I-ECAP processing at 300 °C usingΦ=120° angle die.
Table 1
Grain refining factor (η) at subsequent I-ECAP pass.
I-ECAP pass # Equivalent strain (εeq) Refining factor(η) Flow (Y) plane Transverse (X) plane 1P 0.67 0.68 0.70 2P 1.34 0.27 0.42 4P 2.68 0.19 0.18 6P 4.02 0.64 0.65
Fig. 12.(a) Average values of grain misorientation in CP-Ti grade 2 samples in the (a)flow (Y) and (b) transverse (X) plane, before and after subsequent I-ECAP processing at 300 °C using Φ=120° angle die.
EBSD is the ability to scan large areas for observing and quantitatively analysing the LAGBs, HAGBs, grain size and evolution of texture, as presented in this work. Moreover, statistical analysis of the boundary misorientation data can reveal presence of twin fraction in the microstructure. The {1012} and {1121} tensile twins are associated with misorientation peaks around 85 and 35° misorientation angles, whereas {1011} and {1122} compressive twins are associated with peaks around 57 and 65° angles, respectively [22]. Here the term compressive and tensile relates to the contraction and extension of c-axis in the HCP crystal.
Twinning during the first pass is evident as the microstructure obtained in bothflow and transverse plane is heterogeneous and have high anisotropic grain morphology. Similar microstructural results were obtained in[47], which reported twinning to be active alongside slip during thefirst pass. Compared to FCC materials such as Alumi-nium where twinning does not exist, all grains are extremely elongated and forms shear bands after thefirst pass[58].
In the present study, the grain misorientation histogram obtained from the samples afterfirst pass of I-ECAP in theflow and transverse planes, shows peak around 85° and a minor peak around 65° misor-ientation angle, suggesting the presence of {1012} and {1122} twins, respectively. To establish the occurrence of twinning during I-ECAP of CP-Ti, detailed analysis is presented using a high magnification band contrast image from thefirst pass sample in theflow plane, shown in
Fig. 14(a). As evident by the image, {1012} tensile twin (TT) and {1122} compressive twin (CT) type were activated in the microstructure, boundaries of which are shown as red and blue colour, respectively.
Fig. 14(b) and (c) presents an enlarged IPF map of selected region to show the boundaries of CT and TT twin types. Fig. 14(d) shows the grain misorientation histogram of the microstructure, the preferential misorientation peak for the contribution of twins are again noticed at around 65° and 85°. The corresponding inverse polefigure at 65° ± 5° shows cluster of misorientation axes about 1010 which confirms {1122} twin boundary. Similarly, the corresponding inverse polefigure at 85° ± 5° shows cluster of misorientation axes about 2110 which confirms {1012} twin boundary. Note that inFig. 14(b) and (c), the twin boundaries appearing inside the grains are HAGB, therefore they seems to be dividing the grain from the inside. By doing so, they are playing a key role in the grain refinement process.
In comparison to {1012} twins, the fraction of {1122} twins is much smaller during the first pass. According to the literature survey, the presence of {1122} twins was only reported very recently by Meredith et al.[34], who provided some evidence for the existence of such twins following EBSD analysis of the first pass microstructure. Similar to current results, the fraction of {1122} twins observed was very low in that study. Therefore, although twinning act as a dominant deformation mechanism during the initial passes of I-ECAP, compared to {1122}
twin, the {1012} twin specifically play a greater role in the grain refinement process of CP-Ti.
Other studies on ECAP of CP-Ti have reported the presence of {1011} twins during thefirst pass[27,30,33], such twins were not observed in the present study. {1012} twins observed here, were previously reported to be found in small fraction during thefirst pass processing of CP-Ti alongside {1011} twins[33]. Analysis of the second pass microstructure in[34], suggested small occurrence of {1012} twin boundary as well. Moreover, during the 3/4th pass, a weak presence of such twins were also observed to accommodate the deformation strains[31,32]. Since {1011} twin is known to occur at above 400 °C[57], it is believed that due to the use of a lower processing temperature of 300 °C compared to the above mentioned studies, {1011} twin is not found in the present study.
With the evolution of microstructure after second pass, twinning activity is greatly suppressed. As the microstructure is refined, the {1122} twins are no longer apparent in the misorientation histogram. The 85° peak relating to the {1012} is also greatly suppressed after second pass. This indicates that beyond second pass as the grain size is decreasing, slip is becoming the dominant deformation mechanism. The {1122} twin has been shown to be very sensitive to grain size [22], which explains its early demise compared to {1012} twin in the present study. With subsequent processing and grain refinement in fourth pass and beyond, the {1012} twin activity is also no longer noticeable. This is consistent with other studies on conventional ECAP processing on CP-Ti, which also claimed that deformation by twinning was replaced or taken over by deformation by slip after the initial passes[29,59,60].
It is generally accepted that the twinning activity in titanium is strongly dependent on the grain size, it decreases with the reduction in grain size[61]. It is important to highlight, that although twinning has been observed during I-ECAP processing of titanium but compared to room temperature deformation of titanium[22,61], the overall fraction of twinning observed here is significantly lower. This is attributed to the use of elevated temperature processing at 300 °C, which would facil-itate slip type deformation.
4.2.2. Continuous dynamic recrystallization (CDRX)
Titanium is considered to be a high stacking fault energy (SFE) metal and is expected to display CDRX during elevated temperature deformation. Plastic deformation stimulates activation of different dislocation sources within the pre-existing grains which leads to an increase in the dislocation density. CDRX, is a recovery dominated process, whereby these dislocations produced by deformation are progressively accumulated within the grain interior to form sub-grains with LAGBs. As the straining continues, the sub-grains rotates and the misorientation increases. Upon reaching a cut-offvalue of 15°, results in the formation of new smaller grains surrounded by HAGBs[62].
Fig. 13.(a) Percentage fraction of high angle grain boundaries (HAGB) in CP-Ti grade 2 samples in the (a)flow (Y) and (b) transverse (X) plane, before and after subsequent I-ECAP processing at 300 °C usingΦ=120° angle die.
Studies have shown that large differences in misorientation angles measured within grains are the driving force for CDRX[31,34]. Careful examination of the grain boundary maps obtained via EBSD analysis (Figs. 6 and 8), revealed existence of several incomplete HAGB segments (which do not form a fully enclose grain). The occurrence of such incomplete HAGB segments found in the microstructure is a strong indication of CDRX process taking place during I-ECAP proces-sing of CP-Ti. To investigate the occurrence of CDRX in the present study, a high magnification EBSD map is generated from the second pass processed sample in the transverse plane, as shown inFig. 15(a). In the EBSD map, the thin blue lines represent the LAGBs with misorienta-tion angleθbetween 1.5–15°, whereas the thick black lines represent the HAGBs withθgreater than 15°. Here the incomplete HAGBs can be seen clearly as indicated by arrows.
These incomplete HAGBs have evolved from the LAGBs of sub-grains by the progressive accumulations of dislocations near the existing HAGB boundaries. Careful analysis of two of these incomplete HAGBs, labelled as L1 and L2 inFig. 15(b) and (c), respectively, reveals
that the misorientation is just over 15°. This confirms that these HAGBs have evolved from LAGBs. Further accumulation of dislocation in subsequent passes will lead to the extension of these incomplete HAGBs segments to form fully enclosed refined grains.
Another characteristic feature associated with CDRX is the forma-tion of necklace structure, i.e.fine grains decorated around the coarse grains [31]. Fig. 15also shows that most of the LAGBs (subgrains) development is around HAGBs. Since existing HAGBs act as nucleating sites for subgrains, it is expected that the grain refinement takes place at the exterior of coarse grains and spreads towards grain interior[34].
Based on the observations in the results section, the microstructural evolution and grain refinement of CP-Ti is dependent on twinning alongside CRDX during I-ECAP. Also it is observed that the shearing characteristics of I-ECAP is very similar to conventional ECAP process and therefore is an effective technique for refining grain structure in CP-Ti.
Fig. 14.(a) EBSD band contrast image of the CP-Ti grade 2 sample in theflow (Y) plane after thefirst pass of I-ECAP, showing the formation of twin boundaries. The{1012}tensile twin (TT) and{1122}compressive twin (CT) boundaries are shown in red and blue colour, respectively; (b) and (c) magnified IPF map of two selected regions, showing CT and TT twin types, respectively and (d) corresponding misorientation histogram and inverse polefigures showing the misorientation axis for grain boundaries of selected twin boundary misorientation angles of 65 and 85°. (For interpretation of the references to color in thisfigure legend, the reader is referred to the web version of this article.)
5. Conclusion
In this study, the CP-Ti grade 2 billets were subjected to a total of six passes of I-ECAP process at 300 °C following route BC, using aΦ=120° angle die. The evolution and deformation characteristics of the micro-structure was studied and tracked by using relatively large scan areas obtained via EBSD in bothflow and transverse plane of the processed billet. Texture development through subsequent processing was also investigated using polefigures in both planes. Remarkable refinement was achieved with subsequent processing, with majority of the grains converted into ultrafine grain size having HAGB after the sixth pass. The following conclusions are drawn from the investigation.
1. Microstructure after thefirst pass was heterogeneous, which con-sisted of elongated,fine and a small fraction of undeformed pre-existing grains. Moreover, the grain misorientation histogram from both planes, showed peaks around 85 and 65° which highlighted the presence of {1012} twins and {1122} twins in the microstructure. Beyond the second pass, twinning activity was greatly suppressed with only a very small fraction of {1012} twins appearing in the microstructure. Detailed analysis also confirm the presence of twinning in the microstructure after initial passes.
2. Polefigures indicated that the strength of basal texture increased during processing up to fourth pass, beyond which it is seen to be weakened due to significant grain refinement. Texture development shows the formation of P fibre texture components as a result of shear deformation.
3. Strong evidence of continuous dynamic recrystallization (CDRX) is seen with the occurrence of incomplete HAGB segments during subsequent processing. It is believed that {1012} twinning alongside CDRX is present during thefirst two passes of I-ECAP, beyond which slip is the dominant grain refinement mechanism.
4. Finally, the shear deformation characteristics of I-ECAP process is very similar to ECAP process. Moreover, I-ECAP process is found to
be an effective method in refining grain structure in CP-Ti.
Acknowledgement
This work has been partially funded by the EPSRC SAMULET Project 4 with Grant no. EP/G03477X/1.
Appendix A. Supplementary material
Supplementary data associated with this article can be found in the online version athttp://dx.doi.org/10.1016/j.msea.2017.05.040.
References
[1] D.M. Brunette, P. Tengvall, M. Textor, P. Thomsen, Titanium in Medicine: Material Science, Surface Science, Engineering, Biological Responses and Medical Applications, Springer-Verlag, Berlin Heidelberg New York, 2001. [2] M. Geetha, A.K. Singh, R. Asokamani, A.K. Gogia, Ti based biomaterials, the
ultimate choice for orthopaedic implants–a review, Prog. Mater. Sci. 54 (3) (2009) 397–425.
[3] S.J. Lugowski, D.C. Smith, A.D. McHugh, J.C. Van Loon, Release of metal ions from dental implant materials in vivo: determination of Al, Co, Cr, Mo, Ni, V, and Ti in organ tissue, J. Biomed. Mater. Res. 25 (12) (1991) 1443–1458.
[4] M.A. Meyers, A. Mishra, D.J. Benson, Mechanical properties of nanocrystalline materials, Prog. Mater. Sci. 51 (4) (2006) 427–556.
[5] T.G. Langdon, Twenty-five years of ultrafine-grained materials: achieving excep-tional properties through grain refinement, Acta Mater. 61 (19) (2013) 7035–7059. [6] V.M. Segal, S.V. Dobatkin, R.Z. Valiev, Equal-channel angular pressing of metallic
materials: achievements and trends. selection of articles: Part I, Russ. Metall. 1 (2004) 1–102.
[7] V.M. Segal, V.I. Reznikov, A.E. Drobyshevskiy, V.I. Kopylov, Plastic metal working by simple shear, Russ. Met. 1 (1981) 99–104.
[8] V.M. Segal, Materials processing by simple shear, Mater. Sci. Eng. A 197 (2) (1995) 157–164.
[9] M. Furukawa, Y. Iwahashi, Z. Horita, M. Nemoto, T.G. Langdon, The shearing characteristics associated with equal-channel angular pressing, Mater. Sci. Eng. A 257 (2) (1998) 328–332.
[10] M. Furukawa, Z. Horita, T.G. Langdon, Factors influencing the shearing patterns in equal-channel angular pressing, Mater. Sci. Eng. A 332 (1–2) (2002) 97–109. [11] K. Hajizadeh, B. Eghbali, K. Topolski, K.J. Kurzydlowski, Ultra-fine grained bulk
CP-Fig. 15.(a) Higher magnification IPF map of the CP-Ti grade 2 sample in the transverse (X) plane after the second pass of I-ECAP to observe CDRX. Here blue lines represent low angle grain boundaries (LAGBs) where 1.5°≤θ≤15°, whereas thick black lines represents the high angle grain boundaries (HAGBs) whereθ> 15°. The arrows are pointing the locations of incomplete HAGB segments, (b) and (c) misorientation profile across two incomplete HAGB segments (b) L1 and (c) L2. (For interpretation of the references to color in thisfigure legend, the reader is referred to the web version of this article.)
Ti processed by multi-pass ECAP at warm deformation region, Mater. Chem. Phys. 143 (3) (2014) 1032–1038.
[12] G. Purcek, G.G. Yapici, I. Karaman, H.J. Maier, Effect of commercial purity levels on the mechanical properties of ultrafine-grained titanium, Mater. Sci. Eng. A 528 (6) (2011) 2303–2308.
[13] A.V. Sergueeva, V.V. Stolyarov, R.Z. Valiev, A.K. Mukherjee, Advanced mechanical properties of pure titanium with ultrafine grained structure, Scr. Mater. 45 (7) (2001) 747–752.
[14] V.L. Sordi, M. Ferrante, M. Kawasaki, T.G. Langdon, Microstructure and tensile strength of grade 2 titanium processed by equal-channel angular pressing and by rolling, J. Mater. Sci. 47 (22) (2012) 7870–7876.
[15] X. Zhao, X. Yang, X. Liu, C.T. Wang, Y. Huang, T.G. Langdon, Processing of commercial purity titanium by ECAP using a 90 degrees die at room temperature, Mater. Sci. Eng. A 607 (0) (2014) 482–489.
[16] V.V. Stolyarov, Y.T. Zhu, I.V. Alexandrov, T.C. Lowe, R.Z. Valiev, Grain refinement and properties of pure Ti processed by warm ECAP and cold rolling, Mater. Sci. Eng. A 343 (1–2) (2003) 43–50.
[17] A. Balyanov, J. Kutnyakova, N.A. Amirkhanova, V.V. Stolyarov, R.Z. Valiev, X.Z. Liao, Y.H. Zhao, Y.B. Jiang, H.F. Xu, T.C. Lowe, Y.T. Zhu, Corrosion resistance of ultrafine-grained Ti, Scr. Mater. 51 (3) (2004) 225–229.
[18] I.P. Semenova, G.K. Salimgareeva, V.V. Latysh, T. Lowe, R.Z. Valiev, Enhanced fatigue strength of commercially pure Ti processed by severe plastic deformation, Mater. Sci. Eng. A 503 (1–2) (2009) 92–95.
[19] S.L. Semiatin, D.P. DeLo, V.M. Segal, R.E. Goforth, N.D. Frey, Workability of commercial-purity titanium and 4340 steel during equal channel angular extrusion at cold-working temperatures, Metall. Mater. Trans. A 30 (5) (1999) 1425–1435. [20] G. Lütjering, J.C. Williams, Titanium, Springer, 2003.
[21] M.H. Yoo, Slip, twinning, and fracture in hexagonal close-packed metals, Metall. Trans. A 12 (3) (1981) 409–418.
[22] N. Stanford, U. Carlson, M.R. Barnett, Deformation Twinning and the Hall–Petch Relation in Commercial Purity Ti, Metall. Mater. Trans. A 39 (4) (2008) 934–944. [23] Y.B. Chun, S.H. Yu, S.L. Semiatin, S.K. Hwang, Effect of deformation twinning on microstructure and texture evolution during cold rolling of CP-titanium, Mater. Sci. Eng. A 398 (1–2) (2005) 209–219.
[24] A.A. Salem, S.R. Kalidindi, R.D. Doherty, Strain hardening of titanium: role of deformation twinning, Acta Mater. 51 (14) (2003) 4225–4237.
[25] S. Nemat-Nasser, W.G. Guo, J.Y. Cheng, Mechanical properties and deformation mechanisms of a commercially pure titanium, Acta Mater. 47 (13) (1999) 3705–3720.
[26] V.V. Stolyarov, Y.T. Zhu, I.V. Alexandrov, T.C. Lowe, R.Z. Valiev, Influence of ECAP routes on the microstructure and properties of pure Ti, Mater. Sci. Eng. A 299 (1–2) (2001) 59–67.
[27] I. Kim, W.-S. Jeong, J. Kim, K.-T. Park, D.H. Shin, Deformation structures of pure Ti produced by equal channel angular pressing, Scr. Mater. 45 (5) (2001) 575–580. [28] I. Kim, J. Kim, D.H. Shin, X.Z. Liao, Y.T. Zhu, Deformation twins in pure titanium
processed by equal channel angular pressing, Scr. Mater. 48 (6) (2003) 813–817. [29] D.H. Shin, I. Kim, J. Kim, Y.S. Kim, S.L. Semiatin, Microstructure development
during equal-channel angular pressing of titanium, Acta Mater. 51 (4) (2003) 983–996.
[30] I. Kim, J. Kim, D.H. Shin, C.S. Lee, S.K. Hwang, Effects of equal channel angular pressing temperature on deformation structures of pure Ti, Mater. Sci. Eng. A 342 (1–2) (2003) 302–310.
[31] Y.J. Chen, Y.J. Li, J.C. Walmsley, S. Dumoulin, P.C. Skaret, H.J. Roven, Microstructure evolution of commercial pure titanium during equal channel angular pressing, Mater. Sci. Eng. A 527 (3) (2010) 789–796.
[32] Y.J. Chen, Y.J. Li, J.C. Walmsley, S. Dumoulin, H.J. Roven, Deformation structures of pure titanium during shear deformation, Metall. Mater. Trans. A 41 (4) (2010) 787–794.
[33] Y.J. Chen, Y.J. Li, J.C. Walmsley, S. Dumoulin, S.S. Gireesh, S. Armada, P.C. Skaret, H.J. Roven, Quantitative analysis of grain refinement in titanium during equal channel angular pressing, Scr. Mater. 64 (9) (2011) 904–907.
[34] C.S. Meredith, A.S. Khan, The microstructural evolution and thermo-mechanical behavior of UFG Ti processed via equal channel angular pressing, J. Mater. Process. Technol. 219 (0) (2015) 257–270.
[35] A. Azushima, R. Kopp, A. Korhonen, D.Y. Yang, F. Micari, G.D. Lahoti, P. Groche, J. Yanagimoto, N. Tsuji, A. Rosochowski, A. Yanagida, Severe plastic deformation (SPD) processes for metals, CIRP Ann.–Manuf. Technol. 57 (2) (2008) 716–735. [36] A. Rosochowski, L. Olejnik, FEM simulation of incremental shear, AIP Conf. Proc.
907 (1) (2007) 653–658.
[37] A. Rosochowski, L. Olejnik, M.W. Richert, Double-billet incremental ECAP, Mater. Sci. Forum Trans. Tech. Publ. (2008) 139–144.
[38] L. Olejnik, A. Rosochowski, M.W. Richert, Incremental ECAP of plates, Mater. Sci. Forum Trans. Tech. Publ. (2008) 108–113.
[39] A. Rosochowski, M. Rosochowska, L. Olejnik, B. Verlinden, Incremental equal channel angular pressing of sheets, in: Proceedings of the 13th International Conference on Metal Forming, Japan 2010, Steel Research International, 2010, pp. 470–473.
[40] A. Rosochowski, in: Ed. A. Rosochowski, Chapt 2: Incremental ECAP–Severe Plastic Deformation Technology, Whittles Publishing, (ISBN: 978-1-84995-091-6), 2017.
[41] A. Rosochowski, L. Olejnik, Incremental equal channel angular pressing for grain refinement, Mater. Sci. Forum 674 (2011) 19–28.
[42] M.J. Qarni, G. Sivaswamy, A. Rosochowski, S. Boczkal, Effect of incremental equal channel angular pressing (I-ECAP) on the microstructural characteristics and mechanical behaviour of commercially pure titanium, Mater. Des. 122 (C) (2017) 385–402.
[43] Y. Iwahashi, Z. Horita, M. Nemoto, T.G. Langdon, The process of grain refinement in equal-channel angular pressing, Acta Mater. 46 (9) (1998) 3317–3331. [44] K. Oh-Ishi, Z. Horita, M. Nemoto, M. Furukawa, T.G. Langdon, Optimizing the
rotation conditions for grain refinement in equal-channel angular pressing, Metall. Mater. Trans. A 29 (7) (1998) 2011–2013.
[45] N.P. Gurao, G. Manivasagam, P. Govindaraj, R. Asokamani, S. Suwas, Effect of texture and grain size on bio-corrosion response of ultrafine-grained titanium, Metall. Mater. Tran