Abstract
Pension systems and, as ratios of GDP, pension expenditures show large variation among countries. This variation reflects, above all, demographic factors and differences in the level of insurance protection, the latter tending to increase with the level of development. The focus of this paper is pension developments and reforms in the FOUR transition countries: the Czech Republic, Hungary, Poland and Romania, during the 1990s. In terms of key pension statistics, Poland and Romania are clear outliers not just among the FOUR, but also in Europe. The greater pension expenditures in Hungary and, especially, Poland are in part inherited from the socialist system and in part caused by the more radical restructuring reforms which have been adopted since the collapse of that system in 1988-1990. These greater expenditures have prompted these two countries to start replacing gradually their PAYG-DB system with a three-pillar mixed system, in which private pension funds are intended to become a large, eventually the dominant, component. This chapter gives an account of the main aims and principles of the reform measures which came into force in Hungary in 1998 and in Poland in 1999. Also reported are estimates of the public debt implicit in the obligation of the pre-reform state pension system to pay benefits to current pensioners and to current workers. These estimates are found to be, for Hungary, Poland and the Czech Republic, significantly higher than in main European Union countries.
Pension Problems and Reforms in the Czech
Republic, Hungary, Poland and Romania
Stanislaw Gomulka
Published by
Centre for Economic Performance
London School of Economics and Political Science Houghton Street
Pension Problems and Reforms in the Czech
Republic, Hungary, Poland and Romania
Stanislaw Gomulka
1. Introduction 1
2. Pension Developments During Transition 1
3. The FOUR Compared with 2nd Wave of EU Entrants 5
4. Key Problems of the Pre-Reform System 6
5. Implicit Public Debt of the Pre-Reform Pension System 7 6. Aims and Principles of the Reforms in Hungary (1998)
and Poland (1999) 10
7. Reform Developments and Pension Projections 12
8. Conclusions 14
Acknowledgements
The author wishes to acknowledge the helpful suggestions of Marek Dabrowski and Jacek Rostowski. This paper draws on my joint work with Piotr Jaworski and Marek Styczen. This work was reported in discussion papers circulated by CASE and the Central European University, and is listed in the references section.
Stanislaw Gomulka is a member of the Centre for Economic Performance and the Department of Economics, London School of Economics, and of CASE.
Pension Problems and Reforms in
the Czech Republic, Hungary, Poland and Romania
1Stanislaw Gomulka
1.
Introduction
All transition countries inherited pension systems based on the principles of pay-as-you-go and defined-benefit (PAYG-DB). In the early years of operation, such systems had advantages over a fully-funded, defined-contribution (FF-DC) system. For, under a PAYG-DB arrangement, those who retire receive pension benefits immediately and contributions initially tend to exceed the payments. These advantages, however, disappear later on, when population (and employment) growth rates decline and when people live longer after retirement. Under such circumstances, an FF-DC programme has the advantages of greater flexibility and transparency, hence greater financial viability. The changeover from PAYG-DB systems to FF-DC systems is therefore a worldwide trend. In transition economies, this trend was reinforced by a crisis of pension finances due to three additional factors (1) large transformational recession, (2) extension of pension insurance to farmers and (3) rapid expansion of the informal economy. Factor 1 increased expenditures as early retirements became a popular way of containing the unemployment problem; it also reduced revenues as employment declined. Factor 2 increased net expenditures since farmers’ contributions have been insignificant. Factor 3 reduced revenues. These factors have therefore made this changeover more urgent and, in some countries, more rapid.
This paper focuses on pension problems, developments and reforms in FOUR transition countries: the Czech Republic, Hungary, Poland and Romania, during the 1990s. Its main purpose is threefold, to explain the large differences in these developments among the FOUR, to relate them to corresponding developments in some of the key European Union (EU) and OECD countries, and to explain the main aims and principles of the reforms.
2.
Pension Developments During Transition
An earlier survey of pension systems at the beginning of transition was made by Kopits (1992). The topic was revisited recently by Cangiano, Cottarelli and Cubeddu (1998). These surveys identified a number of common features, or ‘stylized facts’, with respect to pension developments. These are as follows:
(i) Early retirement reached significant proportions in most countries, as the pension system was used to cushion the effect of transition on open unemployment;
(ii) The system dependency ratio (the ratio between pensioners and contributors) has been rising rapidly, reflecting both a sharp decline in the number of contributors and a rapid growth of the number of pensioners.
1
To appear in M. Dabrowski and J. Rostowski (eds.), The Eastern Enlargement of the EU, Kluwer Academic Publishers, forthcoming in 2001.
(iii) The fall in the number of contributors reflected both a large drop in total output and a sharp increase in the share of the informal economy in that output.
I propose to augment this list by three additional stylised facts:
(iv) The cushioning use of the pension system – fact (i) - was more common in Central and Eastern Europe (CEE) than in the countries of the FSU. It was also more common in countries where restructuring was deeper and faster.
(v) In several countries, the rise in the ratio between pensioners and contributors reflected the extension of pension protection to farmers. And,
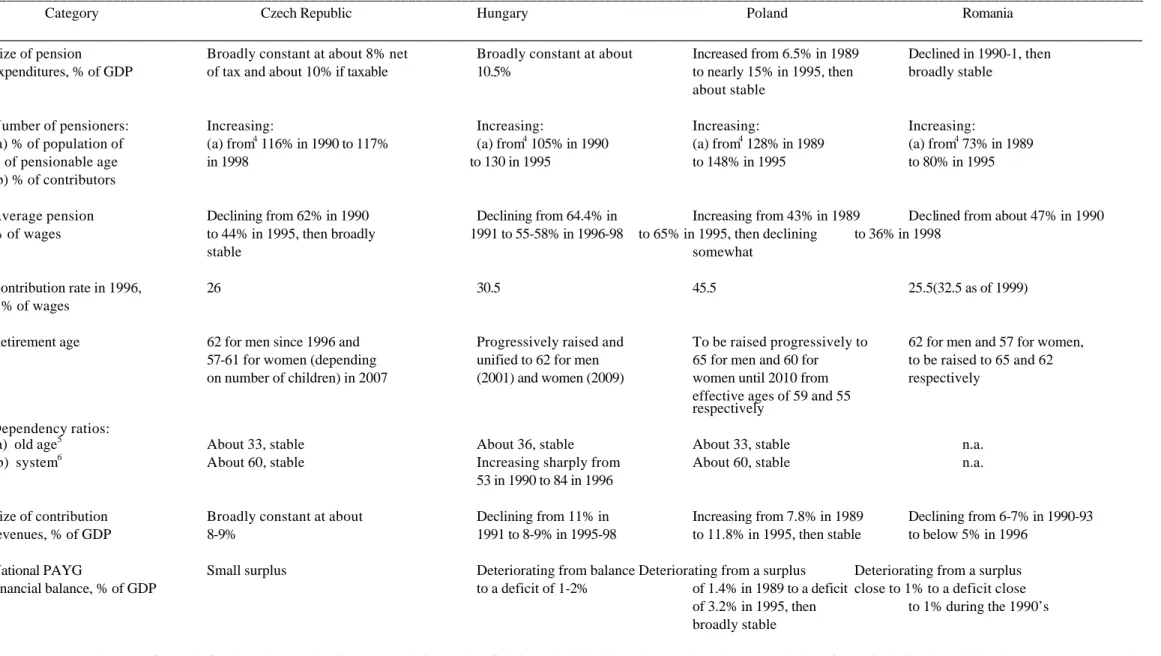
(vi) The relaxation of health criteria for entitlement to invalidity pensions reflected poorer work prospects, possibly also increased incidences of corruption among the medical profession. Despite these common features, developments in pension finances have been remarkably diverse. As can be seen from Table 1, this diversity also applies to the FOUR countries which concern us here. The diversity is driven mainly by two factors: an exceptionally high number of non-retirement pensioners in Poland and an exceptionally low replacement rate in Romania. The first factor is making Poland an outlier not only in Central and Eastern Europe, but also world-wide. The second factor is making Romania similar to the countries both of the FSU and most of the OECD (Chand and Jaeger, 1996 Table 6), but different from the main EU countries: Germany, France and Italy, where replacement rates are close to those of Hungary and Poland.
Given the weight of non-retirement pensions in Poland, it is instructive to look in greater detail at the composition of these pensions. This is done in Table 2 for all categories of pensioners in several years and in Table 3 for several types of pensioners outside agriculture in a single year, 1996.
3
Table 1. Major Trends in Pension Finances of the FOUR, 1990-1998
________________________________________________________________________________________________________________________________________________________ Category Czech Republic Hungary Poland Romania
________________________________________________________________________________________________________________________________
Size of pension Broadly constant at about 8% net Broadly constant at about Increased from 6.5% in 1989 Declined in 1990-1, then expenditures, % of GDP of tax and about 10% if taxable 10.5% to nearly 15% in 1995, then broadly stable
about stable
Number of pensioners: Increasing: Increasing: Increasing: Increasing:
(a) % of population of (a) from4 116% in 1990 to 117% (a) from4 105% in 1990 (a) from4 128% in 1989 (a) from4 73% in 1989 of pensionable age in 1998 to 130 in 1995 to 148% in 1995 to 80% in 1995 (b) % of contributors
Average pension Declining from 62% in 1990 Declining from 64.4% in Increasing from 43% in 1989 Declined from about 47% in 1990 % of wages to 44% in 1995, then broadly 1991 to 55-58% in 1996-98 to 65% in 1995, then declining to 36% in 1998
stable somewhat
Contribution rate in 1996, 26 30.5 45.5 25.5(32.5 as of 1999) % of wages
Retirement age 62 for men since 1996 and Progressively raised and To be raised progressively to 62 for men and 57 for women, 57-61 for women (depending unified to 62 for men 65 for men and 60 for to be raised to 65 and 62 on number of children) in 2007 (2001) and women (2009) women until 2010 from respectively
effective ages of 59 and 55 respectively
Dependency ratios:
(a) old age5 About 33, stable About 36, stable About 33, stable n.a. (b) system6 About 60, stable Increasing sharply from About 60, stable n.a.
53 in 1990 to 84 in 1996
Size of contribution Broadly constant at about Declining from 11% in Increasing from 7.8% in 1989 Declining from 6-7% in 1990-93 revenues, % of GDP 8-9% 1991 to 8-9% in 1995-98 to 11.8% in 1995, then stable to below 5% in 1996
National PAYG Small surplus Deteriorating from balance Deteriorating from a surplus Deteriorating from a surplus financial balance, % of GDP to a deficit of 1-2% of 1.4% in 1989 to a deficit close to 1% to a deficit close
of 3.2% in 1995, then to 1% during the 1990’s broadly stable
Notes: 1) Assumes 2% rate of growth of real pensions and 3% discount rate.2) Current beneficiaries only 3) Outside agriculture 4) Pension age population refers to: in the Czech Republic and Hungary, women over the age of 55 and men over the age of 60; in Poland and Romania, all over 60; 5) 60+ years old as a percentage of 20-59 years old, 6) Pensioners as a percentage of contributors or employees.
-5- Table 2
Poland: Non-Retirement Pensions and Pensioners, 1989-99
____________________________________________________________________________ Category 1989 1995 1998 ____________________________________________________________________________ A. Pensioners I. Non-retirement, as % of retirement 1. Outside agriculture 139 117 114 2. In agriculture 30 63 73 3. Total 98 100 104 ____________________________________________________________________________
II. Non-retirement, as % of population
1. Outside agriculture 10.4 12.2 12.8 2. In agriculture 5.3 10.3 10.6 3. Total 9.4 11.8 12.4 ____________________________________________________________________________
B. Pensions expenditures
I. Non-retirement, as ratio of retirement
1. Outside agriculture 1.2 0.8 0.9 2. In agriculture 0.4 0.6 0.7 3. Total 1.0 0.8 0.8 ____________________________________________________________________________ II. Non-retirement, as % of GDP 1. Outside agriculture 2.9 5.7 5.5 2. In agriculture 0.3 0.9 0.9 ____________________________________________________________________________ Note: With respect to agriculture, the population is taken to be 20% of the total and GDP to be 5% of the total.
Source: Government of Poland ‘Strategy for public finances and economic development, Poland 2000-2010’, June 1999, Table 1.
Table 3
Poland: Non-Retirement Pensions, Pensioners and Public Implicit Debt In 1996, Outside Agriculture
Percent, 100 = retirement pension Type of benefit Number of
pensioners
Average pension Implicit debt 1. Men, invalidity of category
I 12 85 12
II 43 70 41
III 51 62 47
2. Women, invalidity of category
I 9 89 8
II 28 74 26
III 30 62 26
3. Survivors, all 84 70 58 Source: S. Gomulka and P. Jaworski (1998).
terms of the number of pensioners been inherited from pre-transition period, but its weight, in terms of expenditures in relation to GDP, has increased during transition. Moreover, the model of pension payments established outside agriculture has during the 1990s been extended to the agriculture population, aggravating further the pressure on public finances.
These data also show that non-retirement pensions outside agriculture were already unusually numerous in 1989, probably reflecting the exceptionally strong bargaining power of Polish workers for many years before the start of transition. The observed rapid convergence of the incidence of non-retirement pensions in agriculture to that outside agriculture after 1989 also reflects the implementation of pension privileges granted to farmers before 1989. However, Poland is the only country of the FOUR among all transition countries (except Slovenia), where the replacement ratio increased sharply during transition since 1989. This increase took place at the start of transition, mainly in the year 1991. The sharp rise of the replacement rate was unintended by the authorities, since the indexation rule used was based on wages. The simultaneous increases of this rate and of the ratio of pensioners to contributors at the start of transition undermined public finances during the entire transition period. As early as 1993 an attempt was made to reverse this upward trend of pension expenditures as a proportion of GDP, by the introduction of the “0.91” rule, which reduced pensions by 9%. However, by 1993 pensioners in Poland constituted one third of the entire electorate. Under their pressure, after 1994 the 0.91 rule was gradually phased out. The threat of a fiscal crisis in the pension system persuaded the authorities, in 1996, to replace the wage indexation rule by a price indexation rule. This change proved effective in halting the upward trend of the ratio of pension expenditures to GDP. Indeed, since 1996, this ratio started to decline somewhat.
The number of pensioners as a proportion of the population of pensionable age is an indicator of the extent of early retirement privileges and the treatment of farmers. This proportion increased in all the FOUR countries, but especially sharply in Poland and Hungary. Again, Poland and Romania are clear outliers.
3.
The FOUR Compared with 2
ndWave of EU Entrants
The key data on pension expenditures and pension liabilities for major industrial countries are given in Table 4. Both the magnitude and the inter-country variation of these data are similar just as in our FOUR transition countries. Comparisons with the four countries which represented the 2nd wave of EU entrants may also be of interest. These data are given in Table 5.
Table 4
Social Pension Expenditures by Type of Benefit (1994, in percent of GDP)
_____________________________________________________________________________________ Country Retirement Invalidity Survivors TOTAL
& family
_____________________________________________________________________________________ Greece 8.5 1.4 1.7 11.6
-7-
Spain 7.4 1.8 2.5 11.7
_____________________________________________________________________________________ Source: Eurostat, Social Protection Entrepreneurs and Receipts, 1980-1994, after M.V. Rostagno and F.Util (1998, Table 1).
These data are similar to those for the Czech Republic and Hungary. Poland’s spending on survivors’ and family pensions (1.9% of GDP in 1998) is also in line with the four EU countries. The aspect which makes Poland an outlier is mainly the size of invalidity pensions (4.5% of GDP in 1998). Compared to the unweighted average for the four EU countries (6.6% of GDP in 1994), Poland spends more on retirement pensions (8.0% in 1995 and 7.7% in 1998), but the difference is relatively small and declining. Romania, on the other hand, is a clear case of under-protection. In 1998, only 46% of the active population were covered by the social insurance system (De Menil, et al, 1999). Moreover, the replacement rate has become unusually low during transition (Table 1). Consequently, Romania’s pension expenditure, at about 5.5% of GDP, is a major factor in keeping the country’s public finances under control.
Table 5
Public Pension Schemes: Expenditures and Liabilities (in percent of GDP)
____________________________________________________________________________________ Implicit pension debt2 ___________________________ Country Expenditure in 1990 Present Present
retirees workforce ____________________________________________________________________________________ Germany1 12.3 106 115 France1 13.3 128 136 Italy 14.2 171 187 Japan 5.7 68 98 USA 6.9 32 77 ____________________________________________________________________________________ Notes: 1) 1992, 2) Assumes a sudden transition to a fully funded system, making the estimates comparable to those for our FOUR countries, see Table 6 in Section 5.
Source: S. K. Chand and A. Jaeger, 1996.
A large variation in public pension expenditures can be found also among the most developed countries (Table 5). It is noteworthy that these expenditures in the Czech Republic, Hungary and especially, Poland are comparable to the highest among these countries.
4.
Key Problems of the Pre-Reform System
The radical market-oriented reforms which the FOUR and other transition countries adopted at the end of the 1980s and the beginning of the 1990s did not extend to the pension system. Not only in the Czech Republic and Romania but also in Hungary (until 1998) and Poland (until 1999) the system remained fully state-managed, highly redistributive, and financed on a pay-as-you-go (PAYG) basis. Social security contributions continued to be strictly proportional to wages and paid fully by the employer. These contributions did not go into individual accounts, but into the single account of the State Pension Authority. They were thus effectively a form of tax collected for the specific purpose of financing current pensions. Employees remained largely unaware both of the size of their cumulative contributions and of
any link between these contributions and future pensions. The pensions themselves were calculated not on the basis of the cumulative contributions of individuals, but by a formula that in addition to contributions was taking into account several other factors as well. For most of the 1990s this formula in Poland was:
pi = 0.24w* + 0.013niwi + 0.007miwi + pi* (1)
where pi is the pension paid to an individual i at the point of retirement, w* is the national average wage, wi is the ith person average wage during the last several years (from 2 to 10) of work, ni is the number of years of work and mi is the number of non-contributory years.2 Finally, p*i stands for the pension right on account of privileges for which the individual might be eligible because of the type of work he or she had performed. We may note in formula (1) the large size of the redistributive component, 0.24w*, which is augmented by the impact of privileges for some categories of workers.3 Both redistributive components weaken the link between current earnings and future pensions, thus reducing the incentive to work.
Any individual i would judge the size of his or her pension in terms of the replacement ratio, pi /wi. The presence of large redistributive terms in (1) implies that this ratio would be high for people for whom the ratio of their own wage to the average wage, wi/w*, is low. Let ? be the replacement ratio such that the wage wi buys the same standard of living as the pension ?wi. The value of ? is person-specific, but is usually taken to be in the range between 0.6 and 0.8. Suppose ? = 0.7. The actual average replacement ratio for old-age pensioners rose, in the 90s, to a level between 0.7 and 0.8 in Poland and a level between 0.6 and 0.7 in Hungary. Thus for a large proportion of current employees in these two countries, their expected pension would have been close to or larger than 0.7 times their own earnings. Such employees would have no incentive to make private savings out of their current earnings.
The fairly radical reform policies and the rather fast economic restructuring of the 1990s rapidly aggravated the problem of financing the state pension system, from both the revenue side and the expenditure side. The number of contributors to the social security system has declined due to increased unemployment and growing evasion. On the other hand, to alleviate the social cost of transformation, early retirement was allowed and the criteria for granting disability pensions were liberalised. These measures meant a rapid rise in the number of pensioners. To meet the escalating pension bill, higher payroll taxes were imposed on the firms. The result was a higher labour cost, which became a factor discouraging employment and encouraging evasion (Golinowska, et al, 1997; Golinowska and Hausner, 1998; Palacios and Rocha, 1997).
During the 1990s, demographic changes did not make a significant contribution to the financial difficulties of the pension system in Poland in the 1990s. However, demographic projections indicate that such changes could become a major additional source of tension within the next 10 to 20 years (Styczen, 1999). In the Czech Republic and Hungary, the demographic factor has already become a source of financial tension.
5.
Implicit Public Debt of the Pre-Reform Pension System
The PAYG-DB pension system may be viewed as a social pact involving three overlapping generations:
-9-
those who work currently finance pensions of those who have already retired in exchange for a promise that their own pensions will in future be paid by the next generation of workers.
The reform adopted by Hungary and Poland and planned by Romania changes thisarrangement in a fundamental way, as social security contributions of current workers go in part to personal accounts (pillar I) and in part to private pension funds (pillar II). The capital accumulated in pillar II can no longer be used automatically by the state to pay the pensions of people other than those who effectively own it. Moreover, capital accumulated in pillar I has also individual owners. Both capitals can be used to pay current pensions, but the payments would represent a debt of the state.
Two questions may be asked. Firstly, what would be the capital needed at the beginning of the reform to settle all the future pension obligations of the state with respect of those who are already beneficiaries? Thus suppose that the transition to the new system is instantaneous, so that current contributions cannot be used at all to finance any current pensions. As this capital is not available to the pension system, it would have to be borrowed to meet future obligations to current pensioners. Therefore, the capital is a form of public debt. Because of the terms of the social pact, this debt is not a part of the official public debt before the reform. However, this debt is implicit in pension obligations and will become gradually explicit after the reform, in the course of gradual switching to the new system. The second question concerns the current value of the pension entitlements of those who, because of their past social security contributions or poor health or family circumstances, have already acquired some pension rights by the start of the reform. The capital represented by those rights is another form of the implicit public debt of the present pension system. In Tables 1 and 3 estimates of this implicit debt are reported. For the FOUR they are based on a common estimation method.
For the people who are already pensioners, the following approach is used. Suppose a specific benefit in the initial year is Y0, and assume that its rate of growth will be constant. The benefit is assumed to be defined fully by the type of pension, the age of person, and the sex of person. It is also assumed that the rate of growth of benefits is common, a constant g. The question is what should be the initial fund K0 that is just high enough to pay the benefits Y1, Y2,….,YT during an expected lifetime T, assuming that the capital still unspent at any time during this period produces a rate of return r? Thus K0 is a solution to the following problem:
Kt=(1+r)Kt-1-Yt (2)
KT=0 (3)
Yt=(1+g)Yt-1 (4)
Where t=1,2…,T. The terminal value of the capital, KT, is zero as the fund is to be spent fully by year T. The solution to this problem is:
The required initial capital is thus the present value of all future payments: Y1, Y2,….,YT with the rate of return r being the discount rate. In (5), both Y0 and T are specific for particular group of pensioners in the initial year, taken to be the first year under the new system. For example, for old-age pensioners
) 5 ( 1 1 1 0 0 i T i r g Y K
∑
= + + =outside agriculture in Poland there were 102 groups considered: 51 age classes – from 40 years old and younger to 90 years and older for each of the two sex categories. The capital K0 was compared separately for each group characterised by an age class, a type of pension, and a sex category. The numbers Y0 and T vary as between groups, but both were assumed to be common for all members of any specific group (Gomulka and Jaworski, 1998).
The method used to estimate the implicit pension debt with respect to those who acquired some pension rights by the beginning of the new system requires no new data. It is assumed, however, that the age composition of all new pensioners will be the same over time as that observed initially. This stationarity assumption also applies to the expected lifetime and the size of benefits of all members of each age group.
To explain the method, let us consider all the people who were in the initial year, say 1996, of age 21, 22,…40, and who become pensioners at the age 40. Let
V(40,20-k, 1996+k)
be the present value of all the expenditures on pensions for these 40-year olds at the point of retirement. These people become pensioners in the year 1996+k, after working and acquiring pension rights during (20-k) years of work. It is assumed that pension rights are proportional to the duration of work and subject to growth in real terms at a rate g. Hence
where k=1,…,20, and r is the discount rate. Therefore the total present value of pension rights for those people will be
As the value V(40,20-k, 1996) is known, we can compute (7) for any magnitude of g, selected to be 0, 2 and 4%, and for any value of r, chosen to be equal to 3%.
The method presented above was used to estimate implicit public (pension) debt in all FOUR countries. The estimates have been done separately for those already retired and for those still working. The results are as follows (Table 6):
) 6 ( ) 1996 , 20 , 20 ( 20 20 1 1 ) 1996 , 20 , 40 ( k V k r g k k V k − − + + = + − ) 7 ( 1 1 20 20 ) 1996 , 20 , 40 ( 20 1 k k r g k k V TV + + − − =
∑
=-11- Table 6 Implicit Pension Debt
(in percent of GDP) Country g in % Already retired Men Women Working Men Women Total Old other age Old other age
All kinds All kinds All kinds Czech Republic 0 2 4 22 14 25 18 29 23 30 14 36 18 43 26 59 76 99 59 77 105 199 251 324 Hungary2 0 2 4 Not available
Not available Not available No available 293 407 600 Poland3 0 2 4 42 40 50 48 61 58 47 38 55 44 66 52 34 42 54 50 62 78 251 302 370 Romania4 0 25 9 43 23 48 63 211
1. 0. Schneider, CASE WP No.167, 1999.
2. Z. Vajda, The Macroeconomic Implications of a Pension Reform, CASE, 1999. 3. S. Gomulka and P. Jaworski, CASE, WP No. 14, extended version, 1998. 4. G. De Menil, S. Hamayon and M. Seitan, CASE WP No.177, 1999.
This debt for the category of the already retired turns out to be close to 100% of GDP in the Czech Republic, Hungary and Romania, but close to 200% of GDP in Poland. Again the key reason for this difference is the unusually large number and size of non-retirement (invalidity and family) pensions in Poland. These pensions cost about 6.5% of GDP in Poland, which is about twice the cost in Hungary, about 3 times the cost in the Czech Republic and about 5 times the cost in Romania.
6.
Aims and Principles of the Reforms in Hungary (1998) and Poland (1999)
In both Hungary and Poland the pension reform was intended to address the key problems: large expenditures and disincentives to work and savings. These problems are in turn related to low effective retirement ages, liberal disability criteria, high replacement ratios, large redistribution through the pension formula, and privileges for some categories of workers. There was also a need to diversify the institutional architecture in two ways: by complementing compulsory contributions with voluntary ones and by complementing the state social security system with private pension funds. The motivation of the reforms was thus both microeconomic and macroeconomic. There were two main microeconomic concerns. One was to create a far tighter link than under the old system between pension benefits and pension contributions, thereby strengthening the incentive to work and the disincentive to evade. Addressing this concern required a drastic lowering of the redistributive component and the establishment of individual accounts to make the system more transparent. The other central microeconomic concern was to lower the obligatory social security contributions paid by the employer, in order to reduce labour costs and increase employment. The key macroeconomic aims of the reform were also two. One was tobring down, in both countries, the aggregate levels of public expenditures on pensions, as proportions of GDP, from the very high levels they had reached during the first phase of economic transformation. Such reductions were needed to make public finances less of an obstacle to growth, by reducing the total taxation burden and the budget deficit, and to make it rather an instrument of growth, by increasing public resources for education and infrastructure investment. The other aim was to induce the working population to save more on a voluntary basis. These micro and macro objectives were mutually compatible, and their achievement required a radical reform of the pension system. The reform was becoming urgent also for demographic reasons. These were the same as are found in many developed countries: longer post-retirement life and lower birth rate.
The reform is limited to retirement (old age) pensions outside agriculture. It involves the creation of a new institutional architecture and the introduction of new rules concerning contributions and benefits. Five principles can be identified as having guided these changes. Namely:
(a) The diversification principle: Security and efficiency of the pension system must be enhanced, and to do this is by diversifying the system between state and private funds and between obligatory and voluntary contributions. Moreover, the savings measures introduced in the obligatory part of the system must be sufficiently strong to pay for much of the cost of the reform.
(b) The distribution principle: The public part of the new system should continue to be of the PAYG type, while being made less redistributive and more transparent.
(c) The capital-funding principle: The private part of the system should be capital funded and well-regulated.
(d) The savings principle: The expenditure-savings measures introduced in the obligatory part of the system must be sufficiently strong to pay for any cost of reform, and (e) The gradual phasing-in principle: The phasing-in of the new system must be spread
over a prolonged period of time, and should not involve people near retirement. We shall briefly discuss these principles in turn.
Principle a. The system of retirement pensions for workers consists of three pillars: (I) state, (II) open pension funds and (III) other pension funds. Only pillars II and III are private, and only pillars I and II will receive obligatory contributions.
Principle b. Obligatory contributions are to remain proportional to earnings, a form of payroll tax, but will now be subject to a cut-off point equal to 2.5 times the average wage. To make the tax more transparent, half of the contribution paid before the reform by employers is added to wages and paid by employees. The key innovation, however, has been the establishment of personal accounts to which all the obligatory contributions of those in the new system would be assigned. These personal contributions, if not used as pensions, can be inherited by survivors.
Principle c. The private pension funds which constitute pillar II receive a specified part of all the obligatory contributions. However, a key question which reformers had to address was: How does one protect future pensioners from inefficient pension funds? In Poland, a two fold solution was adopted.
-13-
to force less efficient funds out of business. To prevent a collapse of the industry into a monopoly, it will be necessary to issue from time to time new licenses to new funds.
Principle d. The part of the obligatory contributions which is diverted to pillar II represents a loss of revenue to pillar I. Thus, the reform implies a deterioration of public finances in the initial phase of its implementation. To contain this deterioration, supplementary reforms are needed in pillar I. The most important of these are tighter criteria for entitlement to invalidity pensions, increasing the effective retirement age in (Poland, from 56 in 1997 to 60 for women and 65 for men; Hungary progressively raised and unified to 62 by 2001 (men) and 2009 (women)), by reducing the scope for early retirement, and reducing the rate of growth of real pensions, in Poland to a minimum of 0.15 in the years 1999-2000 and 0.20 from 2001 of the growth rate of real wages. In Hungary the indexation rule was changed from net wages to a weighted average of gross nominal wages and prices; starting in 2001, the weights are to be 0.5 and 0.5, the so-called Swiss formula. Further expenditure-saving reforms are needed to replace the subsidy component, in Poland about 95% of total spending, of the pension system for farmers. Principle e. A gradual phasing-in of the reform is intended, to protect the rights of older workers. Hence the provision of the Polish reform that all people aged 50 and above remain in the old system, while those between 30 and 50 years old will have the right of choice, and only those aged 30 and below are all compelled to join the new system. This arrangement has two advantages: it reduces sharply the political resistance to reform and it helps to contain the financial costs of its implementation. The Hungarian arrangement is even more flexible, as the new system is mandatory only for new entrants to the labour force, while all the existing workers have the right either to opt in or remain in the old system.
7.
Reform Developments and Pension Projections
In this section I shall first briefly review and then compare the pension reforms which have been implemented or approved for implementation. The purpose of this comparative review is to seek the reasons for any differences in the reform programmes.
In general, three approaches to the reform of a PAYG-DP pension system are possible: (i) reformers within the system, (ii) complete shift to a fully-funded system, and (iii) an intermediate arrangement in the form of a multi-pillar (typically three pillars) system the Czech Republic adopted strategy (i), Hungary and Poland strategy (iii), and Romania is about to adopt strategy (iii).
The Czech Republic
The Czech authorities have prepared long-term scenarios of the financial position of the public pension system for 1997-2020, taking into account demographic developments. The key finding was that “if the current replacement rate is maintained and the retirement age increases in accordance with the pension law, the premium tariff would need to increase from the current 26% to 36% in 2020”, (IMF, 1998, p.43).
Pensions are not subject to any tax in the Czech Republic, and this distorts comparisons with other countries. If taxes were applied, pension expenditures would be some 1.5% of GDP higher than officially reported. Compared to Poland, the Czech Republic has two disadvantages. One is that the unemployment rate, which was very low during most of the 1990s, started to increase sharply under the weight of the 1997-1999 recession and is likely to continue increasing in response to subsequent
restructuring. The other disadvantage is the absence of any significant pool of labour in agriculture that would swell the number of contributors to the pension system in the future.
Nevertheless, the Czech authorities decided against a wholesale pension reform, even of the intermediate and gradual three-pillar type proposed by the World Bank and adopted by Hungary and Poland. Such a wholesale reform would make explicit a substantial part of the implicit pension debt accumulated under the present system. According to Schneider (1999), “This debt is often cited as the insurmountable barrier for any (substantial) reform proposal”. The Czech response to the threat of a substantial increase of the premium tariff has been to adopt changes to the present PAYG-DB system and to implement them gradually. These changes involve above all a gradual increase in the retirement age, linking benefits more directly to contributions, and adopting a price indexation formula for pensions which is intended to lower the ratio of pensions to wages.
Hungary and Poland
In the post-WWII period, demographic trends in Hungary were similar to those in the Czech Republic. However, during the 1990s, restructuring went far deeper in Hungary, leading to a much sharper increase in the ratio of pensioners to contributors (Table 1). The replacement rate declined in both countries, but the decline was sharp in the Czech Republic and quite moderate in Hungary. In Poland this rate increased sharply during the 1990s. It would thus appear that the countries that undertook more significant restructuring, such as Hungary and Poland, were also under greater social pressure, to which they succumbed, to keep the replacement ratio high. In these countries the pension system became an extension of the social protection safetynet to ease opposition to restructuring reforms. The macroeconomic implications of this combination of deeper restructuring and larger pension transfers were larger budget deficits and higher payroll taxes in Hungary and Poland than in the Czech Republic. The further implication was that the financial pressure to reform the pension system was also greater in Hungary and Poland. The threat of a major macroeconomic instability forced Hungary to adopt a tough stabilization programme in 1995. In 1996, a government led by social democrats initiated liberal reforms of the pension system. The relevant legislation was adopted in July 1997 and, in January 1998, Hungary became the first transition country to begin implementing a 3-pillar pension system. The motivations, aims and specific principles of the Hungarian reform (Palacios and Rocha, 1997) are the same as, or similar to, those which Poland adopted one year later (Gomulka and Styczen, 1999). A broad description of these principles was given in Section 6 above. In both countries, the reform applies only to retirement pensions. However, in Hungary these pensions accounted, in late 1990s, for some 80% of all pensions expenditures, as against 55% in Poland. The latter proportion indicates that much of the pension problem in Poland still remains to be solved. As indicated earlier, Poland remains the world leader in pensions other than old age (mainly invalidity and family pensions) which are internationally exceptionally high in terms both of their number in relation to the labour force and levels in relation to wages. Moreover, there remains the problem of what to do with the financing of pensions for the agricultural community. Romania
As noted earlier - so far, during transition, pension expenditures in Romania have been kept low in relation to GDP. However, simulations indicate that the contribution rate must increase from 25.5% in
-15-
This pressure and the expected increase of the coverage of the population by pension insurance are two major factors which prompted the Romanian government, in 1999, to propose a reform of the state pension system along the Hungarian-Polish model (G. De Menil, et al, 1999).
8.
Conclusions
Demographic trends during the years 2000-2050 (for which projections are typically made), are expected to be similar in the FOUR to the major EU countries. Populations will be either stable (Poland, Romania, France, UK) or declining (Hungary, the Czech Republic, Germany, Italy). Dependency ratios (65+ to 15-64 year olds) are projected to increase in most countries, including our FOUR, at a historically unusual pace. These ratios in the four EU countries listed above are expected to increase from about 24% in 2000 to about 40-45% in France and Italy and 50-60% in Germany and Italy (Chand and Jaeger, 1996). In Poland this ratio is projected to increase from 17.7% in 2000 to 40.9% in 2050 (Styczen, 1999), and in Hungary from about 25% in 2000 to about 40% in 2050 (Palacios and Rocha, 1997). The elderly population itself is projected to age considerably in most countries. This is indicated by the ‘very elderly’ ratio (75+ to 65+), which is expected to increase, in the four EU countries, from about 40-45% in 2000 to about 60% in 2050. This ratio in Poland is projected to increase from about 40% in 2000 to about 51% in 2035 and then to decline to 42% in 2050 (Styczen, 1999).
Pension systems and pension expenditures show large variations among countries worldwide. This variation appears to reflect mainly demographic factors and differences in the level of insurance protection, the latter tending to increase with the level of development. The focus of this paper are pension developments and reforms in the FOUR transition countries: the Czech Republic, Hungary, Poland and Romania, during the 1990s. Poland and Romania are found to be clear outliers among the FOUR in terms of key pensions statistics. The study suggests that the greater pension expenditures in Hungary and Poland are in part inherited (especially in Poland) and in part caused by the more radical restructuring reforms, and that these greater expenditures have in turn prompted these two countries to start replacing gradually their PAYG-DB system with a three-pillar mixed system, with private pension funds constituting a large component of the reformed system.
References
Augustinovics, M. (1997), Chapter 1 in Pension Systems and Reforms: Britain, Hungary, Italy, Poland, Sweden, Final Report, EC’s Phare Ace Programme 1995, Final Report, Budapest. Cangiano, M., Cottarelli, C. and Cubeddu, L. (1998), ‘Pension Developments and Reforms in Transition
Economies’, IMF, WP No. 98/151.
Chand, S. K., and Jaeger, A. (1996), ‘Aging Populations and Public Pension Schemes’, IMF, Washington D.C., Occasional Paper No.147.
De Menil, G., Hamayon, S. and Seitan, M. (1999), ‘Romania’s Pension System: The Weight of the Past’, CASE, WP. No.177, Warsaw.
Golinowska, S., Czepulis-Rutkowska, Z. and Szczur, M. (1997), ‘The Case of Poland’, in Pension Systems and Reforms: Britain, Hungary, Italy, Poland and Sweden, EC’s Phare ACE Programme 1995, Final report, Budapest.
Golinowska, S. and Hausner, J. (1998), Political Economy of the Pensions Reform, CASE, Report No. 15, Warsaw (in Polish).
Gomulka, S. and Jaworski, P. (1998), ‘Implicit Public Debt of the Polish Social Security System’, CASE-CEU, WP. No.14.
Gomulka, S. and Styczen, M. (1999), ‘Estimating the Impact of the 1999 Pension Reform in Poland, 2000-2050’, CASE, WP. No. June.
IMF, (1998) ‘Article IV Consultation with the Czech Republic’, March 6, PIN No. 98/12.
Kopits, G. (1992), ‘Social Security’, in V. Tanzi (ed.), Fiscal Policies in Economics in Transition, IMF, Washington, D.C.
Nestor, B. and Vajda, Z. (1999), ‘Does a Pensions Overhang Threaten Macroeconomic Stability? The Case for Hungary’, Central European University, mimeo, May, Budapest.
Palacios, R. and Rocha, R. (1997), ‘The Hungarian Pension System in Transition’, mimeo, World Bank, Budapest.
Polish Government, (1999), ‘Strategy of Public Finances and Economic Development: Poland 2000-2010’, June, Ministry of Finance, Warsaw.
-17- 167, June, Warsaw.
Styczen, M. (1999), ‘Socio-Demographic Forecast of Poland, 1997-2050’, for Modeling Incomes and Social Security Retirement Pension’, CASE Working Paper No.
Vajda, Z. (1999), ‘The Macroeconomic Implications of Pension Reforms’, CASE, Reports, Warsaw.
CENTRE FOR ECONOMIC PERFORMANCE Recent Discussion Papers
479 S. Nickell T. Jones G. Quintini
A Picture of the Job Insecurity Facing British Men
478 C. Dougherty Numeracy, Literacy and Earnings: Evidence from the National Longitudinal Survey of Youth
477 P. Willman The Viability of Trade Union Organisation: A Bargaining Unit Analysis
476 D. Marsden S. French K. Kubo
Why Does Performance Pay De-Motivate? Financial Incentives versus Performance Appraisal
475 S. Gomulka Macroeconomic Policies and Achievements in Transition Economies, 1989-1999
474 S. Burgess H. Turon
Unemployment Dynamics, Duration and Equilbirum: Evidence from Britain
473 D. Robertson J. Symons
Factor Residuals in SUR Regressions: Estimating Panels Allowing for Cross Sectional Correlation
472 B. Bell S. Nickell G. Quintini
Wage Equations, Wage Curves and All That
471 M. Dabrowski S. Gomulka J. Rostowski
Whence Reform? A Critique of the Stiglitz Perspective
470 B. Petrongolo C. A. Pissarides
Looking Into the Black Box: A Survey of the Matching Function
469 W. H. Buiter Monetary Misconceptions
468 A. S. Litwin Trade Unions and Industrial Injury in Great Britain 467 P. B. Kenen Currency Areas, Policy Domains and the
Institutionalization of Fixed Exchange Rates
465 F. Green S. McIntosh
Working on the Chain Gang? An Examination of Rising Effort Levels in Europe in the 1990s
464 J. P. Neary R&D in Developing Countries: What Should Governments Do?
463 M. Güell Employment Protection and Unemployment in an Efficiency Wage Model
462 W. H. Buiter Optimal Currency Areas: Why Does the Exchange Rate Regime Matter?
461 M. Güell Fixed-Term Contracts and Unemployment: An Efficiency Wage Analysis
460 P. Ramezzana Per Capita Income, Demand for Variety, and International Trade: Linder Reconsidered
459 H. Lehmann J. Wadsworth
Tenures that Shook the World: Worker Turnover in Russia, Poland and Britain
458 R. Griffith S. Redding J. Van Reenen
Mapping the Two Faces of R&D: Productivity Growth in a Panel of OECD Industries
457 J. Swaffield Gender, Motivation, Experience and Wages
456 C. Dougherty Impact of Work Experience and Training in the Current and Previous Occupations on Earnings: Micro Evidence from the National Longitudinal Survey of Youth
455 S. Machin Union Decline in Britain
454 D. Marsden Teachers Before the ‘Threshold’ 453 H. Gospel
G. Lockwood P. Willman
The Right to Know: Disclosure of Information for Collective Bargaining and Joint Consultation
452 D. Metcalf K. Hansen A. Charlwood
Unions and the Sword of Justice: Unions and Pay Systems, Pay Inequality, Pay Discrimination and Low Pay
451 P. Martin H. Rey
Financial Integration and Asset Returns
To order a discussion paper, please contact the Publications Unit Tel 020 7955 7673 Fax 020 7955 7671 Email info@cep.lse.ac.uk