Sharing Social Content from Home:
A Measurement-driven Feasibility Study
Massimiliano Marcon, Bimal Viswanath, Meeyoung Cha
†, Krishna P. Gummadi
MPI-SWS
{mmarcon,bviswana,gummadi}
@mpi-sws.org
†KAIST
[email protected]
ABSTRACT
Today, OSN sites allow users to share data using a cen-trally controlled web infrastructure. However, if users shared data directly from home, they could potentially retain full control over the data (i.e., what to share, whom to share with). This paper investigates the feasibility of alternative decentralized architectures that allow users to share their data directly from home. Specifically, we (a) characterize social content workloads using data gathered from the pop-ular Flickr and YouTube social networks and (b) charac-terize home networks using data gathered from residential gateways deployed in a number of households. We use the data from these measurements to evaluate the potential for delivering social content directly from users’ homes.
Categories and Subject Descriptors
C.4 [Performance of Systems]: Design studiesGeneral Terms
Measurement, Performance, Design
Keywords
User-generated content, social content, content distribution
1.
INTRODUCTION
Online social networks (OSNs) like Facebook, MySpace, and YouTube have become extremely popular. According to Nielson Online [12], OSN sites are visited by 75% of all active Internet households, for an average of 6 hours and 13 minutes a month. One of the primary activities of OSN users is sharing content with friends (e.g., status updates, web links, photos, videos) [1]. Because OSNs have made it easy for anyone to create, publish, distribute and consume content, the amount of data shared on such sites has grown massively. For instance, Facebook users uploaded more than 15 billion photos to date and continue to upload 220 million new photos every week. In fact, Facebook is the biggest photo-sharing site on the web [8], demanding 1.5 petabytes Permission to make digital or hard copies of all or part of this work for personal or classroom use is granted without fee provided that copies are not made or distributed for profit or commercial advantage and that copies bear this notice and the full citation on the first page. To copy otherwise, to republish, to post on servers or to redistribute to lists, requires prior specific permission and/or a fee.
NOSSDAV’11,June 1–3, 2011, Vancouver, British Columbia, Canada. Copyright 2011 ACM 978-1-4503-0752-9/11/06 ...$10.00.
of storage and 25 terabytes of additional storage every week. Given the trends, we expect that personal data shared on OSNs would account for a significant fraction of the entire Internet traffic.
Personal data that is shared on OSNs—which we call so-cial content—is different from other web content. When people publish content on the web, typically their intent is to make the content accessible to Internet users everywhere. In contrast,social contenthas a limited intended audience. In some cases the audience is explicitly determined by the user or the site’s policy (e.g., content can only be seen by friends). At other times, the audience is implicitly limited by the nature of the content. For example, a user’s vacation pictures will be of interest primarily to people in the user’s social circle.
1.1 The current data sharing architecture
Despite the fundamental differences between social and web content, OSN users today share data using content delivery architectures that were designed for traditional web content. Typically, users upload their content to centrally managed OSN servers in remote data centers, where the content is stored, often after having been converted to a lower-quality format that suits OSNs’ storage requirements. Like con-tent uploads, concon-tent downloads in OSNs also rely on the traditional web content delivery architecture. For instance, pictures uploaded to Facebook are delivered to users by the Akamai content delivery network (CDN), whose caches are deployed over geographically diverse regions in order to pro-vide satisfying response times to users.While the traditional web infrastructure scales well, it has several drawbacks when used for social content. One immediate drawback is that users lose control over their data [11, 13]. Several aspects contribute to this loss of con-trol, including:
1. Constraints on content shared:OSN users sharing per-sonal data are often subject to various site-specific con-straints. Some sites allow particular types of contents to be shared but not others (e.g. Facebook and Flickr allow pictures and videos but not music). OSNs like Facebook and YouTube constrain the size and the res-olution at which multimedia content can be shared.
2. Ownership and copyrights: Users who upload personal content to OSNs are often subject to complex (and dy-namically changing) terms of ownership rights. For
ex-ample, many OSNs like Facebook demand fairly broad rights to use the content shared on their sites.1 3. Privacy:The last but perhaps most widely recognized
concern with sharing data using OSNs is the associ-ated loss of privacy. OSNs are known to change their privacy settings for uploaded content in ways that of-ten catch ordinary users off-guard and compromise the privacy of the data they share [9, 14].
Another drawback is that managing the deluge of social content is becoming increasingly challenging and expensive for the OSN service providers [8]. The traditional web deliv-ery infrastructure is optimized to serve highly popular con-tent that lends itself to performance improvements through CDN caching. Social content, however, is of interest to a small audience and hence unlikely to become very popular. In fact, in Section 2, our study reveals that up to 97% of all photos shared over the Flickr social network and 44% of all videos shared over the YouTube social network are never accessed during the course of a given week. This translates to huge amounts of wasted storage capacity in data centers. Furthermore, the 3% of photos and 56% of videos that are accessed are only requested a small number of times, which reduces the effectiveness of CDN caching.
1.2 Exploring alternative architectures
In light of the above drawbacks with traditional centralized delivery architectures, researchers have started exploring al-ternative content sharing designs. One particularly appeal-ing proposal is to share social content directly from users’ homes. With home-based sharing, users can regain con-trol over their social content. Furthermore, recent trends such as the availability of large, inexpensive home storage devices and always on, high-speed broadband connectivity bode well for a future where data is shared from homes. Finally, because most social content is generated by users in their homes, home-based sharing eliminates the need for uploading content to remote data centers.Recent proposals for home-based content sharing include PeerSon [2], which sketches a social network that runs on a peer-to-peer (P2P) network, where individual users manage their own storage and run the distributed hash table (DHT) to route content. In addition to purely distributed designs, there are also hybrid designs that utilize home networks as well as external network entities. One such example is Vis-a-Vis [13], a system that relies on users’ desktop machines and the cloud computing architecture to exchange content. Another example is Diaspora [5], a recent project that aims to create a fully-decentralized OSN entirely controlled by end-users. Diaspora is a network of personal servers that can run in end-users’ homes or other infrastructure.
1.3 Our goals and contributions
While the above proposals have attracted a lot of atten-tion, it is still unclear how well they would work in prac-tice. Unlike centralized infrastructures like data centers and CDNs that are well provisioned and well managed by ex-pert operators, home networks have limited resources (both storage and bandwidth) and are managed by lay users. Con-sequently, there are several unresolved concerns about the availability and performance of home-based content sharing architectures.
1
Facebook terms of use: http://www.facebook.com/#! /terms.php?ref=pf
In this paper, we address these concerns by presenting a measurement-driven feasibility study of sharing social con-tent from homes. To conduct this study, we first needed to understand (a)the characteristics of OSN workloads, i.e., patterns of social content uploads and downloads, and (b)
the characteristics of home networks, i.e., the availability and utilization of residential access links. To this end, we gathered and analyzed detailed real-world traces from OSNs and home networks. Later, we used these traces to analyze the extent to which social content can be stored and deliv-ered from users’ homes.
To summarize our key findings here: (1) We found that the vast majority of OSN users upload a relatively small amount of content (in the order of a few gigabytes), and that a large fraction of the content is requested rarely. (2) Broadband links are scarcely utilized and have high avail-ability. However, in order to achieve high availability an always-on device is required, like for example a home gate-way. (3) When OSN workloads are served from an always-on home gateway, most of the content can be successfully de-livered. However, resources in restricted home environments may not be sufficient to deliver a small fraction of content that is highly popular. Such bandwidth-demanding content might be better served by a centralized architecture. Over-all, our study indicates that it is feasible to deliver most social content directly from user homes.
2. SOCIAL CONTENT WORKLOADS
OSNs have changed the way content is shared on the In-ternet. In this section we study the characteristics of OSN content using real traces gathered from popular OSN sites, and focus on the differences between OSN and the tradi-tional web content.2.1 Datasets
We implemented a web crawler for flickr.com and youtube.com, which are popular sites that allow people to share content with their friends. Our crawler gathered de-tailed information about the uploads and downloads of pub-licly available content from these sites.
• Flickr: We randomly chose 11,715 users from the list
of 2.5 million users gathered by [4]. We crawled the profile pages of these users daily for 19 consecutive days. In total, these users had uploaded 1,324,080 pub-licly accessible photos. For each photo, we recorded the number of daily views received, as well as meta-data, like photo size, tags, and favorite markings.
• YouTube: We randomly chose 77,575 users from the
list of YouTube users gathered by [3]. We collected information about the videos uploaded by these users. In total, these users had uploaded 1,251,492 publicly accessible videos. We collected the number of daily views for all of these videos over a period of 166 days using the “StatisticsAndData” feature in YouTube. Ideally we would have liked to include data from an OSN site like Facebook, but obtaining data from such sites is hard because most of the shared content is private. In contrast, all the data we gathered from Flickr and YouTube is publicly accessible. Furthermore, these two sites provide mechanisms for searching and featuring popular content. Hence, our analysis of contentconsumption patterns is likely to over-estimate the popularity that content would have reached
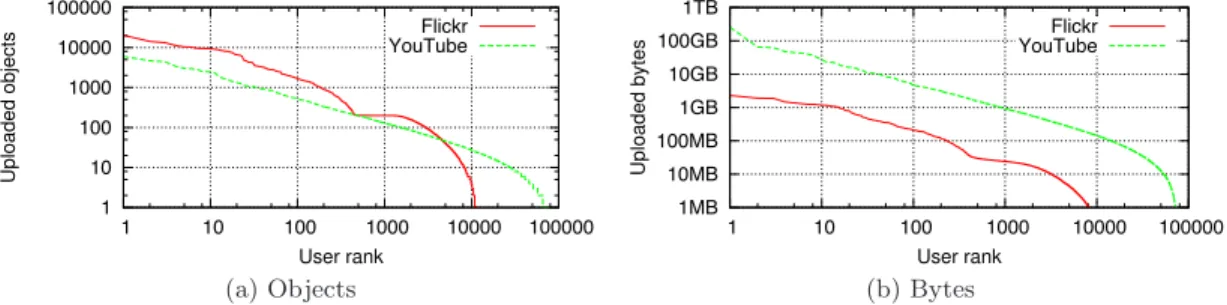
1 10 100 1000 10000 100000 1 10 100 1000 10000 100000 Uploaded objects User rank Flickr YouTube (a) Objects 1TB 100GB 10GB 1GB 100MB 10MB 1MB 1 10 100 1000 10000 100000 Uploaded bytes User rank Flickr YouTube (b) Bytes
Figure 1: Content production patterns: (a) users ranked by number of uploaded objects and (b) by the total size of uploaded content. 1 10 100 1000 10000 100000 1e+06 1 10 100 1000 10000 100000 1e+06
Weekly views received
Object rank Flickr YouTube (a) Objects 10TB 1TB 100GB 10GB 1GB 100MB 10MB 1MB 1 10 100 1000 10000 100000
Bytes served weekly
User rank
Flickr YouTube
(b) Users
Figure 2: Content consumption patterns: (a) objects ranked by the number of weekly requests and (b) the total amount of content served by Flickr and YouTube on behalf of content uploaders.
had it been shared on an OSN site like Facebook. On the other hand, the contentproduction patterns are likely to be similar to the ones in Facebook.
2.2 Content production patterns
In order to understand the storage requirements for sharing OSN content from home, we study the content production patterns of Flickr and YouTube users. We examine the total amount of content shared by each user in our dataset since they joined Flickr and YouTube. The average user in our dataset has been in the system for over 4 years.
Figure 1(a) shows the rank of each user against the total number of objects (photos and videos) they shared, in a log-log plot. Flickr shows a plateau at 200 pictures, as a conse-quence of the limit imposed on the number of photos visible in a free account. The content production rate is generally low; users uploaded on average 111 photos (median=29) and 16 videos (median=6). Only 10 Flickr users (accounting for 0.08% of all users) uploaded more than 10,000 pictures. Likewise, only 40 YouTube users (0.05%) uploaded more than 1,000 videos.
Figure 1(b) shows the same trend as a function of the total size of uploaded content. Because we are interested in the storage requirements for active users, we only show users who uploaded more than 1MB. While a small fraction of users uploaded more than 100GB of videos, the remaining users’ uploads remain small in size. Users on average up-loaded 13.3MB to Flickr and 103MB to YouTube. Even the most prolific user on Flickr uploaded less than 3GB. This amount of data can easily fit into a small storage device, e.g., a USB-stick attached to a home gateway. Our analy-sis indicates that while the total amount of content that is shared by all users on an OSN is massive,individual users only share a limited amount of contentand this content can fit on affordable storage devices.
2.3 Content consumption patterns
Next, in order to understand how frequently requests arrive for OSN content, we study content consumption patterns. We examine the number of requests each shared object and each uploader receive in a typical week. Due to space lim-itation, we present the request patterns based on the last week of our data. However, we did not observe significant changes when we examined other randomly chosen weeks.
Figure 2(a) shows the number of requests each shared ob-ject in Flickr and YouTube received during the one week period. YouTube videos in general receive more requests than Flickr photos. Many factors may contribute to this disparity such as the different popularity of the two sites— according toalexa.com, 22% of global Internet users visit YouTube, while only 2.5% visit Flickr.
With respect to the popularity of OSN content, we make two observations from Figure 2(a). First, not all 1,324,080 Flickr photos and 1,251,492 YouTube videos were requested during a week period. Rather,a substantial fraction of ob-jects did not receive a single request during an entire week. More precisely, 97% of Flickr photos and 44% of YouTube videos were never requested during the one week period. These results suggest that the number of objects that need to be made readily available to web servers and CDNs can, at least potentially, be drastically reduced.
The second observation is that even the content that was requested received only a few requests during the one week period. Almost all Flickr photos received less than 1,000 re-quests. YouTube contained about 1,000 very popular videos, which were viewed over 10,000 times. However, the remain-ing videos (99% of all videos, or 88% of all videos with at least one request) each received no more than one thou-sand requests. The fact that many objects are unpopular is promising for the feasibility of a decentralized architecture, because it reduces the resource demand on home networks. Finally, in order to see how popular objects are distributed
across users, in Figure 2(b), we show the total amount of bytes that Flickr and YouTube served on behalf of the up-loaders. This number is important because it represents how much data users would need to serve from their homes. More than 75% of YouTube users need to serve 1GB/week or less. This corresponds to an average bandwidth of 13Kbps, and is thus a demand that home connections can potentially meet. The bandwidth demands for Flickr photos are roughly two orders of magnitude smaller.
3.
HOME NETWORK ENVIRONMENTS
Compared to well-provisioned and maintained centralized infrastructures like data centers and CDNs, most home net-work environments are resource-constrained and are man-aged by lay users. This raises a concern about the reliability of sharing content from home. In this section, we character-ize the reliability of home network environments based on real measurements.
3.1 Methodology
For this work, we custom built home servers using NetGear wireless routers and deployed them in a number of house-holds.
3.1.1 Customizing home gateways as servers
We turned the NetGear WGT634U home router into a home server. This router is equipped with a 200 MHz MIPS CPUs.2
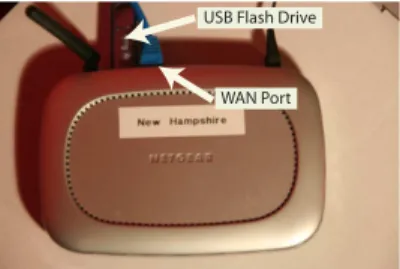
We attached a 2GB USB-based external flash drive for storing content, as shown in Figure 3, then installed OpenWrt, an open source Linux distribution for embedded devices, and ran a lightweight HTTP server to serve content stored on the drive.3
USB Flash Drive
WAN Port
Figure 3: Wireless router equipped with USB storage used in testbed.
Our home servers are inexpensive and require only a lim-ited amount of power. The cost of a home router comparable to the one we used is around $60. The cost of a 2GB flash drive today is $9. If additional storage is needed, it is pos-sible to attach external USB hard disks that provide several hundred gigabytes or even terabytes of storage space. The wireless router is powered by an adapter whose maximum power output is 12 watts. Even assuming constant maxi-mum power consumption, the router would consume about 100KWh over an entire year, which translates into a yearly cost of $18 (using electricity retail prices in the New York area in February 2010 [7]). Hence, we claim that an always-on home server is an affordable solutialways-on for most users. 2
Specification of the NetGear WGT634U router http:// tinyurl.com/33vpnun
3
http://www.openwrt.org,http://www.lighttpd.net/
3.1.2 Deployed testbed
We deployed our home gateways in 10 households in 2 dif-ferent continents: Europe (Germany, Spain, and Italy) and Asia (Korea). The gateways are connected to 9 different Internet Service Providers (ISPs).
The data from these gateways was collected over 79 con-secutive days from April 1st to June 18th, 2010.
We instrumented the router to run a measurement dae-mon which performed the following three tasks: (1) sending minute-by-minute heartbeat messages to a remote tracking server, in order to infer the availability of gateways; (2) mon-itoring all traffic sent through the gateway, in order to mea-sure utilization of the residential Internet links and detect the presence of any local devices accessing the Internet; and (3) periodically fetching media files (pictures and videos) from randomly selected routers in the testbed as well as from Facebook, in order to compare the performance of a decentralized architecture with that of Facebook. The me-dia files exchanged and the logs of all the results were stored on the USB storage devices. In order to prevent our mea-surements from interfering with users’ Internet traffic (such as Web or Skype), our gateways upload the media files at strictly lower priority than the traffic generated by locally connected devices.
While the number of deployed gateways in our testbed may seem small, especially when compared to prior studies of residential networks [6], no prior study has ever gath-ered such detailed performance measurements about home network environments over several months. Such data is necessary to evaluate the content delivery capacity of home networks. Moreover, we observed that network usage across the households in our deployment is quite varied and ranges from scarcely used network connections to very active sub-scribers.
Average connected time 98%
Median unavailability period 11 minutes
Unavailability period (90th percentile) 12 hours
Longest unavailability period 3.6 days
Average # of disconnections per day 0.1
Average # of IP changes per day 0.4
Table 1: Statistics about the availability of gateways in our testbed.
3.2 Availability of home gateways
We used data from the heartbeat messages to infer the avail-ability of gateways. We consider a router to beunavailable
if the tracking server misses five consecutive heartbeat mes-sages from the router, i.e., does not hear a heartbeat over a period of five minutes. By waiting for five consecutive message losses, we reduce the chance of misinterpreting oc-casional packet losses as router unavailability.
Table 1 reports the availability of home gateways. Overall, the availability of gateways is generally high—around 98%. Unavailability periods are typically short; the median availability period is just 11 minutes. Occasionally, the un-availability periods lasted from several hours to a few days. Anecdotal evidence suggests that this happened when users turned offthe power and left their home for a long time. The longest unavailability period lasted 3.6 days. However, in 90% of cases, the unavailability lasted less than 12 hours. Another potential cause of unavailability are ISPs period-ically resetting the home Internet connection to reassign the IP address of home gateways. However, Table 1 shows that
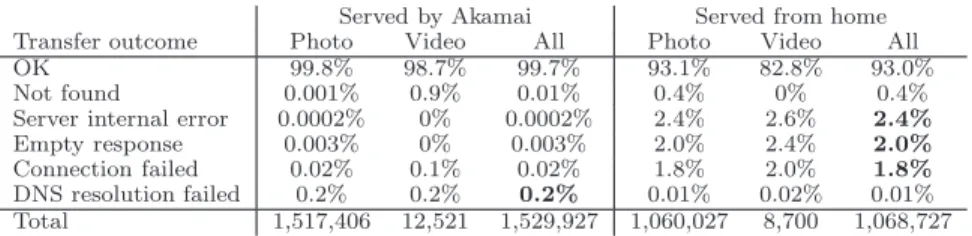
Served by Akamai Served from home
Transfer outcome Photo Video All Photo Video All
OK 99.8% 98.7% 99.7% 93.1% 82.8% 93.0%
Not found 0.001% 0.9% 0.01% 0.4% 0% 0.4%
Server internal error 0.0002% 0% 0.0002% 2.4% 2.6% 2.4%
Empty response 0.003% 0% 0.003% 2.0% 2.4% 2.0%
Connection failed 0.02% 0.1% 0.02% 1.8% 2.0% 1.8%
DNS resolution failed 0.2% 0.2% 0.2% 0.01% 0.02% 0.01%
Total 1,517,406 12,521 1,529,927 1,060,027 8,700 1,068,727
Table 2: Summary of the outcome of content downloads: Akamai’s failed transfers are dominated by DNS resolution errors, whereas failures in the testbed are dominated by a single faulty gateway and failed connection attempts due to disconnected gateways.
IP changes were infrequent. In fact, this happened for only 1 of the 9 ISPs we monitored. Also, when the connection was reset, the loss of connectivity lasted significantly less than five minutes and was thus never registered as an un-availability period. Overall, these results demonstrate that it is possible to achieve high reliability from home gateways.
Photo download time (sec)
Percentile Akamai From home
10th 0.11 0.58
50th 0.36 1.91
80th 0.81 2.91
95th 1.38 5.32
99th 4.69 10.33
Table 3: Time required to download a photo.
3.2.1 Availability of home devices
How would the availability be affected if, instead of home gateways, we used laptops and desktop computers as servers? To understand the availability of these home de-vices, we measured how long home devices are connected to the gateways. On average 3.1 different local devices were connected to each gateway at some time. While most home networks had multiple devices, 73% of the time there was no device connected to the gateway. In fact, even the most available local device (i.e., the device that remained nected to the gateway the largest fraction of time) was con-nected only 62% of time. The availability of home devices compares poorly with that of gateway servers (with aver-age availability of 98%). This suggests that serving content directly from home devices might not be a viable solution.
3.3 Utilization of home access links
Residential Internet access links are known to have limited capacities [6]. Furthermore, a home gateway server can only rely on access link bandwidth that is not being used by home devices. A crucial question therefore ishow often are access links of home networks utilized and to what extent?.
To answer this question, we analyzed the data collected from monitoring home network traffic. We computed the average utilization of all links over each 5-minute interval. We found that upstream links are not used more than 80% of the time, while the downstream links are not used more than 40% of the time. Furthermore, for 95% of the time, the link usage was below 230Kbps and 15Kbps for the downstream and upstream directions, respectively. We also looked at the hourly usage of individual upstream links and found that usage is very bursty and very low (below 50Kbps) when averaged over one-hour periods. Since all the access links had a downstream capacity of several Mbps and an upstream of several hundreds of Kbps, the results show that even when the access links were being used, they had plenty of spare capacity left for other traffic.
4. PERFORMANCE
OF
HOME-BASED
CONTENT SHARING
In order to assess the performance of sharing content from home gateways, we stored 20 JPEG pictures and 1 MPEG4 video file on the USB storage of each gateway and measured the performance of fetching each file from other gateways. For comparison purposes, we uploaded the same media files to Facebook. The size of the files were between 80KB and 130KB for pictures and 18MB for the video.
Every 10 minutes, each gateway requests the pictures from a randomly chosen gateway and from the Akamai URL4 used by Facebook to deliver the files. The same is done for the video file, although only once every hour. For each download, we recorded the completion times and any error and HTTP response codes.
On average, each home gateway in our experiments serves more than 4GB per week, which is more than the weekly data served today on behalf of 75% of YouTube users and 100% of Flickr users (see Section 2.3 and Figure 2 (b)). Therefore, our results here suggests that most social con-tent can be served using home gateways.
4.1 Successful content downloads
We discuss how often the media file downloads were suc-cessfully completed. Table 2 displays the statistics for the content downloads. Overall, the percentages of successful downloads using home servers and Akamai are comparable (93% using home servers and 99.7% using Akamai), although Akamai is clearly preferable if one needs a highly reliable service. Given that content sharing is not a mission-critical service, the slightly lower reliability offered by home servers might be acceptable for many users.
Table 2 also reports the major sources of errors that caused content downloads to fail. The major sources of er-ror for Akamai were failed DNS resolutions, where the client could not successfully resolve the Akamai URL. In the case of content served from the testbed, the major sources of errors were internal server errors and empty responses. Af-ter inspecting the logs, we found that a lot of these errors were generated by a single gateway with faulty USB storage. Excluding this outlier, the main source of error was failed connections to the server. This accounted for a small 1.8% of the cases, which well matches the 98% availability of the gateways presented above.
4.2 Performance of photo browsing
Next we look at the time taken to complete the photo down-loads. Table 3 displays the percentile of download times 4
Before every transfer, the gateway resolves the Akamai URL with a DNS query to obtain the current Akamai server’s IP.
in the experiments. Even when photos were served from home gateways, 80% of the downloads took less than 3 sec-onds, a performance likely to be acceptable for many users. Optimized versions of the system could prefetch photos in the same photo album to hide fetch latency from the user. Prefetching seems to be useful since users are likely to spend a few seconds viewing a photo before requesting the next one. Thus, the results suggest that users can obtain accept-able performance when sharing their photos with friends di-rectly from their homes.
4.3 Performance of video streaming
Unlike photos, which are typically looked at after be-ing downloaded, videos are often watched as on-demand streams. So when evaluating the performance of video shar-ing, we looked at download bandwidths rather than down-load completion times.
Figure 4 reports the average bandwidths achieved during the media streaming experiments. The testbed cannot com-pete with the performance of the Akamai servers. However, 95% of transfers achieve an average bandwidth higher than 200Kbps (which correspond to low-bit rate streams), while 66% of transfers achieve an average bandwidth higher than 400Kbps—an encoding rate that is higher than a majority of YouTube videos [10]. The transfer bandwidths are by and large limited by the upstream capacities of home Internet connections. 0 0.2 0.4 0.6 0.8 1 100 1000 10000 100000 CDF of downloads Average bandwidth (Kbps) Akamai From home
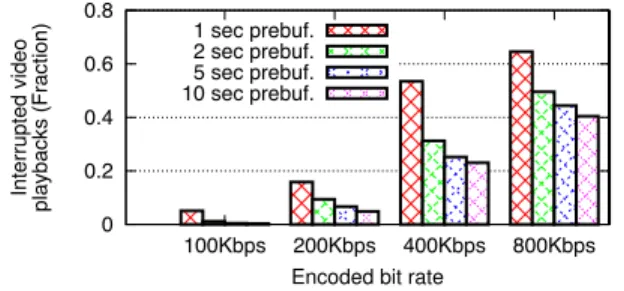
Figure 4: Bandwidth achieved by video downloads. High average bandwidth alone does not guarantee that video streaming was uninterrupted. To understand whether a user would be able to watch a video streamed from home servers without interruption, we recorded the bandwidth achieved in every 1-second interval of streaming downloads and used the data to compute how many playbacks with a certain encoding rate would complete uninterrupted. In the computation, we assumed that all videos have a duration of 140 seconds. We also considered different pre-buffering times (i.e., the time between the begin of the video down-load and when the first frame is shown to the user).
Figure 5 shows the fraction of uninterrupted media play-backs for gateways whose upstream capacity is at least as high as the streaming bit rate. For low bit rates (100-200Kbps), two seconds of pre-buffering are sufficient for most playbacks to end without interruptions. These bit rates are more than enough for high-quality MP3 audio files, thus showing that music can be effectively streamed from home. For YouTube-like bit-rates (400Kbps), a consistent amount of pre-buffering is needed to lower the fraction of uninterrupted playbacks. For example, if the content is pre-buffered for 5 seconds (equal to 3% of the video duration), almost 80% of playbacks succeed. At higher bit-rates, no reasonable amount of pre-buffering can reduce the fraction of interrupted playbacks. 0 0.2 0.4 0.6 0.8 800Kbps 400Kbps 200Kbps 100Kbps Interrupted video playbacks (Fraction)
Encoded bit rate 1 sec prebuf.
2 sec prebuf. 5 sec prebuf. 10 sec prebuf.
Figure 5: Fraction of interrupted playbacks across vary-ing pre-buffering times and encoding rates.
5. CONCLUSIONS
Sharing personal and social content with friends has be-come an extremely popular activity for many OSN users. However, current OSN content delivery architectures require users to give up control over the data they share on OSNs. In this paper, we examine the feasibility of sharing social con-tent directly from user homes. By sharing data from home networks, which they own and control, users can regain con-trol over their data. Our analysis using measurements of OSN workloads and home network environments suggests that it would be possible to deliver most social content from users’ home networks.
6. REFERENCES
[1] F. Benevenuto, T. Rodrigues, M. Cha, and V. Almeida. Characterizing user behavior in online social networks. In
ACM IMC, 2009.
[2] S. Buchegger, D. Schi¨oberg, L. H. Vu, and A. Datta. PeerSoN: P2P social networking - early experiences and insights. InACM Social Network System Workshop, 2009. [3] M. Cha, H. Kwak, P. Rodriguez, Y.-Y. Ahn, and S. Moon.
I tube, you tube, everybody tubes: Analyzing the world’s largest user generated content video system. InACM IMC, 2007.
[4] M. Cha, A. Mislove, and K. P. Gummadi. A
measurement-driven analysis of information propagation in the flickr social network. InWWW, 2009.
[5] Diaspora OSN.http://www.joindiaspora.com. [6] M. Dischinger, A. Haeberlen, K. P. Gummadi, and
S. Saroiu. Characterizing residential broadband networks. InACM IMC, 2007.
[7] Average retail price of electricity, U.S. Energy Information Administration, 2010.http://tinyurl.com/525u28. [8] Facebook engineering. needle in a haystack: Efficient
storage of billions of photos, 2009.
http://tinyurl.com/cju2og.
[9] Nick Bilton, Price of Facebook privacy? start clicking. NYTimes, 2010.http://tinyurl.com/39nyzfb.
[10] P. Gill, M. Arlitt, Z. Li, and A. Mahanti. Youtube traffic characterization: A view from the edge. InACM IMC, 2007.
[11] M. M. Lucas and N. Borisov. Flybynight: mitigating the privacy risks of social networking. InACM Workshop on Privacy in the Electronic Society (WPES), 2008. [12] Nielsen Online Report. Social networks & blogs now 4th
most popular online activity, 2009.
http://tinyurl.com/cfzjlt.
[13] A. Shakimov, A. Varshavsky, L. P. Cox, and R. C´aceres. Privacy, cost, and availability tradeoffs in decentralized
OSNs. InACM SIGCOMM WOSN, 2009.
[14] J. Sun, X. Zhu, and Y. Fang. A privacy-preserving scheme for online social networks with efficient revocation. InIEEE INFOCOM, 2010.