CONTROL
OF THE
INTERACTION
BETWEEN AN
OBLIQUE SHOCK WAVE
AND A
SUPERSONIC
TURBULENT BOUNDARY LAYER
BY
LOCALIZED ARC
FILAMENT PLASMA ACTUATORS
A THESIS
Presented in Partial Fulfillment of the Requirements for Graduation with Distinction in the
Department of Mechanical Engineering at The Ohio State University
By Nathan J. Webb
*******
The Ohio State University April 2009
i
ABSTRACT
The ability of localized arc filament plasma actuators to eliminate or reduce the extent of boundary layer separation in the interaction between an oblique shock wave and a turbulent boundary layer is examined. This is an important phenomenon occurring in many applications including supersonic aircraft engine inlets. The effects of the actuators on the flow were studied for varying frequency, location, and mode of actuation of the actuators. The effectiveness of the forcing was determined by using schlieren imaging techniques, particle image velocimetry, and unsteady pressure measurements. The data collected shows that the actuators do have significant effects on the flow and can effectively remove the separation caused by the shock wave/boundary layer interaction.
ii
ACKNOWLEDGEMENTS
Professor Mo Samimy has been a great help to me. In addition to having his support he was generous with his time and was always willing to sit down and discuss something, whether scientific or logistical. I want to thank him, and attribute my success partially to his help. I would also like to thank Edgar Caraballo who was my main source of information about the equipment and facility, and helped me learn how to conduct a research project. Jesse Little, Martin Kearney, Aniruddha Sinha, and Jin-Hwa Kim also provided information and discussion at times, for which I am grateful.
iii TABLE OF CONTENTS ABSTRACT ... i ACKNOWLEDGEMENTS ... ii LIST OF FIGURES ... iv CHAPTER 1: Introduction ... 1
CHAPTER 2: Background Information ... 4
2.1 Introduction ... 4
2.2 SWBLI Physics ... 4
2.3 SWBLI Control Methods ... 4
2.4 Experimental Methods ... 7
2.5 Data Acquisition Systems ... 8
CHAPTER 3: Experimental Facility and Method ... 10
3.1 Experimental Facility ... 10
3.2 Localized Arc Filament Plasma Actuators ... 15
3.3 Facility Characterization ... 17
CHAPTER 4: Results ... 20
4.1 Introduction ... 20
4.2 Baseline Results ... 20
4.3 SWBLI Control: Best Case ... 23
4.4 SWBLI Control: Location Dependence ... 27
4.5 SWBLI Control: Mode Dependence ... 29
4.6 Results Validation ... 31
CHAPTER 5: Summary and Future Work ... 34
iv
LIST OF FIGURES
Figure 2.1: SWBLI Sketch (Adamson and Messiter, 1980) ... 5
Figure 3.1: Photograph of Test Section of Supersonic Wind Tunnel Facility ... 11
Figure 3.2: Schematic of Floor of the Test Section ... 12
Figure 3.3: Schematic of Schlieren Imaging Setup ... 13
Figure 3.4: Schematic of PIV Experimental Setup ... 14
Figure 3.5: Photograph of LAFPAs in Operation ... 16
Figure 3.6: Schlieren Image of the Test Section ... 17
Figure 3.7: Schlieren Image with Baseline Measurement Planes Superimposed ... 19
Figure 4.1: Streamwise Velocity Component Maps for the Baseline Case ... 22
Figure 4.2: LAFPA Streamwise Locations ... 23
Figure 4.3: PIV Data for Measurement Plane X* = -0.29 and Actuators at Xa* = -1.25 ... 25
Figure 4.4: PIV Data for Measurement Plane X* = 0.38 and Actuators at Xa* = -1.25 ... 27
Figure 4.5: PIV Data for Measurement Plane X* = -0.29 and Actuators at Xa* = -0.83 ... 28
Figure 4.6: PIV Data for Measurement Plane X* = -0.29 and Actuators at Xa* = -1.25 for the Actuators Operated Out of Phase ... 30
Figure 4.7: Examples of Unmasked and Masked Images ... 32
1
CHAPTER 1: Introduction
Since the advent of the supersonic aircraft engine, the understanding of shock wave/boundary layer interactions (SWBLIs) has been of interest to engineers due to their importance within supersonic mixed compression inlets, and transonic and supersonic wings (Dolling, 2001). Their importance lies in the ability of the shock wave to separate the boundary layer within the inlet or on the wing, causing a substantial loss of flowrate in one case and loss of lift in the other. Furthermore passing through the shock can distort the turbulent boundary layer far enough to cause fluctuating loads that can damage the supersonic engine fan/compressor. In the case of the mixed compression inlet, the separation also has the potential to destabilize the terminal normal shock wave, causing it to move out of the inlet resulting in engine unstart. Engine unstart can violently throw the pilot forward, in a manner similar to a head-on collision, which could result in injury or fatality due to impact with the control panel. Such large transient forces could also cause damage to the aircraft itself.
The conventional method for preventing separation is boundary layer bleed. This involves the low momentum portion of the boundary layer being “bled” off through scoops and holes in the surface of the inlet or wing (Syberg and Koncsek, 1973). The SWBLI is not strong enough to separate flow moving at free stream velocity; therefore by removing the retarded fluid in the boundary layer, the separation can be eliminated. The drawback to this solution is that it causes thrust and drag penalties due to the loss of mass flow inherent in the method.
Recently attempts have been made to control the SWBLI using more efficient means. Many experiments are assessing the value of passive separation control such as
2
geometric modifications to the inlet. Two examples of such control methods are placing bumps (Ogawa and Babinsky, 2008) or microramps (Anderson et al., 2006) on the boundary layer surface. The goal of the first study is to modify the shock structure itself by creating a lambda shock foot, thereby increasing the total pressure recovery of the inlet. The goal of the second study is to energize the boundary layer by generating streamwise vorticity. The generation of streamwise vorticity mitigates the possibility of separation by promoting mixing between the free stream and the boundary layer thereby keeping the momentum of the boundary layer high. More efficient active control methods have also been investigated. The use of plasma actuators to ionize the fluid in conjunction with an external magnetic field to accelerate it has been experimented with (Leonov et al., 2006; Kalra et al., 2008).
The Gas Dynamic and Turbulence Laboratory (GDTL) at The Ohio State University has been appropriated funds by the Air Force Research Laboratory for an investigation into the control of a SWBLI using localized arc filament plasma actuators (LAFPAs). These actuators had previously been developed at the GDTL (Utkin et al., 2007), and have been used to control the exhaust of a jet for noise mitigation and enhanced mixing (Samimy et al., 2007a; Samimy et al., 2007b).
The LAFPAs successfully controlled the jet exhaust by manipulating various natural instabilities within the flow. It is thought that the actuators may be able to prevent separation similarly by forcing natural instabilities (Caraballo et al., 2009). It has also been computationally demonstrated that the actuators generate streamwise vorticity, much like the microramps used by Anderson (Yan and Gaitonde, 2009). No experimental
3
evidence has confirmed this; however, if accurate, the actuators may also be able to prevent separation via the mechanism of streamwise vorticity.
This research project has undertaken to determine the control authority of the LAFPAs over a SWBLI. It is designed to be a preliminary study, merely to demonstrate that the actuators can, or cannot remove or reduce separation. If it is found that they are able to control the SWBLI to reduce or prevent separation, then further study will investigate the control mechanism, and allow the actuators to be optimized for specific operating conditions.
4
CHAPTER 2: Background Information 2.1 Introduction
In the study of SWBLI control it is essential to understand the physics of the interaction, as well as understand the goals of different types of control and the mechanism by which they affect the flow. The experimental methods used and methods of data collection must also be understood. A brief background in each of these areas is given here.
2.2 SWBLI Physics
The interaction between an oblique shock wave and a turbulent boundary layer is a complex phenomenon with many unsteady aspects. Due to their complexity, SWBLIs have been studied for over 50 years and are still not completely understood (e.g. Dolling, 2001). However the negative consequences associated with SWBLIs in supersonic mixed compression inlets and their causes are currently reasonably well understood. A diagram of a typical SWBLI in a supersonic mixed compression inlet is shown in Figure 2.1 below.
5
Figure 2.1: SWBLI Sketch (Adamson and Messiter, 1980)
As flow approaches the oblique shock wave it is moving at supersonic speeds. As it passes through the shock wave the flow is slowed down and the static pressure increases. This adverse pressure gradient across the shock wave further reduces the momentum of the already retarded fluid within the boundary layer. If the interaction becomes strong enough the boundary layer fluid can separate and begin flowing in the reverse direction. If separation occurs the boundary layer increases in height at the point of separation, forming a “separation bubble”. This bubble reduces cross-sectional area of the inlet, which in turn reduces the mass flowrate, resulting in a performance penalty for the jet engine. In addition the separation can destabilize the terminal normal shock, resulting in rotating stall, engine unstart, and cause large unsteady pressure loads on the engine fan or compressor, possibly causing damage to them.
2.3 SWBLI Control Methods
The conventional method of controlling the SWBLI is boundary layer bleed. Boundary layer bleed is the removal of the low momentum flow, by use of scoops and holes, from the inlet. By removing the slow moving flow from the inlet, boundary layer
6
bleed ensures that the flow passing through the SWBLI has enough momentum to prevent the adverse pressure gradient from separating the boundary layer. This solution does prevent separation; however it also reduces the flow in the inlet. The reduction in mass flow reaching the engine incurs a performance penalty because a larger inlet must be designed in order to supply the engine with the proper amount of air. The larger inlet causes increased drag which reduces the overall efficiency of the aircraft.
The performance reduction incurred by boundary layer bleed has made the development of alternative solutions attractive to researchers. Recently passive control methods such as bumps (Ogawa and Babinsky, 2008), and micro ramps (Anderson et al., 2006) have been investigated. These methods, especially the micro ramps, have proven to be successful in removing separation at the design operating point. This is accomplished by the generation of streamwise vorticity, which promotes mixing between the free stream and the boundary layer, thereby increasing the boundary layer momentum. While geometric actuators can prove effective at design conditions, because the geometry of the actuators cannot be modified, they could create negative effects under off-design conditions.
The LAFPAs present a new active control technique for separation prevention. These plasma actuators have several advantages over passive control methods such as bumps and ramps. The most notable of these is the fact that the actuators can be operated in many different manners, and even turned off entirely. This property makes the actuators flexible for off-design operating conditions. Another advantage of the plasma actuators over passive control methods is that they are operated in an unsteady manner. Thus it is possible for the actuators to take advantage of natural instabilities in the flow to
7
enhance their effectiveness. However as with all active control methods, the actuators require additional power to operate. These actuators do not require much power, about 30 W per actuator at a 30% duty cycle (Utkin et al., 2007). The purpose of this study is to determine the control authority of the LAFPAs on a SWBLI.
2.4 Experimental Methods
Analysis of the baseline flow and the effects of the actuators on it were investigated using two different flow visualization methods. Schlieren imaging was used to gain qualitative insight into the flow field and also to check the quality of the baseline flow and ensure that no extraneous shock waves were present. The concept behind schlieren imaging is to remove part of the light that is entering the camera under the assumption that slight deflections of the light by the fluid structures within the test section will cause sections of the image to show up lighter and darker than the surrounding image. Thus in order to capture these images a flash of light is directed through the test section. It is then focused by lenses before entering a camera. At the focal point of the lenses an opaque knife-edge is brought into contact with the beam of light. This allows the structures in the flow to remove light from the image by deflecting it just enough that it is prevented from entering the camera by the knife-edge.
The other flow visualization technique that was used to examine the flow is stereo particle image velocimetry (PIV). PIV gives quantitative velocity data for a plane within the flow field. The theory behind PIV is to seed the flow with particles that have a small response time. Therefore the particles will be carried along with the flow, mimicking its behavior. A sheet of laser light is then placed in the test section in the plane where velocity data is desired. In stereo PIV the measurement plane is then photographed from
8
two different angles. Two pictures are taken with a brief time separation (on the order of 1 µs). These pictures are then processed by a computer program that tracks the movement of the particles between the two frames. By using the displacement undergone by the particles and the known time separation between frames a field of velocity vectors is generated. The fact that two pictures were taken from different angles in stereo PIV allows the computer to calculate three components of the velocity. The velocity fields that are generated by this approach will be used to quantitatively assess the effects of the actuators on the flow.
In addition to flow visualization, unsteady pressure measurements were taken. These were intended to be used to determine if the velocity of the boundary layer behind the SWBLI was significantly changed by the plasma actuators; however due to the size of the tunnel these measurements proved to be ineffective. The vertical dimension of the test section was so small that there were many reflected shock/expansion waves downstream of the SWBLI. These waves removed all measurable traces of any effects the LAFPA may have had on the boundary layer passing through the primary SWBLI. For this reason these measurements provided no useful insight into the actuators control authority.
2.5 Data Acquisition Systems
In order to effectively make use of schlieren imaging, stereo PIV, and unsteady pressure measurements, proper data acquisition systems are necessary. Programs written in LabView by previous members of the GDTL were used to collect the data from the schlieren and unsteady pressure measurement systems. These systems were relatively simple, because all that was required was to collect the data.
9
Performing stereo PIV is more complicated than either schlieren imaging or unsteady pressure measurements. Not only must the software identify and track the particles and calibrate the system to get actual velocities, not just pixel scale velocities, but it also must precisely coordinate the cameras, laser, and computer in order to obtain well-lit, high quality images. For this reason, commercial software: DaVis 7.1 was used to record and process the PIV images.
10
CHAPTER 3: Experimental Facility and Method 3.1 Experimental Facility
The facility in which these tests were conducted is a blow down type wind tunnel with a 38.1 mm by 76.2 mm test section. The tunnel is operated using compressed air that had been filtered and dried. After leaving the stagnation chamber the air passes through several turbulence reducing screens before entering the nozzle. The air then flows through the test section before exhausting to the ambient through a converging-diverging diffuser. The tunnel can be run at any speed by appropriate choice of the nozzle block. The current setup has a nominally Mach 2 nozzle, designed using the Method of Characteristics, which was measured to yield an actual Mach number of 1.89 due to the fact that the nozzle was designed without accounting for the unknown boundary layer heights. The tunnel has optical access through the sidewalls via windows, and optionally through the tunnel roof. The windows are made from optical grade fused silica. It is also optional to replace the windows with aluminum inserts which are equipped with a series of static pressure taps, from which the pressure can be read. On the ceiling of the tunnel is a 10° wedge which functions as a shock wave generator. A picture of the test section is shown in Figure 3.1.
11
Figure 3.1: Photograph of Test Section of Supersonic Wind Tunnel Facility
The floor of the tunnel is made up of three pieces. This is to allow the LAFPA to be located at different streamwise locations relative to the SWBLI. The actuators can be placed in 3 locations relative to the SWBLI: just upstream of the front leg of the lambda shock, just downstream of the front leg of the lambda shock, and within the interaction bubble. Two of the floor pieces are made of nylon due to ease of machining and its relatively low cost. The third floor piece, that which houses the actuators, is made of boron nitride. Boron nitride was chosen because it is an excellent electrical insulator and, as a ceramic, it has the ability to withstand the high temperatures generated by the arc filament. A diagram of the floor from above can be seen in Figure 3.2.
12
Figure 3.2: Schematic of Floor of the Test Section
The furthest downstream section of the floor also houses eight large Kulite pressure transducers (model XTL-140-25A) and one smaller Kulite pressure transducer (model XCQ-080-25A). The large transducers have a frequency response of up to 50 kHz. These Kulites are arranged in such a way as to be downstream of different locations relative to the actuators. It can be observed in Figure 3.2 that the bottom 4 Kulites are aligned with the actuators along a streamwise axis, and the top four Kulites are in the gap between actuators. This was intended to give indications about the three-dimensionality of the flow. The small Kulite was placed within the bubble region in order to obtain pressure data that might indicate the magnitude of the possible recirculation.
Qualitative measurements were performed using schlieren imaging techniques. A diagram of the schlieren imaging setup can be seen in Figure 3.3. The light source used for this setup was a Palflash 501 High Intensity Illumination Flash. After leaving the source, the light was redirected through the test section via a convex spherical mirror.
13
The light was then redirected to a Nikon camera using another convex spherical mirror and a plane mirror. Given the focal length of the lens used on the camera it was critical, to achieve high quality images, for the distance from the camera to the convex spherical mirror to be the same as the distance from the light source to the other convex spherical mirror. It was also necessary for the test section to be centered between the two convex spherical mirrors.
Figure 3.3: Schematic of Schlieren Imaging Setup
Stereo PIV was the other flow visualization measurement technique used to investigate the control ability of the actuators. The PIV system was set up in such a way as to record velocities in a spanwise plane. Two LaVision ImagerPro CCD cameras fitted with Tamron 90 mm lenses were used, one on either side of the tunnel. The camera positions are shown in Figure 3.4 below.
14
Figure 3.4: Schematic of PIV Experimental Setup
The placement of the cameras allowed stereo PIV to be implemented resulting in the resolution of three velocity components. To reduce the interference of ambient light, and the bright arc filaments, band-pass optical filters that admit light with a wavelength of 532 nm were installed on the cameras. Each camera had a resolution of 2k pixels by 2k pixels. The light source for the PIV system was a Spectra Physics PIV 400 Nd:YAG laser with a wavelength of 532 nm. The laser light was directed to the facility through a series of mirrors. Before entering the test section the beam was passed through a cylindrical convex lens with a focal length of 15 mm and a spherical convex lens with a focal length of 100 mm. The light sheet that was created was then partially blocked by two pieces of paper in order to reduce reflections and extraneous laser light bouncing around. The light sheet was then redirected into the test section by means of a mirror. The flow was seeded in the stagnation chamber with olive oil particles. The seeder used to entrain particles within the flow was a TSI 6 Jet Atomizer.
The LaVision software DaVis 7.1 was used to process the PIV data collected. The processing is performed in three passes, using a 64 by 64 pixel correlation window with 50% window overlap for the first pass and a 32 by 32 pixel correlation window with 75%
15
window overlap for the second and third passes. The spatial resolution of the vector field produced is approximately 0.43 mm. The generated vectors are filtered for bad vectors using an allowable vector range, a correlation peak ratio criterion, and a median filter. After removing the spurious vectors the spaces in the vector field are filled in using a median filter and interpolation scheme, and the final vector field is smoothed by a 3 by 3 smoothing filter. To obtain more details on the processing techniques of the PIV data reference the DaVis 7.1 user manual.
3.2 Localized Arc Filament Plasma Actuators
The actuators used in this experiment were developed at the GDTL for controlling high-speed, high-Reynolds number jets. They affect this control by manipulating the natural instabilities within the jet exhaust flow. The actuators can be operated over a wide frequency space, from a few hundred Hz up to 200 kHz, as limited by the high voltage switches used to control them, in order to excite the natural instabilities in the flow. When the actuators are turned on a high voltage is applied across the two electrodes that make up the actuator. Once the voltage reaches a threshold value, the air between the electrodes is ionized and breakdown occurs, initiating an electric arc filament between the electrodes. When this occurs rapid localized gas heating takes place which generates thermal and pressure perturbations in the flow. The actuators are pulsed at a predetermined frequency, which causes the perturbations to fluctuate. These fluctuating perturbations are the mechanism by which the LAFPA control the flow.
16
Figure 3.5: Photograph of LAFPAs in Operation
In this experiment 8 LAFPAs, arranged in a spanwise line across the test section floor were used. A photograph of the actuators in operation within the facility is shown in Figure 3.5 above. Each glow is the arc filament of an actuator. The fainter glows are reflections from the window on the opposite side of the test section. Each actuator consists of two tungsten electrodes imbedded in the floor of the test section. The electrodes were recessed within a shallow groove (1 mm deep by 1 mm wide) within the floor. This groove prevents the plasma within the arc from being blown downstream by the high velocity flow, and allows the actuator to achieve a quasi-steady operating point. The actuators can be run with varying frequency, location, duty cycle, and actuation mode. Within the present study they were varied in frequency, location, and mode of actuation. For more information about the LAFPA refer to (Utkin et al., 2007). All of the cases presented here were run with the actuators operating at a 30% duty cycle, meaning they are "on" for 30%, and "off" for 70% of the period of the forcing frequency.
17
3.3 Facility Characterization
The facility was characterized using two different measurement techniques: schlieren imaging, and stereo particle image velocimetry (PIV). The PIV measurements served to give solid quantifiable data while the schlieren images were mainly used as a qualitative guide to allow better visualization of the PIV data.
Due to the high-speed nature of the flow in the interaction being studied, slight bumps or other disturbances on the inside surfaces of the test section would generate shock waves. These waves would modify the flow, rendering the investigation inaccurate. By examining the schlieren images any extraneous shock waves could be recognized, the responsible disturbance located, and removed. A typical instantaneous schlieren image of the facility in operation can be seen in Figure 3.6 below.
Figure 3.6: Schlieren Image of the Test Section
This image shows several important aspects of the flow. Firstly it can be seen that the flow entering the SWBLI region is relatively clean with no strong extraneous shock waves. The boundary layer on the bottom surface of the tunnel can also be seen. The ramp on the upper surface of the test section generates the shock wave, which subsequently impinges on the developing boundary layer. In the schlieren image the
18
shock appears to have a small thickness, which is an indication of slight unsteadiness. The shock wave reflects from the boundary layer exactly as expected, and at the interaction a bubble is formed. This bubble is small, and it could not be determined if separation had occurred.
In addition to yielding important information about the upstream and interaction flow regions, the schlieren shown in Figure 3.6 contains data about the downstream section. Due to the relatively small height of the test section the flow downstream of the SWBLI region contains many reflected shock and expansion waves. These waves significantly complicate the downstream flow, making it difficult to extract meaningful information about the interaction from the Kulite unsteady pressure transducers located in the downstream region.
Using the above described PIV system the baseline velocities of the tunnel were obtained for 8 different spanwise planes: X*= -2.95, -1.29, -0.95, -0.62, -0.29, 0.05, 0.38, and 0.71. X* is the distance measured from the theoretical inviscid impingement point of the primary shock wave on the tunnel floor, normalized by the interaction length: 15 mm. In Figure 3.7 the locations of these planes are superimposed on a schlieren image to aid in visualizing their locations relative to the SWBLI.
19
Figure 3.7: Schlieren Image with Baseline Measurement Planes Superimposed The measured velocity planes show an evolution of the flow that clearly matches the schlieren image. The close correlation between the schlieren and PIV data indicated that the flow was being accurately measured. In addition the PIV data showed that the flow simulated a SWBLI within a supersonic mixed compression inlet well. This allowed the actuators control authority in such an interaction to be accurately determined.
20
CHAPTER 4: Results 4.1 Introduction
As discussed above it was decided to use stereo PIV as the primary method of determining the control authority of the actuators. However to aid in visualization of the flow other data such as schlieren images will be presented here. In all PIV velocity maps the flow is coming out of the page towards the reader, and in all schlieren images the flow is from left to right. The velocity maps presented here are ensemble averages of 700 velocity vector fields. As was previously stated, the complications arising from the downstream shock and expansion wave reflections render the eight downstream Kulite pressure transducer data useless. Therefore none of the results are presented here. The small Kulite placed within the bubble promised to provide extremely useful data about the magnitude of the separation; however the bubble was too close to the actuators, and as soon as the LAFPAs were activated one of them arced to the Kulite, destroying it.
4.2 Baseline Results
The facility was characterized by using stereoscopic PIV to measure the flow velocity in 8 separate spanwise planes. For each plane 750 images were taken, which were then processed and the average of these velocity vector fields was imported into MATLAB. Working with the average velocity field, MATLAB was used to generate velocity component maps to examine the flow and ensure that accurate velocity measurements of the flow could be taken and that the facility working properly. In Figure 4.1 the u (streamwise) velocity component maps for the 8 planes for the baseline case can be seen.
21
a: X* = -2.95 b: X* = -1.29
c: X* = -0.95 d: X* = -0.62
e: X* = -0.29 f: X*
22
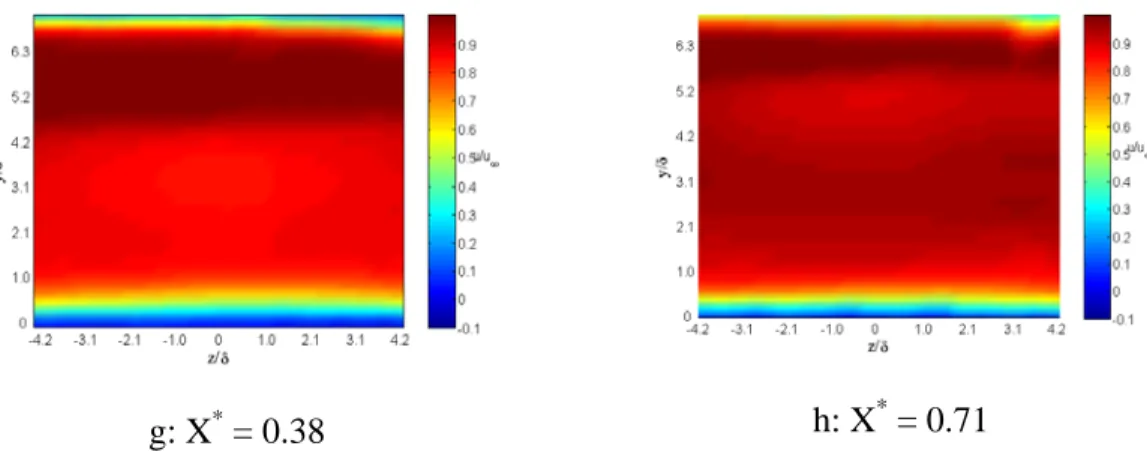
g: X* = 0.38 h: X* = 0.71
Figure 4.1: Streamwise Velocity Component Maps for the Baseline Case
From comparing these velocity measurements with the schlieren image in Figure 3.7, it can be reasonably inferred that the velocities that were measured by the stereo PIV are accurate. The shock wave appears to be in the correct location (see Figure 4.1 b. and c.) and the boundary layer has a height comparable to that seen in the schlieren image. After performing these qualitative checks as to the validity of the PIV baseline, a more quantitative, approach was used to further ascertain their validity. It was decided that an analysis of the boundary layer would provide more conclusive evidence that the PIV system was accurately reading the velocities in the test section. Therefore, MATLAB was used to calculate various boundary layer properties such as displacement thickness, momentum thickness and shape factor from the mean velocity maps. These properties were based on a boundary layer height of 4.8 mm, determined using a 98% of the free stream velocity criterion. The dimensionless shape factor was the compared with shape factors calculated by other researchers running experiments at around M = 2. The shape factor that was calculated for the X* = -2.95 plane was 1.55. (Syberg and Koncsek, 1973) said that “an Hi of about 1.3 corresponds to a ‘full’ velocity profile (similar to a
one-23
seventh power law profile), while an Hi between 1.8 to 2.0 indicates a highly distorted
profile close to separation.” Thus it was determined by the analysis that the PIV system was accurately functioning, and that boundary layer was relatively healthy, and constituted a good environment in which to test the actuators control authority.
4.3 SWBLI Control: Best Case
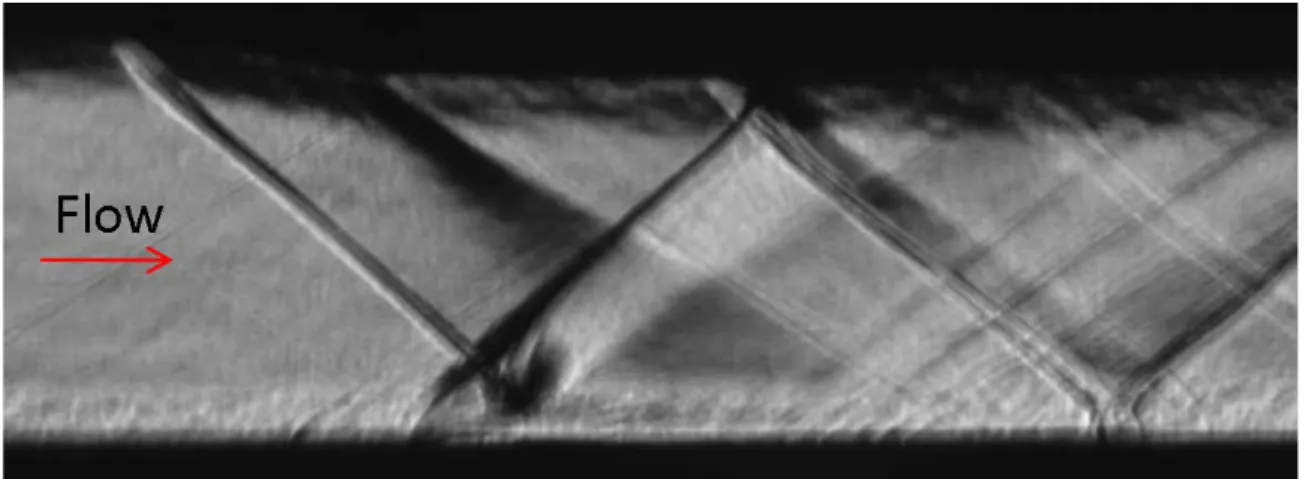
After characterizing the flow, the control authority of the actuators was investigated. As has been previously mentioned the actuators have a large parameter space consisting of frequency, location, duty cycle, and mode variation. A limited parametric sweep was conducted to determine a point at which the actuators had some effect. This parametric sweep consisted of testing the actuators at 3 locations, in 2 different modes, while operating at a wide range of frequencies. Figure 4.2 shows a schlieren image of the 3 streamwise locations at which the actuators were placed.
Flow
Xa*= -1.25 Xa*= -0.83 Xa*= -0.40Flow
Xa*= -1.25 Xa*= -0.83 Xa*= -0.4024
The location of the actuators, given by Xa*, is measured from the theoretical
inviscid primary shock impingement point and normalized by the interaction length, just as are the measurement planes, given by X*. The actuators were tested over a range of frequencies at these different positions. To determine the effectiveness of the actuators PIV data was collected from a streamwise plane at X* = -0.29 (see Figure 3.7). For each case the boundary layer was examined, to see if the actuators had energized it. The desired result of the forcing was, of course, to energize the boundary layer. This is because a high momentum boundary layer is not likely to become separated.
When the results were examined the actuators were found to have little or no effect when located at Xa* = -0.40. This can easily be explained by both of the postulated
control mechanisms. In order to prevent separation the actuators must energize the boundary layer before the primary shock impinges on it. Thus if the actuators are located downstream of the primary shock impingement point, they do not have an opportunity to energize the boundary layer before it is separated.
The actuators were found to have the best control authority when they were located upstream of the front leg of the primary/reflected shock structure, or the lambda shock structure, at Xa* = -1.25. This location allows the actuators to energize the
boundary layer before it encounters front leg of the lambda shock. The actuators were operated at several different forcing frequencies at this location to determine the parameter space location of the best control authority. For the purposes of this study, it was convenient to refer to the forcing frequency in terms of a non-dimensional forcing Strouhal number (StF). The forcing Strouhal number was defined as the forcing frequency
25
m/s). This definition was chosen to allow comparison between the values of StF, and the
Strouhal numbers investigated in (Dupont et al., 2008), when he conducted an examination of the frequencies associated with various portions of the lambda shock structure.
One of the postulated mechanisms is forcing natural instabilities. In order to do this the frequency of the instabilities must be closely matched by the forcing frequency. In his study, DuPont et al. (2008) found the front leg of the lambda shock structure to oscillate with a frequency of St = 0.03, and the rear leg and bubble to have a strong frequency component at St = 0.5. These numbers were used as a guide for the forcing frequency sweep conducted, to determine where the actuators had the maximum control authority. The sweep included testing at forcing frequencies of StF = 0.03, 0.06, 0.13,
0.26, and 0.5. The velocity maps for the baseline, and StF = 0.03, and 0.5 test cases are
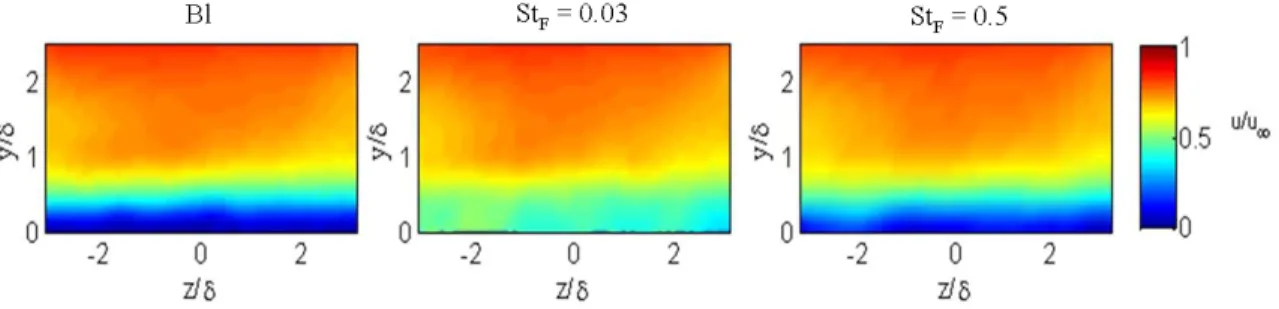
shown in Figure 4.3 below.
Figure 4.3: PIV Data for Measurement Plane X* = -0.29 and Actuators at Xa* = -1.25
These velocity maps clearly show the effects of the actuators on the boundary layer. The baseline has a low energy boundary layer that has been slowed and possibly separated by its interaction with the primary shock wave. In contrast to that of the baseline, the boundary layer in the StF = 0.03 case is high energy, with a minimum
26
recorded velocity of about 0.35 of the free stream velocity, as compared to 0.08 in the baseline case. This increase in velocity is significant, and will prevent the flow from being separated under normal design operation. The control authority of the actuators at this forcing frequency is contrasted by the lack of effect they have for the StF = 0.5 case.
By examining the velocity map for this case in Figure 4.3, it will be noted that the boundary layer is similar to the baseline. The actuators have had negligible effect on the flow, and the boundary layer is still relatively low energy and susceptible to separation.
When first examining the results of these forced cases it was thought that the actuators might be simply increasing the velocity of the boundary layer through gas heating. This is not desirable because to have a significant effect in that case there must be significant power input into the actuators. The LAFPAs are intended to control the flow, not modify it by extreme power input. If the actuators are operating by gas heating, then the efficiency of the engine will not be increased by the control they provide because of the power necessary to operate them. After analyzing all of the forced cases, however, it was determined that the actuators were not affecting the flow by gas heating. The difference in effect at varying frequencies indicated that instability forcing was taking place. In addition, as a constant duty cycle of 30% was preserved, there was equivalent time in both cases for heat transfer to take place; thus if gas heating is causing the boundary layer to be energized, the effect should be the same in both cases. The fact that it is not indicates that the actuators are not controlling the flow by gas heating.
In addition to taking velocity data for the case at the X* = -0.29 plane, PIV data was also collected at a plane downstream of the interaction: X* = 0.38. This data was
27
taken in order to observe the effects of the actuators downstream of the SWBLI. Velocity maps of this data are shown in Figure 4.4 below.
Figure 4.4: PIV Data for Measurement Plane X* = 0.38 and Actuators at Xa* = -1.25
These velocity maps show that the actuators have little effect on the flow at this downstream location. By looking at the schlieren image of the facility in Figure 3.7, and noting the position of the planes relative to the flow structures it will be observed that the expansion wave generated by the downstream end of the shock wave generator impinges on the boundary layer before the measurement plane. The small height of the test section leaves no room between the SWBLI and the expansion wave impingement in which to study the characteristics of the recovering boundary layer. The expansion wave removes the effects of the actuators so that they are not visible in the velocity maps. A larger tunnel would make it possible to examine the recovering boundary layer before it is modified by the expansion wave.
4.4 SWBLI Control: Location Dependence
The frequency dependence of the actuator's control authority gives some indication as to the nature of the mechanism by which the actuators exert control over the flow. The boundary layer was significantly energized when the actuators were operated at StF = 0.03. This corresponds to the frequency associated with the front leg of the lambda
28
shock structure (Dupont et al., 2008). In addition the flow was not affected for the StF =
0.5 case: the frequency associated with the rear leg of the lambda shock structure and the bubble. The lack of response at the frequency associated with the bubble was interesting and it was decided to investigate this in further detail. It has been noted in previous studies that a shock wave can act as a low pass filter (Dussauge et al., 2006). The frequency associated with the bubble is an order of magnitude larger than that associated with the shock, and therefore the actuator's effects at this relatively high frequency may be attenuated when passing through the front leg of the lambda shock. This made it of interest to determine the effects the actuators might have when placed within the SWBLI, downstream of the leading leg of the lambda shock. It was also deemed necessary to determine the effect of the streamwise position of the actuators relative to the SWBLI on their control authority. Thus the actuators were placed at Xa* = -0.83, and their effects
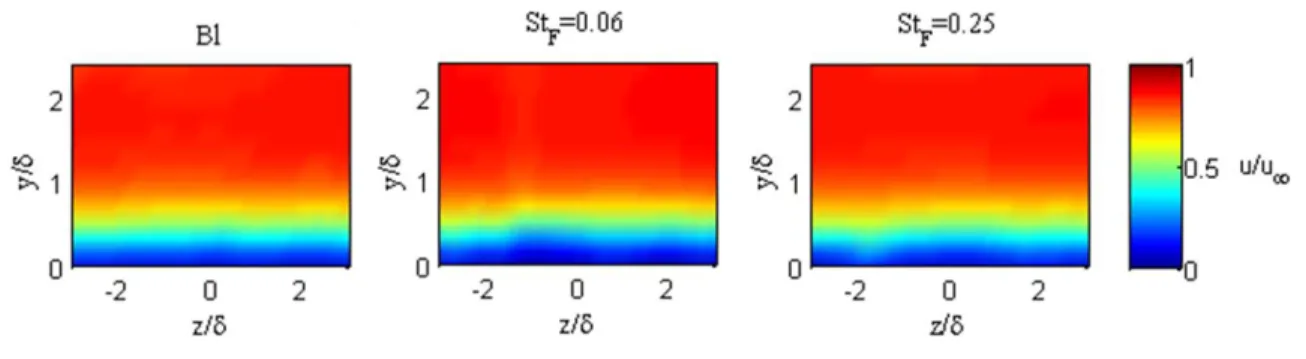
studied at similar frequencies. The velocity maps resulting from these tests are shown in Figure 4.5 below.
Figure 4.5: PIV Data for Measurement Plane X* = -0.29 and Actuators at Xa* = -0.83
The baseline case is the same as that for the upstream actuators; however there are differences between the forced cases. The correlation between the front leg of the lambda shock and the previous case forced at StF = 0.03 (Figure 4.3), can be seen when this case
29
is compared to the present case with the actuators at Xa* = -0.83. When the actuators are
upstream of the SWBLI, forcing at the frequency of the front leg of the lambda shock structure is highly effective, and produces excellent results. Once the actuators are moved downstream, however, the effects of forcing at this frequency are greatly reduced. This is intuitive, because although the boundary layer is not supersonic, and perturbations can therefore move upstream, the flow is still high speed. Therefore much greater effects would be expected if the actuators were upstream of the target of the control, namely the front leg of the lambda shock structure.
For the actuators in this location the best case was when the flow was forced at StF = 0.06. Figure 4.5 shows that although there are noticeable effects for this case, they
are not nearly as great as those produced by the actuators upstream of the interaction. The actuators do, however, slightly energize the boundary layer. The effect is probably not significant enough to prevent separation from occurring.
4.5 SWBLI Control: Mode Dependence
Instability forcing not only energizes the boundary layer, it can also help to weaken the shock wave by turning it into an unsteady phenomenon. As was previously mentioned, 8 actuators were used in a spanwise arrangement across the floor of the test section. All of these actuators can be operated independently of one another, however in the previously shown cases the actuators were all fired simultaneously. It was thought that if the actuators were fired at a phase relative to one another, i.e. not simultaneously, then they might, in addition to making the shock wave unsteady, cause the shock wave to become three dimensional in nature, further weakening it. To test this theory several test cases were run with the actuators operated 180° out of phase with each adjacent actuator.
30
Thus every other actuator would fire, and then, half a period later, the other actuators would fire. The results of these test cases are shown in Figure 4.6 below.
Figure 4.6: PIV Data for Measurement Plane X* = -0.29 and Actuators at Xa* = -1.25 for
the Actuators Operated Out of Phase
An examination of the velocity maps above shows that the actuators are not having a significant effect on the flow; in fact the actuators are having almost no effect at all. This seems strange considering that in the same location, and at the same frequency the actuators had great effect when operated in phase with one another. A possible explanation is that by not firing simultaneously the actuators weakened their own effect, and lost their control authority. If the actuators are affecting the flow by manipulating natural instabilities, then keeping the actuation amplitude large is key to the actuator's control authority. The actuators have also been computationally found to generate significant streamwise vorticity (Yan and Gaitonde, 2009). If this vorticity is part of the mechanism by which the actuators control the interaction and energize the boundary layer, then operating them out of phase with one another may reduce this effect. The actuators are placed in close proximity to one another with only 1.6 actuators widths between adjacent actuators. This arrangement would yield complicated vortical interactions if streamwise vorticity is being generated. By operating the actuators out of phase relative to one another these interactions are modified. This modification could
31
also be the cause of the significant degradation of the actuator's control authority when they are operated out of phase.
This study was not able to conclusively determine the reason that the actuators are ineffective when operated out of phase. This will need to be determined through more experimentation, and a better understanding of the mechanisms by which the actuators control the flow.
4.6 Results Validation
After analyzing the data and finding such promising results it was determined that a thorough double check for experimental error should be conducted to ensure that the obtained results were accurate. The main point on which surety was desired, was the accuracy of the stereo PIV data collected. By referring to Figure 3.4, it will be noted that the setup used to obtain the PIV data necessitates that the cameras be pointed at a cross-stream plane in the test section. Furthermore this cross-cross-stream plane is relatively close to the actuators. Although the cameras were fitted with band-pass optical filters, in order to reduce the noise in the images caused by ambient light and the LAFPAs, the actuators still generated some light noise that the cameras collected. This noise was naturally in the region near the floor of the test section as that is where the actuators are located. This noise would not be a problem for the analysis, as this region could simply be cropped out; however the boundary layer that is being investigated is that on the floor of the test section and thus the near floor region is the region of interest.
It was therefore necessary to confirm that the glow from the actuators was not compromising the results, and generating false velocity data in that region. The analysis results were based solely on the health and relative energy of the boundary layer, and thus
32
if the velocity data in this region was incorrect the results would all become void. In order to determine the accuracy of the velocity data it was decided to mask out the image regions affected by the glow. The unsteady nature of the actuators was such that they were not always on when images were taken. Thus by removing the affected portions of the images some velocity data was still left with which the computer calculated the boundary layer velocity. Example images showing the different masks applied to the collected images are shown in Figure 4.7 below.
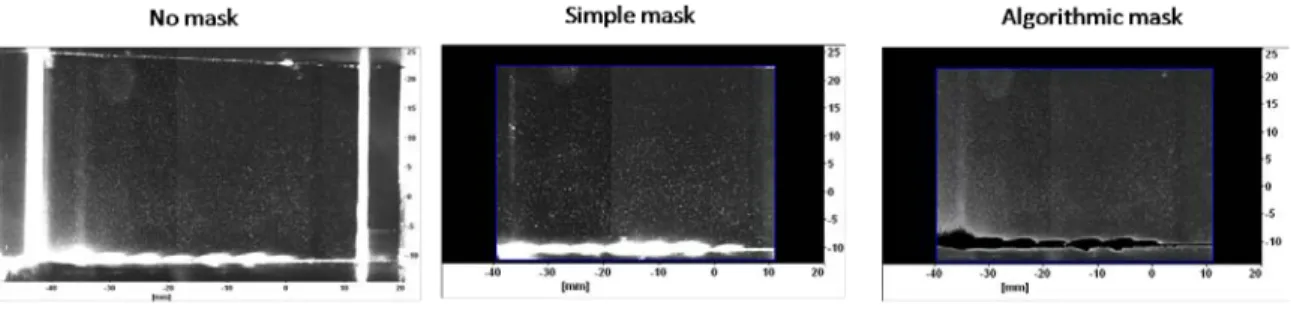
Figure 4.7: Examples of Unmasked and Masked Images
The image on the left is an unmasked, raw image. The glow from the actuators can be seen on the floor of the test section. The image in the middle is an image with a simple mask applied. This mask eliminated the laser reflections from the windows and ceiling of the test section. The simple mask was used in processing all of the velocity maps shown up to this point.
An image with the algorithmic mask applied is shown on the right of Figure 4.7. It will be noted that the glow of the actuators has been masked out by the intensity sensing algorithms used by the computer. For more information regarding the intensity sensing algorithm, and the exact method it used to mask out pixels, please refer to the manual for DaVis 7.1. The images masked with the algorithmic mask were then processed, and velocity maps were generated for them. Figure 4.8 compares the velocity
33
map of the best forced case, that with the actuators at Xa* = -1.25, and a forcing
frequency of StF = 0.03.
Figure 4.8: Velocity Map Comparison for Images Processed with Different Masks The velocity map on the left was processed using the simple mask, while the velocity map on the right was processed using the algorithmic mask to remove the actuator glow. By comparing these two velocity maps it will be seen that the glow of the actuators did not significantly alter the results of the velocity calculations. Indeed a careful examination of the boundary layer in each case shows that the boundary layer velocity is slightly higher for the case in which the algorithmic mask was used. The difference is not great enough to warrant reprocessing all of the images using the algorithmic mask. It is however, enough to be sure that the glow from the actuators is not causing the results to be misinterpreted. It can be said with certainty that the actuators did energize the boundary layer and thus prevented separation from occurring.
34
CHAPTER 5: Summary and Future Work
In this thesis research of the ability of LAFPAs to control a SWBLI in order to prevent separation was discussed. First the facility was characterized, and determined to be a suitable environment in which to test the actuator's control authority over SWBLIs. The characterization was performed by taking stereo PIV data at 8 cross-stream planes. The streamwise velocity components measured at these planes are shown in Figure 4.1.
After determining that the facility was a suitable environment in which to test the actuators, a limited parametric sweep was conducted to find the location, forcing frequency, and mode that would maximize the control authority of the actuators. It was found that when the actuators were placed at Xa* = -1.25, and operated in phase at a
forcing frequency of StF = 0.03, the best control was obtained. These operating
parameters yielded a significant boundary layer velocity increase, from about 0.08 to 0.35 normalized velocity. The velocity map for this case is shown in Figure 4.3. Thus the actuators are capable of significantly energizing the boundary layer and preventing or reducing separation.
The dependence of the control ability of the actuators on both their location and the mode in which they were operated was investigated; Figures 4.5 and 4.6 show these cases respectively. The actuators were found to be much more effective when placed upstream of the front leg of the lambda shock structure. The reasons for this are easily explained by both of the believed control mechanisms: if the actuators are forcing instabilities in the front leg of the lambda shock then they must be placed in such a way as to maximize the amplitude of the forcing, and if the actuators are energizing the boundary layer by generating streamwise vorticity then they must energize it before the
35
primary shock impinges on it. The reason for the dependence of the control authority of the actuators on the mode in which they are operated is not currently well understood. Further experimentation is necessary in order to determine why this occurs.
In the future this research will be expanded to try to learn more about the LAFPAs, and how they interact with, and control a SWBLI. The parametric range over which the actuators are tested must be expanded to determine that the location in parameter space of the maximum control authority has indeed been discovered. Expanding the parameter range may also give insights into the mechanisms through which the actuators exercise control. In addition specific experiments must be performed to investigate the exact nature of the instability forcing mechanism, and to confirm or refute the streamwise vorticity mechanism. To this end stereo PIV will continue to be used as a diagnostic tool, as it allows simultaneous collection of 3 velocity components, allowing for streamwise velocity, and streamwise vorticity to be calculated. This research will be expanded in partial fulfillment of a master's degree in Mechanical Engineering at The Ohio State University.
36
REFERENCES
Adamson, T. C., and A. F. Messiter. "Analysis of Two-Dimensional Interactions between Shock Waves and Boundary Layers." Annual Review of Fluid Mechanics. 12 (1980): 103-38.
Anderson, Bernhard H., Jon Tinapple, and Lewis Surber. "Optimal Control of Shock Wave Turbulent Boundary Layer Interactions Using Micro-Array Actuation." AIAA Paper 3rd Flow Control Conference. 2006-3197 (2006): 1-14.
Caraballo, E., Webb, N., Little, J., Kim, J.-H., Samimy, M. "Supersonic Inlet Flow
Control Using Plasma Actuators." AIAA Paper 47th Aerospace Sciences Meeting. 2009-924 (2009): 1-14.
Dolling, David S. "Fifty Years of Shock-Wave/Boundary-Layer Interaction Research: What Next?" AIAA Journal 39. 8 (2001): 1517-31.
Dupont, P., S. Piponniau, A. Sidorenko, and J. F. Debiève. "Investigation by Particle Image Velocimetry Measurements of Oblique Shock Reflection with Separation." AIAA Journal 46. 6 (2008): 1365-70.
Dussauge, Jean-Paul, Pierre Dupont, and Jean-Francois Debiève. "Unsteadiness in Shock Wave Boundary Layer Interactions with Separation." Aerospace Science and Technology 10. 2 (2006): 85-91.
Kalra, Chiranjeev S., Sohail Zaidi, and Richard B. Miles. "Shockwave Induced Turbulent Boundary Layer Separation Control with Plasma Actuators." AIAA Paper 48th Aerospace Sciences Meeting and Exhibit. 2008-1092 (2008): 1-8.
Leonov, Sergey B., Dmitry A. Yarantsev, and Victor R. Soloviev. "High-Speed Inlet Customization by Surface Electrical Discharge." AIAA Paper 44th Aerospace Sciences Meeting and Exhibit. 2006-403 (2006): 1-9.
Ogawa, H., and H. Babinsky. "Shock/Boundary-Layer Interaction Control Using Three-Dimensional Bumps in Supersonic Engine Inlets." AIAA Paper 46th Aerospace Sciences Meeting and Exhibit. 2008-599 (2008): 1-15.
Samimy, M., J.-H. Kim, J. Kastner, I. Adamovich, and Y. Utkin. "Active Control of a Mach 0.9 Jet for Noise Mitigation Using Plasma Actuators." AIAA Journal 45. 4 (2007a): 890-901.
Samimy, M., J.-H. Kim, J. Kastner, I. Adamovich, and Y. Utkin. "Active Control of High-Speed and High-Reynolds-Number Jets Using Plasma Actuators." Journal of Fluid Mechanics 578. 1 (2007b): 305-30.
Syberg, Jan, and Joseph L. Koncsek. "Bleed System Design Technology for Supersonic Inlets." Journal of Aircraft 10. 7 (1973): 407-13.
Utkin, Yurii G., Saurabh Keshav, Jin-Hwa Kim, Jeff Kastner, Igor V. Adamovich, and Mo Samimy. "Development and Use of Localized Arc Filament Plasma Actuators for High-Speed Flow Control." Journal of Physics D: Applied Physics 40. 3 (2007): 685-94.
Yan, H., and D. Gaitonde. "Effect of Thermally-Induced Surface Perturbation in Compressible Flow." AIAA Paper 47th AIAA Aerospace Sciences Meeting. 2009-0923 (2009): 1-16.