Earnings Forecast Accuracy
- Are earnings forecasts more accurate
in the post IFRS adoption period?
Master essay, 15 ECT points, FEKH95, Accounting and Management control. Presenting date: 30th of May, 2013
Authors: Gustaf Bertland and Jens Skönnå Supervisor: Kristina Arstberg
Abstract
Title:
Earnings Forecast accuracy; Are earnings forecasts more accurate in the post IFRS adoption period
Seminar date: 2013-05-30
Course: BUSN69 Degree Project - Accounting and
Auditing, 15 ECTS credits
Authors: Gustaf Bertland and Jens Skönnå
Advisor: Kristina Artsberg
Key words: earnings, forecasts, accuracy, analysts, IFRS
Purpose: The purpose of this thesis is to examine the
accuracy of earnings forecasts.
Methodology: Qualitative & Quantitative study, Wilcoxon Sign
Rank Test
Theoretical perspectives: The theoretical perspective reflects previous
researches that consider behavioral, information symmetry, psychological aspects and rational theories, examines the influence of accounting standards
Empirical foundation: The study includes 6 interviews with analysts and
statistical tests of earnings forecasts compared to actual earnings. The sample consists of 40 corporations from NASDAQ OMX Stockholm, Large - and Mid Cap markets. The study includes year 2000-2010.
Conclusions: We were able to conclude that there were
different factors, which contributed to accurate earnings forecasts. We can however not conclude that forecasts accuracy has improved post IFRS adoption hence our empirical and interview results.
Contents
1. INTRODUCTION ... 1 1.1 BACKGROUND ... 1 1.2 PROBLEM DISCUSSION ... 2 1.3 RESEARCH QUESTIONS ... 3 1.4 PURPOSE ... 3 1.7 DISPOSITION ... 4 2. THEORIES ... 5 2.1 BEHAVIOURAL THEORIES ... 5 2.1.1 Prognoses theory ... 52.1.2 Psychological factors which affects prognoses ... 5
2.1.3 Herd behaviour and optimism ... 5
2.1.4 Over and, -‐ under reactions towards new information ... 6
2.1.5 Consensus forecasts ... 7
2.1.6 Information symmetry ... 7
2.1.7 Organisational size and industry affiliation ... 8
2.2 RATIONAL THEORIES ... 8
2.2.1 Efficiency market-‐hypothesis ... 8
2.2.2 Accounting changes and earning predictability ... 9
2.2.3 Fair Value Accounting ... 10
2.2.4 The connection between accounting and corporate valuation ... 10
2.2.5 Factors that is affecting accounting quality ... 11
3. RESEARCH METHOD ... 14
3.1 RESEARCH APPROACH ... 14
3.2 DATA SELECTION ... 15
3.2.2 Primary data – Interviews ... 16
3.2.3 Primary data -‐ Statistical test ... 17
3.2.4 Secondary Data ... 17 3.3 SOURCE CRITICISM ... 18 3.3.1 Validity ... 18 3.3.2 Reliability ... 19 3.3.3 Replicability ... 19 3.4 EXCLUSION ... 19 3.6 STATISTICAL TEST ... 20
4. EMPIRICS AND ANALYSIS ... 24
4.1 FORECAST ACCURACY ... 24
4.2 EARNINGS FORECAST COMPARED TO ACTUAL RESULTS FOR ALL SURVEYED ENTITIES DURING YEAR 2000-‐2005 ... 24
4.3 EARNINGS FORECAST COMPARED TO ACTUAL RESULTS FOR ALL SURVEYED ENTITIES DURING YEAR 2006-‐2010 ... 25
4.3.1 Analysis of all investigated companies during 2000-‐2010 ... 26
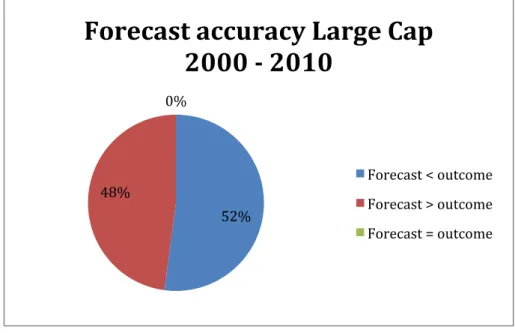
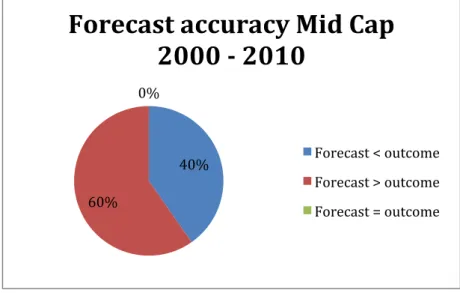
4.4 EARNINGS COMPARED WITH PROFIT FORECAST FOR LARGE AND MID CAP ... 30
4.4.1 Large Cap ... 30
4.5 PROFIT FORECASTS COMPARED WITH ACTUAL RESULTS COMPARING DIFFERENT INDUSTRIES ... 33
4.5.1 Industrial Sector ... 33
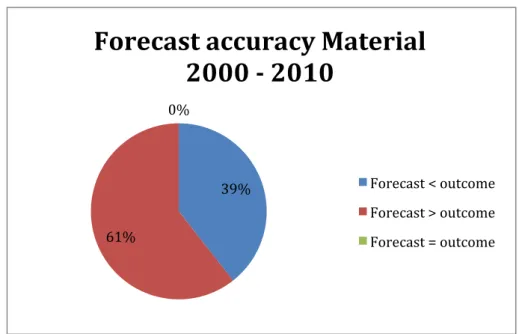
4.5.2 Material Sector ... 34
4.5.3 Consumer Good Sector ... 35
4.5.4 Health Care Sector ... 36
4.5.5 Analysis of different industry sectors ... 37
4.6 OVERVIEW OF THE RESULTS ... 39
4.7 ANALYSE OF THE INTERVIEWS ... 40
5. CONCLUSION ... 44 5.1 CONCLUSION ... 44 5.2 REFLECTIONS ... 45 5.3 FUTURE RESEARCH ... 46 6. SOURCES ... 47 6.1 PUBLISHED SOURCES ... 47
BARTH, M.E., LANDSMAN, W.R. AND LANG, M.H. (2008) INTERNATIONAL ACCOUNTING STANDARDS AND ACCOUNTING QUALITY. JOURNAL OF ACCOUNTING RESEARCH 46(3), P 467-498 ... 48
S SÖDERSTRÖM, N. AND SUN, K. (2007) IFRS ADOPTION AND ACCOUNTING QUALITY: A REVIEW. EUROPEAN ACCOUNTING REVIEW, VOLUME 16(4) P 675-702 ... 49
6.2 ELECTRONIC SOURCES ... 49
6.3 FINANCIAL STATEMENTS ... 50
APPENDIX 1 -‐ OVERVIEW OVER COMPANY’S, INDUSTRY AND MARKET SECTOR ... 1
APPENDIX 2 -‐ EARNINGS / SHARE 2000-‐2005 VS FORECAST 2000-‐2005 ... 2
APPENDIX 3 -‐ EARNINGS / SHARE 2006-‐2010 VS FORECAST 2006-‐2010 ... 3
APPENDIX 4 – OVERVIEW OF THE RESULTS ON LARGE CAP 2000-‐2010 ... 4
APPENDIX 5 – OVERVIEW OF THE RESULTS ON MID CAP 2000-‐2010 ... 5
APPENDIX 6 – OVERVIEW OF THE RESULTS IN THE INDUSTRY SECTOR 2000-‐2010 ... 6
APPENDIX 7 – OVERVIEW OF THE RESULTS IN THE CONSUMER GOOD SECTOR 2000-‐20107 APPENDIX 8 – OVERVIEW OF THE RESULTS IN THE MATERIAL SECTOR 2000-‐2010 ... 8
APPENDIX 9 – OVERVIEW OF THE RESULTS IN THE HEALTH CARE SECTOR 2000-‐2010 ... 9
APPENDIX 10 – INTERVIEW QUESTIONS ... 10
1. Introduction
This chapter presents the background to the research and the focus of this paper in the form of research question, purpose and limitations.
1.1 Background
Stock markets throughout the world during recent years proven to be extremely volatile hence the hardened macroeconomic climate. It is needless to say that the globalization has contributed to domestic markets being interdependent on each other where a single country´s financial problem may send shockwaves implicating other financial markets. A vivid and contemporary example of this is how countries facing domestic financial difficulties within the European Union and are now being seen as threats to the entire European financial sector (Europaportalen.se). At the same time, companies are growing internationally thus, experiencing a greater need of capital to finance their operations. In order to attract “cheap” capital they are searching outside their domestic borders and are now operating on a, if not global, international scale. Before, country´s had their own legislations for how organisations were supposed to prepare financial statements (ibid). However, investors who were interested of investing in a company which was located in another country often faced difficulties understanding foreign financial statements hence; accounting legislation appears different from one country to another. A demand for an accounting concept enabling investors to compare financial statements across different domestic markets and contributed one of the reasons behind the development of IFRS.
Fair value accounting is a generic term of rules and refers to IAS and IFRS. The purpose is to develop a single set of high quality standards, which are applicable on a global scale thus, creating "efficient and cost-effective capital markets”. The decision to adopt the application of international accounting standards are binding to all EU member states and implies that all firms in these countries, which are listed on a regulated capital market, shall prepare their financial statements in compliance with IFRS. This in turn means that companies listed on NASDAQ OMX Stockholm shall comply with IFRS rules for financial years commencing after January 1, 2005. (icaew.com)
Prior research has shown that rational and behavioural implications must be considered when analysts are constructing forecasts. IFRS is developed to provide investors with relevant
decision-making material, but how relevant are financial statements in the decision process is yet to be concluded. Has the compulsory adoption of IFRS increased the value of financial statements regarding producing forecasts?
”Collectively we are still at the stage of discovery, like a child who has just been given its first bicycle. We need time to adjust and take a long view. The job of an analyst is to put figures in perspective and for the time being we do not yet have that perspective: the change is still too close.” // (Bertrand Allard and Jacques de Greling, p. 11)
1.2 Problem discussion
We believe that forecasts have come to play an important role to investors and financial institutions as a result of increasingly internationalized, volatile and complex capital markets. Lang and Lundholm (1996) studied the relationship between forecast accuracy, the degree of information available on the market and the importance of involving the management in order to retrieve information. They stressed that forecast accuracy increased for companies, which supplied high-quality information to analysts. A problem analyst´s are facing is that entities have different ways to allocate their earnings. It is important that analysts stay informed and are able to adapt to the changing environment they are currently facing. IFRS was implemented in 2005 for all listed companies in Europe (icaew.com). Prepares must be able to understand the substance of the transaction hence the principle-based framework, IFRS, in order to select the accounting method, which is most representative. (journalofaccountancy.com) It is obvious that prepares and auditors must be able to understand the IFRS framework and capable to apply the new rules that IFRS states. An implication that might have occurred is that analysts do not share the same interest for learning the new framework and the impact on their earnings forecasts might have been compromised due to their lack of knowledge.
Macroeconomic factors, such as, consumer price index, CPI, and the cycle in the economy affect corporate profits thus, creating an issue in the process of producing forecast. However, sectors are affected differently, the size of an entity is another variable that must be considered in analysts work. But how valuable is accounting information to an analyst? Does an analyst investigate future aspects and external factors more closely than financial reports? Has the implementation of IFRS impacted forecasts accuracy in a manner, which, results in more accurate predictions? The reliability of the forecasts should be relevant to investors and
companies alike. We believe that it is important for investors to have knowledge regarding which aspects analysts base their projections on and how reliable they are when they produce earnings forecasts.
1.3 Research questions
• Has the implementation of IFRS, i.e. fair value accounting, in 2005 led to earnings forecasts being more accurate and if so, can the implementation of IFRS solely be credited for this?
i.How much influence do financial statements have on the reliability regarding earnings forecasts?
ii.How important are financial statements to an analyst when constructing earnings forecasts?
iii.What other sources of information and which aspects is an analyst valuing when producing forecasts?
iv.Do analysts consider size or industry differences in their forecasts projections?
1.4 Purpose
Our purpose is to investigate if the implementation of IFRS has affected the accuracy of the projections made by analysts. We also intend to examine why differences might occur in the pre and – post adoption of IFRS thus, the reliability in earnings forecasts as a basis for investment decisions on financial markets in Sweden.
1.5 Limitations
The companies we examine origins exclusively from NASDAQ OMX Stockholm Large - and Mid Cap markets. The scope of the thesis is limited to the time period 2000 - 2010.
1.6 Targeted audience
The essay’s primary audience are researchers and university students at graduate level who are studying within the field of business administration. Prior knowledge of statistics, basic understanding of generally accepted terminology and knowledge of IFRS is also expected of the reader.
1.7 Disposition
Chapter 2: In this chapter we will introduce the reader to research studies related to the topic.
Chapter 3: In this chapter we aim to explain to the reader how we proceeded in data collection, introduce the reader to Wilcoxon sign rank test by presenting our hypothesis. But nonetheless explain the reasons behind our interviews
Chapter 4: In this chapter we present our answers in the interview combined with empirical results from Wilcoxon sign rank test and conducting an analyse in the light of theories
Chapter 5: The final chapter presents our conclusions, reflections and provides suggestions for future research.
2. Theories
This chapter presents relevant theories that facilitate the analysis combined with in-‐depth interviews.
2.1 Behavioural theories
Behavioural theories attempt to explain why actions, alternatively opinions might change due to certain events. These theories concern environmental, personal, and behavioural characteristics as factors in behavioural determination.
2.1.1 Prognoses theory
Prognoses theory illustrates the complexity of predicting future events, e.g. future profitability using factors from past and - or current events. There are two different approaches analysts can apply when analysing a company through a technical or, - fundamental analysis. The fundamental analysis is based on a technical analysis i.e. how the general market or the particular branch a company is affiliating with is performing. A fundamental analysis also investigates the individual company’s performance in a given time period. In addition to quantitative information, which fundamental and technical analyses are based on, analysts can access qualitative information e.g. directly from managers. Brown et al (2002) presents a research, which have shown that analyst are able to construct more accurate prognoses than a statistical model solely based on quantitative information could hence, analysts are also able to access qualitative information.
2.1.2 Psychological factors which affects prognoses
Within the financial behavioural research, studies have been conducted to explore how different types of psychological phenomena e.g. prejudice or heuristics can affect the decision making process (Shefrin, 2007). In following paragraphs we will explore and account for theories, which can help explain how analyst’s behaviour can be affected by psychological factors and in turn, how it could affect their prognoses.
2.1.3 Herd behaviour and optimism
Studies have shown that there is a relationship between a company’s projected profit and optimistic - pessimistic herd behaviour from analysts. Herd behaviour relates to the fact that others affect analysts within the profession and wants to avoid to “stand out from the group”.
Andersson (2009) researched this behaviour and found that analysts tended to rely on a majority rather than on a minority regardless of how the majority was performing.
“Earlier research has proven that herd behaviour exists on stock-markets. This could be seen as an obstacle for an efficient stock-market, due to that investor could be tricked into making risky investments, which in turn leads to extreme fluctuations in stock price and instable markets.” (Andersson, 2009, s.8)
De Bondt and Forbes (1999) studied herd behaviour within in the analyst profession and found that there is a general tendency for them to be overly optimistic when constructing forecasts. One reason, which contributed to this fact, was that they were affected by information originating from organisations. Analysts, which are employed by e.g. banks and investment brokerages firms, might have incentives to produce aggressive forecasts, which contribute to overly positive prognoses. Schipper (1991) concluded that analysts tended to produce more positive prognoses hence the fact that, if they were able convince clients to invest on the stock market they received brokerages and thus higher compensation. An optimistic forecast about a certain company would also maintain a strong relationship with company managers, from which analysts retrieves valuable information when conducting forecasts.
2.1.4 Over and, - under reactions towards new information
An abundance of research has been conducted with the intention of examining how reliable analyst´s prognoses can be deemed to be. The research has shown that analysts are displaying shortcomings in performing accurate prognoses. The theory indicates that analysts tend to be overly optimistic when constructing their forecast thus putting too much emphasis on positive information and to some extent disregarding negative information. Reactions towards positive information is stronger than to negative, is one of the main explanatory factors to why forecast often are overstated. De Bondt and Forbes (1999) researched consensus prognoses in Great Britain during a ten-year period and found evidence of over-optimism in the prognoses that analyst constructed.
Research performed by Amir and Ganzach (1998) examined reasons that contributed to over and under reactions. This resulted in the emergence of three different patterns which have an impact on analyst´s performance when constructing forecasts; representativeness, reference
points and carefulness. Representativeness is when analysts have a tendency to assimilate the extremes in information that is presented to them thus, leading to an overreaction when making or adjusting prognoses. Reference points, leads to an under reaction when making adjustments to forecasts. Analysts are perceived to have their own view and reference points, and their forecasts are therefore produced in a subjective way. Consequently, reactions to new information will leave their adjustments inadequate. The research shows that analyst tend to adjust their prognoses and revaluate their reference points if they receive positive rather than negative information. This will result in forecasts, generally being overstated which represents the third behavioural pattern, namely carefulness.
2.1.5 Consensus forecasts
Behavioural patterns like those who are described by Amir and Ganzach (1998) most likely result in individual forecast errors. Conroy and Harris (1987) investigated the benefits of using consensus prognoses instead of relying on one sole analyst´s performance. They argued that consensus prognoses have a portfolio effect on individual errors and therefore has a diversification effect, which would reduce forecast errors. The use of consensus prognoses could result according Conroy and Harris (1987) in forecasts, which are more accurate hence, diversification effects.
2.1.6 Information symmetry
Lang and Lundholm (1996) discovered a link between information frequency and forecast creditability. A reasonable part of the information, which analysts use to construct their prognoses, origins directly from corporations through e.g. quarterly reports. Hence, if corporations control part of the information, they also control parts of the forecast creditability thus, they have an opportunity to choose what information to disclose. Through increased information symmetry analysts will be able to bridge the “information gap” which Lang and Lundholm (1996) argue is an issue when producing forecasts. They also claim that companies are reluctant to disclose to much information about the their operations thus, the effects of full disclosures are perceived to have more disadvantages than advantages. The variations in disclosures are perceived by Lang and Lundholm (1996) to further complicate analyst’s ability to construct accurate forecasts.
2.1.7 Organisational size and industry affiliation
A study conducted by Patz (1989); a linkage between the reliability of the prognoses and the size of an entity was discovered, which confirms Lang and Lundholms study regarding the importance of information frequency when producing accurate forecasts. Larger organisations are often perceived to be more stable and e.g. attract more attention from media. The additional attention put on larger companies is, according to Patz (1989), an explanatory factor why analyst´s to a larger extent prepare more accurate forecast compared with smaller-sized entities. Patz also discovered another relevant factor, which affected the reliability of forecast, namely in which sector the company operates. He concluded that the industrial sector was the one that analysts had most trouble with when constructing forecasts. Bushman (1989) confirmed Patz results and acknowledge the relevance of disclosures when making prognoses but added that companies would generally benefit from increased disclosures of information.
2.2 Rational theories
A rationale theory attempts to explain a framework for understanding social and economical behaviour. Individuals are assumed to be rationale and act in self-interest.
2.2.1 Efficiency market-hypothesis
Contributing factors to price changes and severe fluctuations within financial markets value are something, which carefully have been studied by researchers. A significant reason to why market changes occur is that new information has reached the market and thus affects the value of assets (Elton et al., 2003).
A question that has been discussed is how quickly and to what degree markets react and adapt to new information. On an efficient market it is assumed that there is no significant delay between when the new information about e.g. an asset and the adjustment of the market value. This would result in a scenario where investors are lacking opportunities to find over- or undervalued assets or stocks hence there is no information asymmetry. Access to, and gathering of, information about a specific asset or stock would leave investors with little or no chance of finding undervalued items. If there is information, which could affect the market value it would already have occurred hence, there would be no “free meals” for investor to find. (Ross et al. 2003)
To what degree and pace a market adapts to new information can vary and is dependent on what type of information that is revealed from concerned parties. The efficiency market-hypothesis is therefore divided into three different categories, strong, semi-strong and weak form of efficiency. (Ross et al. 2003) The strong form of efficiency exists when all information, both public and private, are computed into e.g. a share´s price. Hence, there will exist no opportunity for investors to find stocks who are incorrectly priced. The second type, semi-strong efficiency, makes a distinction between public and private information. It presumes that only public information e.g. annual reports, historical values and other publicly known disclosures comprise a stock´s value. This would mean that there does not exist an opportunity for investors to find over- or undervalued shares through publicly known information. The third type of market efficiency, weak form, is characterised by that there is no way to generate access returns by investigating historical price development or visible patterns on a share’s movement in value (Ross et al., 2003). However, it is possible, by using a fundamental analysis, generate access returns. (Elton et al. 2003)
2.2.2 Accounting changes and earning predictability
Elliot and Phillbrick (1990) researched analyst´s forecasts in the presence of changes in accounting policies. Their investigation was based on earlier research performed within this genre and found a significant correlation between errors in analyst´s prognoses and the impact of an accounting change. The correlation was stronger if analysts did not know about the accounting change, if they could not in advance appreciate the impact of the change, or neglected to update their forecast methods.
All three factors mentioned above contributed to a loss in analyst’s possibility to predict organisations net profit. The survey they conducted entailed 612 accounting changes and 500 companies during 1976 – 1984. They concluded that analysts had not been successful in their efforts to change or adapt the methods they use when producing forecasts to how the new accounting policy affected them. Differences between forecast and real outcomes were greater during years when accounting changes were made than years when no changes to accounting policies occurred. They also found the effects of accountings changes were larger when changes were made and there was a simultaneous lack of information of how certain accounting changes would affect analysts.
2.2.3 Fair Value Accounting
The financial reporting standard IFRS has been developed to entail future values instead of historical values. One of the primary objectives with the implementation of IFRS and its development has been to increase investor usefulness. Toppe-Shortridge et .al (2006) argued that one of the main benefits with fair value accounting is that, unlike historical cost, it accomplishes this hence, market values are more beneficiary for investment decisions. They argue that historical values do not contribute useful information for investors while market values are able to add, to a lager extent, relevant information for investors to base their decisions on. They points to the fact that a company´s market value widely exceeds its book value which high lightens the problem historical values shortcomings. At the same time, they are aware of the weaknesses that IFRS contribute regarding valuations. When assets are appreciated at market value, the valuations are often not based on real transaction but instead on managers own judgement about what an assets market value really is. This could in turn leave managers with incentives to manipulate numbers to shine a better light on the organisation. They put the two different ways of accounting, historical cost and fair value, into contrast with each other. If corporations decide to base their accounting on historical cost it will not contribute the same useful information to investors and analysts as fair value would. But on the other hand, if entities choose to account in accordance with IFRS analysts and investors are left with valuations, which may be biased and lack in reliability.
2.2.4 The connection between accounting and corporate valuation
Accounting and corporate value are strongly linked and the accounting information which is produced is of importance to analysts hence, financial reports are a natural base for analysts when constructing forecasts. Antill and Lee (2005) describe numerous factors where accounting has a direct influence on corporate values. As an example they argue that certain multiples are solely based on accounting like EV/EBIT. If the accounting format changes, which are the base for these types of calculation, then the output of the calculation would differ, something that would contribute complications to investors and analysts. This means that they would need to change their valuation models for the data to once again become relevant. Disclosures of new information is also something that will affect a corporation’s value, particularly if new information is introduced, which analysts did not possess before. The markets way of reacting to accounting information which is perceived to be unbiased and systematically produced is an indication of how relevant the realised information was. This
however does not mean that accounting information is produced in an optimal way; neither does it say anything about how the market will react if the information was produced in a different way. This would imply that analysts and investors in general must be aware of in what way the information is provided to them, as it could be the result of management decisions. This would also imply that there is a contingent information asymmetry within the financial markets thus, management is perceived to possess more information than investors and analysts. Analysts and investor can never be certain about the information authenticity when it is provided from entities hence, managers incentives to manipulate figures in self interest. (Soffer & Soffer 2003) These facts highlight the importance of that analysts and investors always have to be critical when examining information they are provided with. There is a need for them to widen their knowledge in order to interpret the information. (Brealey et.al. 2001).
2.2.5 Factors that is affecting accounting quality
In the article written by Söderström and Sun (2007) they stated that; one cannot derive the conclusion that the improvement of accounting, due to mandatory adoption of IFRS, can be generalized and be applied in times when IFRS is mandatory for all listed companies within EU. They argue that accounting quality is a function of three different factors. 1, a countries legal and political system, 2, the quality of accounting standards, 3, financial reporting incentives. After making a literary review they found that a countries legal and political system does not only have a direct affect on the accounting quality but also an indirect affect on the reporting incentives. The incentives were divided into four elements namely; capital structure, ownership structure, tax system and financial market development. They constructed a schematic picture over how the three factors contribute to accounting quality, both directly and indirectly.
A survey conducted by Barth et al (2006) examined if corporations, which are applying IAS in their financial statements are displaying an increased accounting quality. This led to the conclusion that, corporations which applied IAS exhibited, among other things; timely loss recognition and less earnings smoothing. However, they were not able to conclude if this solely could be credited to the implementation of IFRS or, if corporations experienced a change in market incentives.
2.3 Overview of the theories
Factor Author (Year) Explanation Prognoses theory
Brown et al(2002)
Shown that analyst is able to construct more accurate prognoses than another statistical analysis, which are solely based on quantitative information.
Psycologic behaviour
Shefrin(2007)
Behaviour can be affected by psychological factors and in turn how this could affect their prognoses.
Herd behaviour & optimism
Schipper(1991)
De Bondt&Forbes(1999) Andersson(2009) Amir & Ganzach(1998)
Optimism and herd behaviour affects analysts ability to produce forecasts Information Symmetry Lang&Lundholm (1976) Patz (1989) Bushnan (1989)
The volume of information published by entities, depending on size and industry, affecting forecast reliability.
Effiencymarket hypothesis Elton et al (2003) Ross et al(2003)
There are three major versions of the hypothesis: "weak", "semi-‐strong", and "strong". Effiency market-‐hypothesis asserts that financial markets are "informationally efficient"
Accounting change & earning predictability
Fair value accounting
The Connection between accounting and corporate valuation
Factors that is affecting accounting quality
Elliot & Philbrick (1990)
Toppe-‐Shortridge et al(2006)
Brealy et al(2001) Antill & Lee(2005) Copeland et al(2005) Soffer(2003)
Söderström & Sun (2007) Barth et al(2006)
They researched analyst´s prognoses in the presence of changes in accounting policies.
One of the primary objectives with IFRS and its development has been to increase its investor usefulness.
Accounting and corporate value are strongly linked to one another and the accounting information which is produced is of great importance to analysts hence that the financial reports are a natural base to start form for analyst when making their valuations.
Argue that accounting quality after IFRS adoption hinges on three factors: (1) the quality of the standards; (2) a country’s legal and political system; and (3) financial reporting incentives.
3. Research Method
In this chapter we explain the research methods used to collect and analyse historical data, data selection and choice of sources. But also how we were conducting our interviews.
3.1 Research approach
There are two different research approaches, therefore the authors of the thesis had two choices; either quantitative or a qualitative approach. A quantitative study is when answers derive from e.g. statistical data (see, 3.2). Qualitative research is often based on, e.g. interviews (see, 3.2.2.) and provides, to a greater extent, in-depth knowledge and examines “why is there a difference”. (Bryman & Bell, 2005) In regards to our essay both methods will be used, hence the purpose of the thesis and how we chose to formulate our research questions. We will investigate, with help from our research questions and statistical test, if there is a difference in forecast accuracy after the implementation of IFRS but also examine, if differences did occur, why there was a discrepancy with help from our interviews.
We are confident that by combining these two research approaches we will provide further insight to readers, thus bring deeper understanding to which factors that affect forecast accuracy. Our original approach was only to use statistics as a base for the analysis, how the implementation of IFRS has affected the forecast accuracy. But after realising that there are several factors, which affects forecast accuracy that a statistical test could not explain, a decision was made to elaborate our approach and use statistics and interviews to deepen our understanding regarding the subject. Patel and Davidson (2011) differentiate to work in an inductive way from a deductive. Initially, in this essay, we worked in an inductive way in order to enable us to construct hypotheses. Further explanation regarding hypotheses, see section 3.6.1
We have chosen years between 2000 and 2010 as an investigative platform to examine the prior mentioned aims of the essay. There are several factors, which we believe make the time period representative. Firstly, it is chosen to include both a pre-adoption and a post-adoption period, which almost are equally long. Secondly, we chose to add one more year to the post-adoption period. We believe that financial crises can affect forecast accuracy, thus enabling us to investigate how financial crises are affecting forecast accuracy both in pre- (2001
IT-bubble) and post- (2008 Financial crises) adoption of IFRS. By adding an extra year to our research this will be achievable.
3.2 Data selection
3.2.1 Selection of Entities
The companies that we have selected are, and have been, during the investigated time period, registered the NASDAQ OMX Stockholm. To add balance to the essay, all our forecasts derive from the first week of October of each investigated prior year. The motive origins from that information is available on the market, Q1 and Q2 - reports, while there is room for speculation about the Q4 report, and in some cases Q3 reports. We consider NASDAQ OMX Stockholm to be sufficiently liquid market and corporations are represented to a larger extent than e.g. Aktietorget and NGM, in order to add value to our study. As a point of reference we have chosen to use 40 different corporations to conduct our study on. These corporations are located on Large- and Mid Cap. For a detailed overview of chosen corporations, see appendix 1.
There are two reasons to why we are conducting this study on NASDAQ OMX Stockholm in general and to the Large - and Mid Cap markets in particular. Firstly, to our knowledge, no other research have been done to these stock markets in order to investigate what we are aiming accomplish. Secondly, Large - and Mid Cap are two marketplaces that are able to provide us with a reasonable possibility to make an informed sample of relevant companies, hence their general stature. We are confident that by including other markets we will not enhance the credibility of the thesis and other markets will not provide us with results that would alter our conclusions to a significant degree. Below are the criteria’s regarding the selection process:
• To contribute balance of the essay, the selection of businesses has been done with regards to what industry a company operates within. Industries will be represented to the highest possible degree however, we have chosen to exclude the following industries; Real Estate companies, investment companies and banks. The investment sector was excluded on the grounds that their business idea is to invest in other companies, thus their income is derived from other entities dividends and changes in share value. Earnings per share are therefore misleading, as it includes changes in value, which leads to consideration for the dividend investment companies receive.
This reasoning also applies to banks where analysts will face almost the same issues when producing forecasts. Real Estate companies also have a similar problem, namely that changes in value of estates affects net profit. Therefore, the impact of property prices must be taken into consideration when producing forecast, even if the item is included in their financial statements in term of interest expense. The real estate sector will therefore not be investigated separately.
• Financial statements from the investigated companies derive from the same reporting period, namely a calendar year. The reason we excluded companies, which do not present their financial reports at 20XX-12-31 is that the forecast may either be more or less accurate, depending on when the company’s fiscal year begin, due to the information dissimilarities.
• A company whose market capitalization is less than 150 million Euros has been excluded from our research due to the publicity from media, and attention from analysts.
3.2.2 Primary data – Interviews
Our six interviews were conducted in a semi-structured way which enabled us, in advance, to prepare questions and also ask follow up question hence our thesis requiring in - depth reflections to attain elaborate answers. Our intention of adding an interview segment to our thesis is to explain our statistical results. Statistical result can only show if analysts were, or were not producing accurate forecasts but are not able to explain which internal or external factors that created these results. The interviews will answer and explain why there are or are not differences between the pre- and post IFRS adoption period. The analysts we have been interviewing will represent analyst in general, as they are employed by some the largest banks in Sweden. We believe that by completing the dissertation with interviews, we get a deeper insight into which factors analysts considered to be important in the forecast preparation process. However the analysts asserted to be anonymous and we have no intention of breaking that promise.
Our questions were sent to the analysts well in advance to give them an opportunity to reflect on their answers, giving us an chance to not only receive direct responses to the question but also a deeper reflection regarding our subject. The questions were documented on paper and are shown in appendix 10. Questions asked have been derived from both well-established research and from our statistical test results. Questions were constructed to facilitate
discussions rather than direct answers to permit the participant to interpret, reflect and analyse, thus enabling us to widen our understanding and if possible, criticise what other researchers have concluded.
3.2.3 Primary data - Statistical test
The data, which have been used to conduct our statistical research, was retrieved from each individual company’s annual report and has enabled us to compute each company’s profit from the eleven-year period we chose to examine. The Swedish magazine “Affärsvärlden” provided the authors with earnings forecasts; they have a segment in their magazine called “Aktieindekator” where prognoses are made for all companies registered to the NASDAQ OMX Stockholm. In turn, “SME Direkt” provides “Affärsvärlden” with forecasts, SME Direkt’s primary function, among other things, is to construct forecasts on companies registered to the NASDAQ OMX Stockholm. The reason why we are only using one source for our prognoses is that the supply of these services is limited but it should be noted that, “SME Direkt” is the leading organisation in analysis services and producing prognoses in Scandinavia. (SME Direkt, 2012)
By using a statistical test we are able to answer the question; if there is a difference between forecasts and actual outcomes. Our target is to examine whether the implementation of IFRS has or has not improved earnings forecasts reliability. We also aim to investigate if there is a difference in forecast reliability when constructing prognoses for different market sectors and differences in company market capitalization. Further more; the test enables us to investigate forecast dispersion during the chosen time period, in regards to all the investigated companies and in particular market sectors. As the questions to whether IFRS has or has not improved forecast accuracy is in need of interpretation or reflection we strived to answer these questions in an unbiased fashion. A statistical test is a way to ensure that results are deduced with no possibility of being tainted by personal opinions on whether the implementation has or has not improved forecast accuracy. However, it does allow us to get unbiased answers and draw conclusions regarding internal and external factors.
3.2.4 Secondary Data
To add reliability to the essay we used a variety of secondary data in form of theoretical articles and prior research studies, which are well recognized within the subject. This has given us a possibility to examine factors that may implicate prognoses reliability and has
provided us with different angles by which we can research how analysts are affected by both rational and behavioural factors. In our theoretical chapter we aim to use scientifically recognized research. We are aware of the fact that some articles used in the introductory chapter are not scientifically credible. However, we believe they will highlight the problems within this field and we do not consider this fact to implicate the reliability and/or relevance of the thesis. Our theoretical framework has foremost been retrieved from Lunds University´s database “LibHub” and operates as a base in our research.
3.3 Source criticism
Selected sources have been carefully selected and examined based on their origin but also in regards to what extent they appear in similar studies. Through this approach we have tried to uphold the chosen materials reliability and relevance in an effort to sustain the essays representativeness. A criticism, which is inevitable to acknowledge, is that the forecast only derives from one source but we do not see this as an issue, which dismisses the essay or threatens its reliability / relevance. Regarding our interviews it is hard to determine whether the analysts are giving us truthful answers or not, but we believe that they are reliable since they lacking incentives to lie.
3.3.1 Validity
This study has a qualitative and quantitative approach due to the fact that our research questions are formulated in a way, which only allows them to be answered by professional individuals who have profound experience of constructing forecasts. The analyst´s that are responding to our questions are considered reliable hence, their knowledge regarding this subject is considered to be credible due to; they have exclusive insight on how to produce forecasts and factors that implicate them. Regarding this particular area, analysts possess information and knowledge within is field that others do not thus, making analysts the sole group that can answer these specific questions, see appendix 10. With these questions we intend to examine key factors, which are important and can affect earnings forecasts. To do this in a valid way we base our questions on prior research material made by other rewound researchers but also on our observed results, which the statistical test provided us with. The actual earnings in our study are based on data from company’s financial statements and the projections are collected from “Affärsvärldens Aktieindikator”. Using established theories,
and our choice of research method; we are confidant that our empirical research material is tested in a valid way.
3.3.2 Reliability
In this essay we chose to use a model that takes its starting point by examining paired observations; Wilcoxon Sign Rank Test. According to established literature and older essays, which conducted similar characteristics, Wilcoxon Sign Rank Test provides us with an opportunity to test our empirical material in a legitimate way. The retrieved data, which we partly base the essay, has been collected with care and in an effort to attain a high degree of reliability. Chosen articles are used as bases for further analysis of the data written by individuals with a high degree of knowledge within the relevant field and should substantiate the credibility of our research.
The retrieved financial statements have been examined and approved by each company's CEO, Board of Directors and an independent auditor. They are obligated to follow the basic rules of, ÅRL, (2000 – 2004), IFRS, (2005 – 2010) since companies are exclusively located on NASDAQ OMX Stockholm and monitored by Financial Supervisors, their function is to ensure that laws and regulations are followed on financial markets. (fi.se). Given the laws and regulations that must be followed, we are confident that the retrieved data is credible.
3.3.3 Replicability
In order to assess the quality of a quantitative and / or qualitative essay, and deemed reliable it has to facilitate a possibility to replicate the study (Bryman & Bell, 2005). We strived to design a transparent way of presenting our results in order to facilitate the reader's ability to make a consistent performance. The reader should be able to follow a clear workflow starting from retrieved data and conducted interviews on which the thesis is based.
3.4 Exclusion
Originally, we chose to examine 100 companies but had to reduce the number of companies due to the fact that a majority did not meet the criteria’s described in 3.4. Consequently, 60 companies were excluded and we were not able to achieve our pre-assessed goal; however, we still considers the sample to be sufficient in volume to examine whether the
implementation of IFRS affects how reliable analysts earnings forecast are in conjunction with our interviews. No interviews were excluded from the thesis.
3.5 Currency
Surveyed companies had differences in their reporting currency. The options that emerged were to either present the earnings and forecasts in EUR, USD or SEK, we chose to use the Swedish currency hence, a majority of the companies investigated used SEK. Exchange rate transformation occurred at closing date, 20XX-12-31. To avoid repetition, we will not highlight companies, which use foreign currencies in their annual reports, only acknowledge this fact and conclude that they can be compared equally in our essay. Spot rates derive from Oanda - Forex Trading and Exchange Rate Services (Oanda, 2013).
3.6 Statistical test
3.6.1 Hypothesis testing
We have, by performing a statistical test; been able to examine hypotheses aiming to investigate what degree earnings forecasts were coinciding with actual outcomes. The hypotheses we used were H0 and H1. The meaning of H0; there is a correlation between forecasts and actual outcomes, thus there is correlation between the populations if H0 is accepted (Körner & Wahlgren, 2005). If we find that there is no correlation between earnings forecasts and actual outcomes we reject H0 and accept H1. To determine whether H0 should be accepted or rejected, we use the Wilcoxon Sign Rank Test (detailed explanation see 3.7.3). The test provides a p-value, which determines the probability that the populations are correlating with each other (ibid). We have chosen to rate the outcome of the values in three different levels of significance:
• P < 0.01: The significant difference is greater than 99 percent • P < 0.05: The significant difference is greater than 95 percent • P < 0.10: The significant difference is greater than 90 percent
If we reject H0 with a probability greater than 99 percent, we believe that the validity of the test result is very strong. If we can reject H0 with a 95 percent probability, the tests validity is deemed as strong. If H0 is rejected with 90 percent probability, we think we can see a trend and therefore, test results do not attain the same validity as the other two categories, but we
still acknowledge that there are noticeable differences between populations and a trend can be derived.
We have chosen to use three different hypotheses where the forecasts are tested against the outcomes to see if it is possible to detect a difference in investigated areas. The hypotheses will not differ from each other and are tested in the same way, regardless if we investigate earnings forecasts in general or comparing different market sectors.
The zero hypothesis state:
• There is no significant difference between forecasts and actual outcomes.
Below is an explanation of the hypotheses we have used:
• Hypothesis 1: There are differences between forecasts and actual outcomes.
The test will help answer a part of our main question namely, if there is a difference between earnings forecast and actual outcomes.
• Hypothesis 2: There are differences in the accuracy of the forecasts depending on
the industry we investigated. Patz (1989) conducted a study in which he concluded that depending on the sector examined, the accuracy of the forecasts varies. Our hypothesis examines four industries: Industrial, Consumer Discretionary, Materials and Health Care.
• Hypothesis 3: The accuracy of the forecasts varies with the size of the company,
Large Cap versus Mid Cap entities. Based on Patz (1989) and Bhushans (1989) theories, we have chosen to examine if the size of company´s affects forecast accuracy. Lang and Lundholm (1996) studied how the level of information available on the market alters the accuracy of forecasts. The companies registered on Large Cap are examined to a higher degree of public and media thus, there is more information on the market about the companies (Patz, 1989).
3.6.2 Wilcoxon Sign Rank Test
In our study, we used Wilcoxon’s Sign Rank Test. The test is based on viewing paired observations and if the sampled variables follow the same distribution to examine the zero hypothesis. The observation provides an indication of differences between populations, but also whether the observations are above or below the actual outcome. The advantage of using Wilcoxon Sign Rank Test instead of a usual t-test is that the quantitative material does not
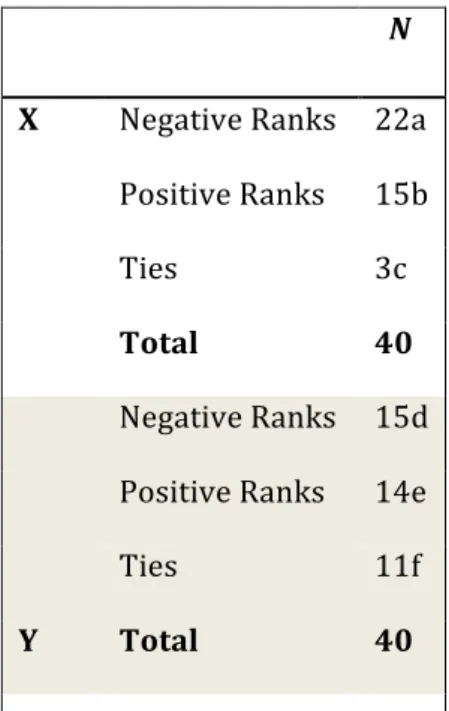
have to be normally distributed; there is no evidence that our retrieved data should be distributed, hence the Wilcoxon Sign Rank Test provides the thesis with a relevant statistical base. (Körner & Wahlgren, 2005). The test was conducted by using the computer program SPSS, a well-established program in the field of statistics. The test computes observed results into p-values, which are the basis for whether the zero hypotheses can be accepted or rejected. Table 3.1 is an example of a shortened version of the tables in this paper, see appendix 2-9. The table illustrates the comparison between actual and forecasted earnings of 40 different companies over a two-year period. By examining negative and positive ranks we are also given information about the dispersion regarding if analysts forecasts are over or under the actual outcomes. If we for example look at year X, 22 forecasts estimated under the actual outcome and 15 projections were over the actual outcome. The table shows that there are three possible outcomes left of total 40 observations. These three were ties, i.e. the forecast and outcome is consistent to 100 percent.
Table 3:1 Example of test dispersion
In Table 3.2 the p-values are calculated. If the p-values are lower than our chosen significance level, we can statistically ensure that there is a difference between forecast and actual earnings, which means that the zero hypothesis is rejected. The asterisks explain how strong indication there are; more asterisks indicate a higher probability (Körner & Wahlgren, 2005).
N
X Negative Ranks 22a
Positive Ranks 15b
Ties 3c
Total 40
Negative Ranks 15d
Positive Ranks 14e
Ties 11f
Y Total 40
N= Number of observa.ons
Negative ranks: Forecast < Actual outcome Positive ranks: Forecast > Actual outcome
Table 3:2 Example of P-values and significance levels Year U V X Y Z P-value ,673 ,387 ,099* ,049** ,009*** *** = Significance <1 percent **= Significance < 5 percent *=Significance <10 percent
The Wilcoxon Sing Rank Test, as mentioned earlier, made it possible to calculate if forecasts were over- or understated in relation to actual earnings. We take the number of forecasts that were above expectations divided by the total number of observations in the test which gives us an indication of the percentage of analysts tend to be positive in comparison to actual outcome. Analogously, we do the same with the forecasts below expectations. This has contributed another dimension to our essay and from these calculations we can derive differences in analysts dispersion and allows us to acquire greater understanding of drivers regarding forecast accuracy.
4. Empirics and Analysis
This chapter presents the empirical results from the interviews and the quantitative study then a subsequent analysis regarding the investigated areas.
4.1 Forecast accuracy
In this chapter, we begin by presenting our results, in order to make an analysis with help of theories. We will pervade intrinsic and extrinsic factors that affect analysts forecasts and thereby exemplify to the reader, which factors that impacts forecasts. We chose to apply different theories on investigated areas in order to clarify if differences have occurred. We are aware of that any theory could be applied to give a detailed explanation of how; if possible, analysts could construct reliable forecasts. The presentation will commence with an overview of the investigated areas thus, give the reader an overview of our results. To add more reliability and value to the essay our interviews will complement our empirical result, by evaluating analysts’ answer with theories we aim to bring further understanding and knowledge to the reader.
• Our statistical test will answer the question; if forecast accuracy has improved since IFRS was implemented. The interview segment is aimed to answer the question why forecast accuracy has or has not improved.
4.2 Earnings forecast compared to actual results for all surveyed entities during year 2000-2005
Table 4.3 shows the results for all surveyed companies during year 2000 - 2005. For the years 2001, 2002, 2003 and 2004, the p-values were lower than 10 percent. P-values lower than 10 percent confirms that analysts, to a large extent, produced inaccurate forecasts. There is a strong indication during 2000 and 2003 and a weaker indication in 2002 and 2004. During 2000, analyst´s prognoses were accurate to 67 percent probability in relation to actual outcome.
43% 57% 0%
Forecast accuracy 2000 -‐ 2005
Forecast < outcome Forecast > outcome Forecast = outcomeTable 4.3 Earnings forecast compared with actual outcomes
Year 2000 2001 2002 2003 2004 2005 P-‐value ,672 ,051* ,097* ,001*** ,060* ,340 ***= Significance <1percent **= Significance < 5 percent *=Significance <10 percent
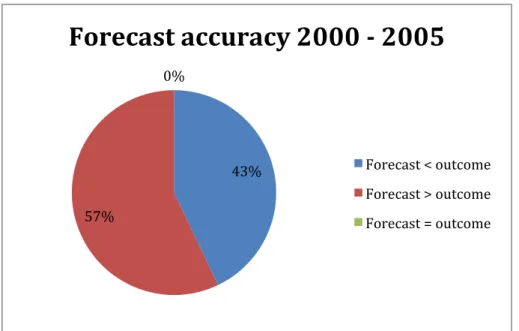
To give further explanations how forecasts were dispersed, we constructed circle diagrams, which displays how analysts forecasts were divided between overly confident and sub confident in relation to the actual outcomes. In the first six investigated years, 2000-2005, or the pre-IFRS adoption period 57 percent or 137 out of 240 forecasts were above the actual outcomes. This stands in relation to 43 percent or 103 forecasts, which were below actual outcomes. (Diagram 4:3)
Diagram 4.3 – Dispersion of forecasts during 2000-‐2005
4.3 Earnings forecast compared to actual results for all surveyed entities during year 2006-2010
Table 4:4 shows the result of earnings forecasts compared to actual results for all 40 companies, for the years 2006 – 2010. During 2006 68 percent of the forecasts were within the level of significance and thus, should be seen as quite accurate. But during 2009 and 2010 we found clear differences between analysts forecast and the companies’ actual earnings.
54% 46% 0%
Forecast accuracy 2006 -‐ 2010
Forecast < outcome Forecast > outcome Forecast = outcomeTable 4.4 Earnings forecast compared with actual outcomes
Year 2006 2007 2008 2009 2010 P-‐value ,677 ,129 ,181 ,001*** ,003*** ***= Significance <1percent **= Significance < 5 percent *=Significance <10 percent
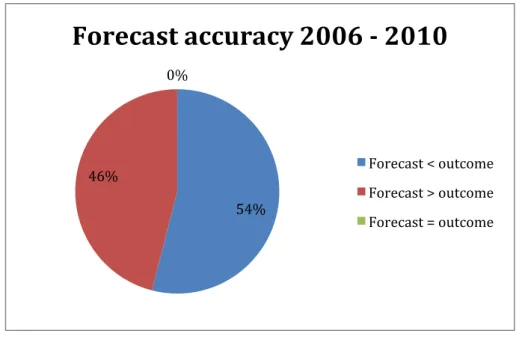
Diagram 4.4 shows that analysts in general were more pessimistic in their forecast projections during 2006 – 2010. 46 percent or 92 forecast out of the 200 observations were made in an overly confident way. Respectively, 54 percent or a total of 108 forecast were below the investigated companies actual outcomes.
Diagram 4.4 – Dispersion of forecasts during 2006-‐2010
4.3.1 Analysis of all investigated companies during 2000-2010
When we investigate the outcomes from the empirical test, we found interesting facts during year 2000-2005. Firstly, four of the years before IFRS was implemented analysts tended to produce forecasts that were less accurate than after the implementation of IFRS. Before IFRS were introduced to the market, Swedish companies used historical cost, and therefore not “affected” by the crisis that occurred in 2001 as today’s ongoing crises does. Since no
revaluations of assets were allowed, their balance sheets were not as volatile as it could appear today. An exception to this statement could be retained earnings, where accumulated earnings are gathered. Earnings tended to be less volatile due to the opportunity to use earnings management with help of provisions and unrealized gains. Profits are affected to equal degrees, but when the balance sheet is more positively displayed, analysts tend to produce optimistic forecasts, where 57 percent were above the actual outcome. Analysts forecast is related to a delay compared to actual earnings but during these years analyst struggled with their accuracy not the pattern. Could it be possible that the balance sheet remained bloated? Was it more difficult for analysts to produce credible forecasts prior to the implementation of IFRS? Our empirical test suggests that this might be the fact, but for further information, see section (4.7)
There are examples where companies report a constant growth in earnings, which could reflect in an expansion where liquidity and growth are increasing at the same rate, assuming ceteris paribus. The reality is different where higher earnings necessary do not result in an increase in liquidity. In order to demonstrate the problem regarding earnings growth and cash flow, we are applying a fictitiously example which illustrates the complexity of the matter: Assume that Company A increased its turnover by 100 percent between 2004 and 2006; they also exhibit an increase in earnings with the same percentage. Assuming that organic growth is the reason, or economies of scale, evidence suggests that the cash flow will increase in a similar fashion. However, expansion due to a company´s desire to retain a larger percentage of the market, at the expense of, e.g. reduced profit margins, is an assessment problem for analysts. Analysts believe that this growth will increase company A’s earnings but as the example demonstrates it might end up in an opposite way. If you combine this with an increase in accounts receivable it will result in a cash flow that is worse than before the expansion.
The example above results in two different cash flows, which should generate two different forecasts. A change in earnings does not always reflect a positive cash flow if a company find it difficult to convert sales into cash. What an analyst should take into consideration, in order to provide a reliable forecast, is therefore earnings versus the actual inflow of cash.
– 2010 can be derived. Firstly, if changes in accounting policies are to affect the analysts forecast in a negative way we should detect a decrease in forecast accuracy in the years following the post – adoption period. However, no such findings were made in our investigation, instead, 2009 and 2010 were the years where we could conclude that there was a significant difference between analysts forecasts and earnings outcome. These findings appear quite contradictory in regards to Elliot and Phillbrick (1990) research, which showed that analysts had most trouble constructing forecast after a change in accounting methods. This could either mean that analysts were ready for a change towards IFRS and had no apparent problem interpreting the new information. Another way of arguing is that, analysts are basing their forecasts on other factors than financial statements and therefore had no problem adapting to the new accounting method during the transition period. However, analyst accuracy has increased during the post – adoption period could this mean that the implementations of IFRS has increased the value of financial statements for analysts?
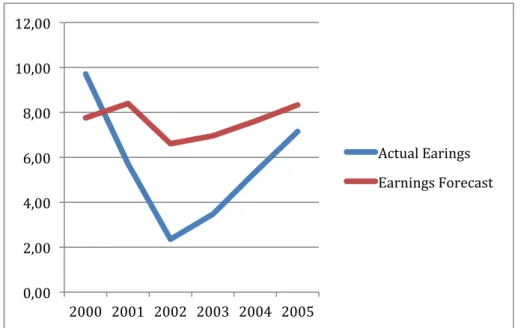
It should be remembered that our investigated time period stretches over two different financial crises, the first one took place in 2001 were the so called “IT bubble” burst. The other one started in the fourth quarter of 2007 and is still affecting companies’ earnings. If we look at figure 4.2 we can derive that analysts reacted slowly when the second crises struck against the financial markets. Research, which has been conducted by De Bondt and Forbes (1999) concluded that analysts were in general overly optimistic when producing their forecast. The figure showcases how analysts did not appreciate the severity of the financial situation which corporations were facing and were not able to predict the sudden downfall in profitability. Amir and Ganzach (1998) argue that analysts use, among other things, reference points when constructing their forecasts. The scenario that occurred were that analysts are under reacting which could mean that they struggle adapting to the new situation. Figure 4.2 demonstrates that analysts tended not to react to companies decreasing profitability; instead the “gap” between forecasts and actual earnings grew, leaving the forecast inaccurate. However, in 2009 analysts started to construct more conservative forecast at the same time companies profits increased. Even if this was the case, analysts did not seem to adapt to the new circumstance in 2010 as they were producing forecasts that were even lower than the prior year while companies’ profits still increased. This led to forecasts missing their target to a degree were we could conclude that, forecast made in 2009 and 2010 were significantly different than the actual outcomes.
0,00 2,00 4,00 6,00 8,00 10,00 12,00 2006 2007 2008 2009 2010 Actual Earinngs Earnings Forecast 0,00 2,00 4,00 6,00 8,00 10,00 12,00 2000 2001 2002 2003 2004 2005 Actual Earings Earnings Forecast
There is also a rather interesting discrepancy regarding how aggressive analysts were when constructing their forecast between the periods 2000 – 2005 (figure 4.1) and 2006 – 2010 (figure 4.2). While analysts were overly aggressive in the first period they were too careful in the second period. If this fact is due to the implementation of IFRS, or if it is linked to other factors, e.g. macro economic factors cannot be deducted from only looking at this survey. However, we aim to investigate this further in our interview segment.
Figure 4.1 Overview of 2000-‐2005 of earnings forecasts and earnings per share in SEK