A Review of Lean-Kanban Approaches in the Software Development
ERIKA CORONA and FILIPPO EROS PANI
DIEE, Department of Electrical and Electronic Engineering
University of Cagliari
Piazza d’Armi, 09123 Cagliari
ITALY
[email protected]
[email protected]
Abstract: - We present a review on the state-of-the-art of the adoption of a specific Agile Methodology (AM), the Lean-Kanban, in different software development contexts. Such approach requires to break down the software development process into smaller steps, which are implemented with the aid of a Kanban board. We study 14 different Kanban boards and we also examined how features are represented in the boards and compared 22 software tools for implementing virtual Kanban boards, analyzing also resources available on the web. We analyzed the main features of the Kanban boards actually used, the main activities defining the software development process, the content of the cards representing work units, and also the automation tools available for Kanban board management. Our survey shows that nor standard definitions of Kanban practices exist for the software development, neither specific practices for the Kanban board management have been rigorously defined, and thus Lean development standardization and improvement is still an unaccomplished task for software development.
Key-Words: - Kanban, Lean, software development, agile methodologies
1 Introduction
Agile Methodologies is a name referring to a set of practices and processes for software development that have been created by experienced practitioners. The principles AMs refer to were written in 2001 in the “Agile Manifesto” [1]. Traditional software engineering is said to advocate extensive planning, up-front analysis and design, like design patterns and micro-patterns [2], refactoring [3], metrics evaluation [4]. It also uses codified processes to make development an efficient and predictable activity and/or to improve software quality [5], like reducing the number of software defects [5]. By contrast, AMs address the challenge of an unpredictable world by relying on ‘‘people and their creativity rather than on processes” [7].
The main goal of AMs is to increase the ability to react and respond to changing customer, business and technological needs at all organizational levels [8]. Several companies are moving to agile software development to improve quality and productivity, and to reduce delivery times. In contrast to traditional software development processes, where work is typically broken down into a series of sequential steps, agile methods rely on short, iterative cycles and close collaboration between the customers and the development team [9].
Dynamic Systems Development Method (DSDM) [10], introduced since the beginning of 1995 was the first agile method, followed by Scrum [11],
introduced at OOPSLA in the same year, and extreme programming (XP) [12]. In 1998, the word ‘‘agile” was used in combination with ‘‘software process” for the first time [13]. Several further methods followed, including the Crystal family of methods [14], Feature-Driven Development [15], Lean Development [16] and Adaptive Software Development [17]. In 2004, a new version of XP appeared [18].
Very recently, it seems that the application to software of Lean approach and its concepts and practices is becoming increasingly popular.
As reported in the book “The Art of the software Development” by Hibbs C., Jewett S. and Sullivan M. [19], it is only recently that the Lean principles have been applied to software development. In the beginning it all started with Lean manufacturing. James Womack, Daniel Jones, and Daniel Roos coined the term “Lean” in their 1990 book, “The Machine That Changed the World” [20].
Lean strives to deliver value to the customer more efficiently by finding and eliminating waste (the impediments to productivity and quality). This is expressed in a set of principles that include optimizing flow, increasing efficiency, decreasing waste, improving learning, and using empirical methods to take decisions.
In 2003, Mary and Tom Poppendieck published the first book about applying Lean principles to software development [16]. They identified seven
key lean principles: eliminate waste1, build quality in, create knowledge, defer commitment, deliver fast, respect people and optimize the whole.
Perhaps the most important Lean activity is to build a value stream map. This means to break down a process into individual steps, and identify which steps add value and which steps do not, thus adding to the waste (muda). The goal, then, is to eliminate the waste and improve the value-added steps (kaizen). An important lean tool helping to manage the work flow is the concept of pull system, which is usually visualized using a Kanban board. In general, we can define the Kanban software process as a WIP (Work In Process) limited pull system visualized by the Kanban board.
Recently, the Kanban approach applied to software development, seem to be one of the hottest topics of Lean. In the recent 3-4 years, Kanban has been applied to software process, and is becoming the key Lean practice in this field. A correct use of the Kanban board helps to minimize WIP, to highlight the constraints, and to coordinate the team work. However, Lean is more than Kanban, and more Lean practices should be used, together with Kanban, to take full advantage of the application of Lean to software development. Note that the Kanban board is very similar to the “information radiators” of Agile methodologies, but it is not the same thing.
Kanban systems are an approach to scheduling work. Kanban shares with typical AMs the fact that requirements are expressed in atomic features (also known as user stories, work items, Minimum Marketable Features, or MMF), to be implemented incrementally. To this purpose, AMs use time-boxed iterations. – at the beginning of the iteration, the team meets and chooses features from their backlog that can be done by the end of the iteration. Over the course of the iteration, they develop those stories, and at the end of the iteration, they ship them [19].
Kanban systems are different because they focus on a continuous flow of work, and disregard fixed iterations. When needed, the team chooses a subset of features from the backlog and moves them to the Kanban board. Then, it develops these features one after the other. Work is delivered as soon as it's ready, and the team only works on one – or very few – feature at a time.
The growing interest on Kanban software development is demonstrated by the publication of
1
Waste in software development: partially done work; extra processes; extra features; task switching; waiting; motion; defects [16].
various books, and by the proliferation of Web sites on the subject in the past couple of years.
In his recent book, David J. Anderson – perhaps the most prominent advocate of Kanban approach in software development – describes about how to apply Kanban concepts to systems and software development [21].
Corey Ladas, in his book Scrumban, writes about the fusion of Scrum and Kanban practices [22]. The author compares the Agile approach of fixed-length iterations and the Just-In-Time approach of Kanban system. He underlines the fact that the iteration length in agile methods is one of the artificial parameters which need to be defined. The switch to a Kanban system can actually render the whole iterative concept superfluous. The book in fact ends in advocating an approach much more similar to Kanban than Scrum, retaining good Scrum practices.
A third book on the subject is Kanban and Scrum making the most of both, by H. Kniberg and M. Skarin, also available on-line [23]. This book analyzes both approaches through practical charts and examples.
However, we stress that, despite the recent increase of interest on the subject, there is no standard definition of Kanban system for software development. Moreover, the specific practices of Kanban – how to specify a feature, which activities best represent the software process, how to represent tasks, how to deal with exceptions and emergencies, and so on – have not yet been rigorously defined [24].
The address this issue, the purpose of this work is the analysis of the available information – through Evidence-based software engineering techniques – to highlight and discuss the state-of the-art about how Kanban approach is presented and used.
The paper is organized as follows: in Section 2, we give an overview of Kanban approach; in Section 3 we present the methodology followed for the survey and the related research questions; Section 4 presents the results and answers the questions, eventually, Section 5 concludes the paper.
2 The Kanban Approach
2.1 Kanban axioms
As reported in the book “Scrumban, Essays on Kanban Systems for Lean Software Development” by Corey Ladas [22], the whole Lean/Kanban approach is based on two axioms.
The first is: “It is possible to divide the work into small value adding increments that can be independently scheduled”. As said before, these increments can be called features, user stories, work items, or MMF. From now on, we will use the term “feature”. This axiom is the same as in AMs, which in turn are always features-driven.
The second Ladas' axiom is “It is possible to develop any value-adding increment in a continuous flow from requirement to deployment”. Following this axiom, software development process can be decomposed in a sequence of well defined activities, to be performed one after the other by the members of a feature [25], [26], [27], [28] team on the specific features to be implemented. For instance, a requirement analysis phase is followed by a design phase, then by an implementation phase, by a testing phase, by an integration phase and eventually by a deployment phase. For the Kanban approach to work, we need that all features are processed by the same sequence of steps.
These axioms generally hold, except perhaps at the beginning of the development of a software system, when an up-front analysis and architectural design phase is needed (as for instance explicitly prescribed in FDD methodology). In the case of addition of functionalities to an already developed system, or of maintenance and bug-fixing activities, these axioms clearly hold.
2.2 Kanban Overview
Kanban – meaning "signboard" – is a concept related to lean and just in time (JIT) production. According to Taiichi Ohno, Kanban is one of the means through which JIT is achieved [29]. Kanban is not an inventory control system, but it can be considered as a system for visualizing work, making it flow, reducing waste, and maximizing customer value. It is a pull system, because it uses the rate of demand to control the rate of production, passing demand from the end customer up through the chain of customer-store processes.
In practice, setting up a Kanban system, also in the light of Ladas' axioms, typically includes the following steps
1. Map the flow, finding the activities 2. Express the requirements through a set of
features
3. Depending on the activities and the team composition, devise a maximum limit for the features under work in each activity
4. Set-up the Kanban board, highlighting the activities and how deal with specific issues, for instance:
Input queue, Slack buffers and “Done” buffers.
Task management within activities.
Multi-project management, through lanes or other means. High-priority features, special
cause circumstances in which it is allowed to break limits.
Management of bugs, and of features to rework before their release.
5. Devise the policy to assign developers to activities and tasks, and to deal with issues related to flow (blocks, tuning of limits, etc.);
6. Decide the format and typical scheduling of meetings, for instance:
Daily stand-up meeting.
Meetings with customer and product owner.
Planning meetings.
Review meetings, including process improvement meetings. 7. Devise how releases of single features,
and of working versions of the system, are delivered.
8. Devise the specific technical practices to use (design, programming, testing, etc.). 9. Decide what tools, statistical methods
and diagrams to use to manage the process.
As said before, there is no a standard, or at least a commonly shared way, to perform these tasks. The aim of the followings of this paper is to highlight the specific Kanban issues, in particular those related to the Kanban board management, and study how they are addressed in practice, through a survey.
3 Method
Evidence-based software engineering (EBSE) aims to apply an evidence-based approach to software engineering research and practice. This research follows Kitchenham’s methodological guide- lines for systematic reviews [30]. The research questions (RQs) of this review are the following:
Q1. What are the main characteristics of the Kanban boards actually used?
Q2. What are the main activities defining the software process, and what are their typical
limits to limit WIP (for a typical development team)?
Q3. What is the information typically shown on the cards representing the work units?
Q4. What diagrams/statistics are used for a quantitative process management?
Q5. What automation tools are available for Kanban board? And what are their main characteristics?
A systematic literature review (SLR) is the main method of synthesis for supporting EBSE. We performed a qualitative survey, covering both the literature and the main websites on the topic, with the aim to answer the research questions. Usually, surveys similar to the presented one are performed through an SLR of scientific papers that appeared in the literature on the subject [30]. The Kanban approach in software development, however, is still in its infancy, and there is almost no paper at present published in the scientific literature. Moreover, information about how a software development approach is applied inside an organization is often considered confidential, and it is not easy to obtain such information through interviews. consequently, our sources were the three books published on the subject so far [21], [22] and [23], and the documents available on the Web. In particular, we performed the Web survey starting from:
the Web sites of the well known organizations working on Kanban (Limited Wip Society [31], Lean Software and Systems Consortium), and the links found there;
the results of Web searches in the main search engines, with the keywords: “Lean”, “Kanban”, “software development”.
We used as information sources the documents and the presentations found on these Web sites and the relevant Web pages. The survey was conducted through the analysis of various Kanban Boards reported in figures and photos, together with the analysis of the related text. In the case of software tools implementing a Kanban board, we used as main reference the tool list present in the Limited Wip Society Web site. In this case, when the tool description found in its Web site was not enough, we resorted also to mails sent to the tool developers, that were answered in all cases but two. All data
obtained and analyzed are summarized in five Tables, one for each RQ, that are reported and discussed in section 4.
3.1
The issue studied
Despite its growing adoption, the Kanban system approach is still in its childhood and, as said before, there are no standard ways to address some key issues. In our opinion, the information gathered in our survey might be very useful to people considering Kanban adoption, and to the whole community of agile developers practicing Kanban system approach.
In the following of this section, we briefly discuss what are the issues we considered, and why. We will focus on describing the visual aspect of the Kanban board, its activities and the features. However, one must keep in mind that such a visual aspect always reflects the practices and the workflow organization decided by the team.
The Kanban board. The board is the main tool used to visualize and coordinate teamwork. Its columns show a sequence of activities, where the cards representing the features under work are put. For each activity, there are limits to the number of features, to obtain an overall limited WIP. The activities can be represented by a single column, or columns for in progress and done features can be present. An activity can also be preceded or followed by slack buffer columns, holding the features to be pulled into the next activity. The board may also have columns holding the features not yet under work, to be pulled into the first activity, and holding the features completed, or live. Other variants of the Kanban board include boards with horizontal lanes, representing different projects, with an emergency lane for urgent features, with zones holding cards representing bugs or open issues. The developers are often represented on the board, using their names or avatars, to highlight the features they are currently working on.
Feature representation and management. On the Kanban board, the features are typically represented using cards. The color of the card may have a meaning. The information written on the card is not standard. It may include the starting date, the due date, if present, the description of the feature, a priority level, the developer currently working on it, and other information.
When features represent a substantial amount of work, they can be divided in tasks, in turn represented by cards, usually smaller and/or of different color and attached to a specific zone of the column of the activity the feature is under work.
Also bugs, rework, acceptance tests related to a feature can be represented with cards.
When a feature gets stuck in an activity for some reason related to poor software quality, or undecided requirements, the work flow can be badly affected. The way this issue is resolved is often reflected in the feature representation – for instance it can be marked with two big red starts, meaning panic [23] – or in a zone on the board holding these features.
Statistics and diagrams. The use of statistics and diagrams to monitor the process is integral part of the Kanban approach. The quantities computed and monitored, however, may vary. They can be lead/cycle time, development time, engineering time, days blocked, number of bugs, throughput, and so on. These data are usually shown in diagrams, affixed to the walls of the workplace, or in any case continuously updated and made public. The most used diagram is the Cumulative Flow Diagram (CFD), used to show WIP and average lead time, and to highlight issues and bottlenecks.
Computer-aided tools. Unlike with original AMs, whose proponents advised against the use of tools, preferring face-to-face communication and tangible artifact such as cards, the Kanban system proponents explicitly suggest the use of automated tools to help keeping track of the process, and possibly to allow using the approach also in the case of not co-located teams [21]. In fact, despite the fact that Kanban is still in its early years of adoption, there are already many tools available to support the approach.
These tools can be open-source, proprietary and available as add-ons for existing tools. They are offered for local installation, and/or as-a-service on the Web. They allow to track all phases of the process, to organize the work using artificial Kanban boards, to monitor activities and highlight bottlenecks, and to automatically generate many kinds of useful diagrams and reports.
4 Result and Discussion
The first RQ regards the layout of the Kanban boards actually used by developers. We were able to collect data on 14 different boards, which are summarized in Table 1. The number of activities – or value-adding increments as in the second Ladas' axiom – ranges from one to six, with a median of 4 and an average of 3.7. So, the typical number of activities we found is four. All boards but one divide the columns of at least some activities in two areas – “in progress”, where the features under work are put, and “done”, where the features completed wait
to be pulled to the next activity. Most boards use also “slack buffers” before some activities.
Regarding the queue of the features to be implemented (Input queue), most boards have a limit on it, ranging from 2 to 10. The names given to this queue are very different, for each of the boards analyzed. On the contrary, most boards have no limit on the queue of features completed (Output queue). Also in this case, the names of the queue are very different from board to board, the most popular being “Done”.
6 boards on 14 have an “express lane” where urgent features are put, which can overcome the limits on the activities. This figure may look low, but remember that several of the studied boards are simplified boards, intended for didactic purposes. 5 boards have “lanes”, highlighting features belonging to different projects which are carried on concurrently by the team. Only three boards explicitly show activities divided in task. With this analysis we have answered Q1: What are the main characteristics of the Kanban boards actually used?
Let us now pass to Q2: What are the main activities defining the software process, and what are their typical limits to limit WIP (for a typical development team)? First, let us note that it is patent from the board analysis presented in Table 1 that the same concepts are named differently in the various boards. The same variability can be found in the names of the activities. So, we tried to put together the activities that look very similar, albeit having different names – for instance: “Development”, “Dev.”, “Code”, “Coding”. For each activity and for each Kanban board studied, we report in Table 2 the main characteristics (buffers and limit). From Table 2 it is also possible to deduce which activities are included in which board.
Some activities might refer to the same activity in different boards – for instance “Specification” and “Analyze”, “Build” and “Development”. However, there are boards where both activities are included, so we did not merge them in the table. Overall, there are the following broad categories of activities:
Specification/Analysis: this is typically the first activity. Its limits vary from 1 to 8, with an average of 3.7, a median equal to 3, and a mode equal to 2. Since the value 8 seems an outlier, the preferred limits to this activity are 2 and 3.
Build/Development: this is the activity referring to actually writing the code. Its limits vary from 2 to 10. The mean, median and mode of these limits are all equal to 4.
Test/Acceptance: these activities refer to writing and/or executing tests on the system. Their limits vary from 2 to 8, with an average of 3.2, a median equal to 3, and a mode equal to 2. Also in this case, the median and the mode look the most representative values.
Deploy/Release: this is the last typical activity when a system is developed. Only in four cases there are explicit limits, ranging from 4 to 6. The lack of limits is due to the fact that in some processes release is not really a full-scale activity, but it refers to the acceptance of the released features by the product owner, or other stakeholder.
Documentation: in two cases, this activity is explicitly recorded on the Kanban board. In one of these board, the limit is 2, while in the other it is not specified.
We stress that some Kanban boards, like for instance two described in the last rows of Tables 1 and 2, are in fact organized in multiple tiers, and the sequence of activities is not linear, but activities are part of higher-level tiers, in turn executed in sequence, or in other ways. However, we believe that Table 2 summarizes well how Kanban teams divide development into activities, and give hints on the possible choices of their limits. So, with Table 2 and its discussion we believe we answered Q2.
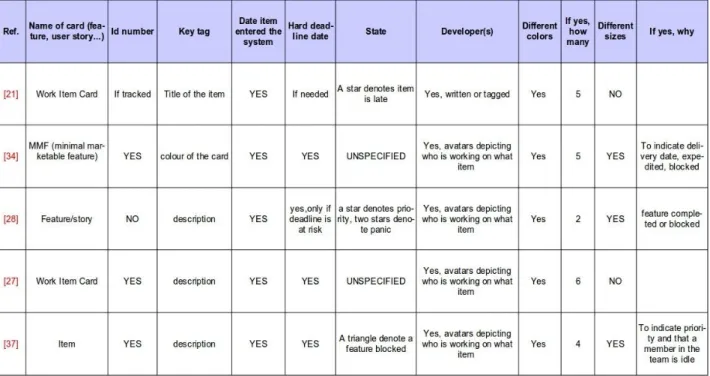
In Table 3 we report the result of the study
about how features are named and represented on cards in the Kanban board. We were able to get information only on five different boards, because in the other boards we considered, the cards were only sketched. All feature cards show a description of the feature, the date the feature entered the system, and are related with the developer in charge of it – often represented with another card, or a “stick avatar”. All examined boards make use of cards of different colors to highlight the kind of feature; some of them use also cards of different size, typically to discriminate between the features and the tasks obtained by decomposing the features, bugs, issues and the like.
Some cards use smaller sticker cards on them, to denote issues or their state., and some cards allow to show specific states of the feature, such as “high priority”, “late” or “blocked”. With this analysis we answered Q3: What is the information typically shown on the cards representing the work units?
Let us now pass to Q4: What diagrams/statistics are used for a quantitative
process management? For each Kanban
implementation studied we figured out what kind of quantitative tools were used by the associated team. This analysis is not simple, because in many presentations the main goal was to describe the Kanban approach and the board, with minimal or
Table 5 Comparative analysis of kanban tool
Name License and Pricing Product Information Integration Reporting Data Import / Export Ref.
AgileZen Yes No Yes [42]
Digaboard GNU GPL2. Unspecified Yes Unspecified No Yes Unspecified [43]
flow Yes No Yes [44]
Yes No Yes [45]
Hansoft Yes Yes [46]
Yes In progress. Yes [47]
Kanban Tool None Yes Yes Yes [48]
Kanbanery Yes No Yes Simple CSV import of data. [49]
Yes Yes Yes [50]
Yes No [51]
Qanban Apache V2. None Yes No Yes [52]
RadTrack MIT license. In progress Yes Unspecified. No Yes In progress. [53]
Yes No Yes [54]
GNU GPL2. Yes In progress. Yes Unspecified. [55]
Yes
No Yes [56]
MIT license. Unspecified No Unspecified. No No Unspecified [57]
SmartQ In progress.
No
In progress. No Yes In progress. [58]
Yes No Yes [59]
Trichord Yes No Yes Not supported. [60]
VersionOne Yes Yes Yes [61]
Visual WIP Yes Yes Yes [62]
Multi team Horizontal lanes Bug Mngmt Proprietary. Available for a monthly cost.
Web application built with ASP.NET MVC 2 and jQuery. AgileZen has been acquired by Rally Software (April 2010).
API under development, so that customers can create their own integrations.
Cycle time and lead time metrics on the Performance screen.
Data export using the API in XML or JSON format.
Web based interactive tool. It requires PHP and MySQL. Proprietary. Available
for a monthly cost.
Lean project management application based on Kanban. PHP / MySQL for the backend and JavaScript libraries for the frontend.
Simple yet powerful REST API that makes it easy to integrate flow with other applications. An interactive testing console is included.
Custom reports: - tasks assigned to a group or groups; - tasks assigned to individual users; - task types.
Data export and import using the REST API.
FogBugz plus Kanban plugin Proprietary. Pricing determined by user nr. Available in-house or SaS.
This plugin provides a Kanban board for FogBugz (a web-based project-management tool). There are both PHP and ASP versions. Data on MySQL, MS Access or MS SQL Server.
Completely extensible with plug-ins and an XML API; it integrates with all major version control systems.
The cases in any of existing filters can be produced as graphical reports.
Data export and import using the REST API. Import from Bugzilla and Trac.
Proprietary. Available for a monthly fee based on the nr. of users.
Requirements: for Hansoft client, Win200 or later (also runs under Wine on Linux and MacOSX), for Hansoft server, Win200 or later NT based operating system.
Integrated with Hansoft server; LDAP integration for resources.
Dynamic report templates in the find function.
Yes, as configured
Project plans, schedules and task lists can be easily imported. Jira 4.0 plus Greenhopper plugin JIRA commercial / academic license. Sw. licenses entitle to perpetual use.
JIRA is a system for issue tracking and project management. GreenHopper is a pure Java application.
Developers interact with JIRA directly from Eclipse and IntelliJ IDEA and soon MS Visual Studio. Third-party integrations support FlexBuilder, JDeveloper, NetBeans and Zend Studio.
Ccustom statistics for a project. Generate reports on the fly using JIRA Query Language (JQL).
Importing data from other trackers is supported. Third-party scripts are available that support the importing of data into JIRA.
Proprietary. Still in beta phase presently free of charge.
Web application written mostly in Ruby (server-side) and JavaScript (client-side).
Breakdown charts and cumulative flow diagram. Usage reports.
Details about tasks can be exported to CSV file. Other features in progress. Proprietary. Pricing
plans: Freelance, Small firm, Corporate.
Project board tool for Scrum and Kanban teams or for personal task management. Built with Ruby-on-Rails.
API available for system integration.
CFD filtered by dates and process stepsTask history a, arage lead time and cycle time f statistics.
LeanKit Kanban
Proprietary. Pricing plans: Team-edition, On site, Personal edition.
Online workflow and process management system written in Ruby.
API available for system integration.
Tools to analyize (and extract) the information about how work is moving through the processes.
Wizard available to export and import Work Items from external systems.
Pivotal Tracker
Proprietary. At the moment, online use is free.acker@pivotallabs. com)
Story-based project planning tool. It is written in Ruby on Rails and Javascript.
Integrated with JIRA, Lighthouse, Satisfaction, Zendesk. Integrated with SCMS: Subversion, GitHub, and Git. API available for integration with other systems.
Several built-in charts: release burn-down, iteration burn-up, story type breakdown, historical velocity. Stories can be categoriz ed as bugs.
Stories can be imported from other tools, or exported to a CSV file.
Web-based multiuser application written in Grails. It uses HSQLDB (HyperSQL Database) for dats storage.
"Lead Time” statistics, but no official release.
No pre-defined way to import/export data.
radtrack™ is a Open Source Electronic Kanban collaboration system written in Ruby-on-Rails. Rally 2009.5 plus Kanban Mashup Proprietary. Pricing plans: Community, Enterprise and Unlimited edition.
Web application cross-platform and cross-database. Rally provides versioned Web Services APIs for REST, SOAP and JSON.
IDE’s: Eclipse, JDeveloper, Visual Studio Enterprise Integrations for HP, IBM, Microsoft & Salesforce.com. Customizable Integration API.
Custom reports with BI capability. Reports generated in PDF and JPG.
Import using CSV files. Export capabilities CSV or XML files.
Redmine plus Kanban plugin
Redmine is a project management web application, written using Ruby on Rails.
Integrated with several SCMS, including Subversion and Git.
Redmine's report generation capability.
Silver Catalyst
Proprietary. Pricing plans: Hosted and Onsite edition.
Silver Catalyst uses many different languages and platforms, but the whole software is based on an open source stack.
API available for integration withbug tracking tools SCMS continuous integration ,LDAP directories .
Statistical Process Control Charts are used to analyze lead time, cycle time and throughput.
Automatic import of tickets from a ticket tracking system.
Simple Kanban
The application is just a HTML file.
Proprietary.Available for a monthly cost.
Web-based visual project board for tracking tickets. Technologies: PHP, jQuery, MySQL, CentOS. Target Process Proprietary. On-Site licenses entitle perpetual use. On-Demand licenses are on a monthly basis.
Software written in .NET. Can be hosted locally or used as SaS.
Built-in plugins framework and Web Services API for system integration. Available plugins for Visual Studio 2010, Eclipse, Subversion, JIRA, Bugzilla, Perforce, Selenium, NUnit, JUnit, TestTrackPro, Team Foundation Server and Help Desk.
A wide range of reporting features.
Import/Export from/to CSV format for bugs, features, user stories and test cases.
Proprietary. Pricing plans: User license (user-fixe, unlimited); Timed license (machine-fixed, limited operation period. Trichord is an Eclipse RCP (Rich Client Platform)-based software, and optionally works with Trac (issue tracking system). System requirements: Windows XP, Windows 7.
Trichord has an ability to integrate with Trac.
Charts with detailed information of each project, and a summary that indicates the status of multiple projects.
Proprietary. Pricing plans: Team, Enterprise and Ultimate.
VersionOne is a project management too, built on Microsoft technology. The On-Demand version is used as SAS; the On-Site version requires MS Windows Server 2003/2008 and IIS.
An extensible API and SDK (.NET & Java). Pre-built integration connectors to the most commonly used commercial and Open Source sw. development tools.
50+ pre-packaged agile metrics and reports plus a new custom analytics platform. A Data Mart optimized for agile reporting & analytics.
Import from MS Excel or export to MS Excel or Project.
Microsoft Public License (Ms-PL)
A visualization tool of WIP data from an underlying system (currently Team Foundation Server). Visual WIP is built on the .NET Framework 4.0, and requires Visual Studio Team Explorer 2010.
Currently Team Foundation Server is the only supported underlying system.
Reporting functionality of the underlying system.
Supported by the underlying system
no emphasis on these tools. Overall, we were able to find information only in seven sources, on overall 14 considered. Table 4 shows the diagrams and the statistics used by the analyzed Kanban implementations.
As you can see, all authors use the Cumulative Flow Diagram, which is one of the distinctive characteristics of the Kanban approach, and the Lead time per feature statistics. Some authors use the diagram showing the throughput of the development process, that is the number of features (weighted with the needed effort) completed per week or per month). Other statistics are used, but are less spread, as reported in the table. This answers Q4.
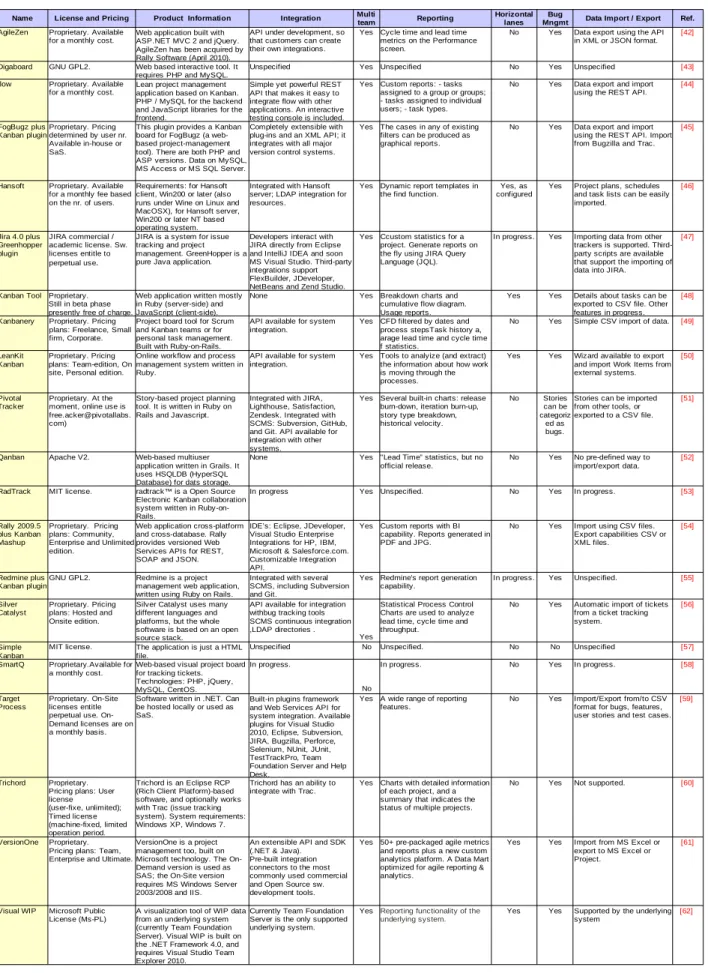
The last part of our survey is about automated tools supporting the Kanban board. Its results are reported in Table 5. The first thing to note is that, despite the short time Kanban have been around for software development, we were able to find and examine 22 tools supporting it. This may be due to the fact that the approach looks sound and in strong expansion, and may be that small firms bet on it, trying to be first-movers in this new market.
The tools belong to two basic categories: tools developed as stand-alone applications, and add-ons for existing project management tools or IDEs (about one-third of the total). Most tools have a Web-based user interface, and can be bought also as a Service on the Internet. Six tools are open-source project, with GPL2, MIT, Apache or MS-PL licenses. All tools, but a very simple one, support Multi-team projects and explicit bug management; only five tools on 22 support horizontal lanes.
Table 5 shows also the kinds of diagrams and statistics provided by the various tools. Most tools provide some sort of statistics, but only a small subset of tools provide a wide choice of diagrams. Surprisingly, the Cumulative Flow Diagram (CFD), which is cited in almost every publication about the Kanban approach, seems to be provided only by very few tools. Also the capabilities of integration with other tools, both though software interfaces and data exchange, vary greatly. Most tools provide simple forms of integration and data exchange, through proprietary APIs and standard exchange formats like Comma Separated Values. Only the most sophisticated tool, or those built as add-ons of already existing sophisticated tools, provide really independent and modular ways to integrate them with other tools, using Web services or a significant number of interfaces to other popular tools.
With this analysis we answered Q5: What automation tools are available for Kanban board? And what are their main characteristics? We also believe we shown the most comprehensive comparison of Kanban tools available to date.
4
Conclusions
Agile development methodologies have gained significant adop-tion in a variety of software development domains. Nowadays, the fastest growing AM is perhaps the Lean approach, using the Kanban board for its practical implementation. However, despite the strong increase of interest on Lean-Kanban, there is no standard definition of Kanban system for software development, and the
Diagram Nr. times used
Reference
CFD 7 [20], [22], [24], [33], [35], [39]
Lead time /cycle time per feature 7 [20], [22], [24], [33], [35], [39], [40] Development time 1 [33] Engineering time 1 [33] Days blocked 2 [20], [33] Nr. of bugs 2 [20], [33] Throughput 4 [20], [24], [33], [39]
specific practices of Kanban have not yet been rigorously defined. To address this issue, in this work, we presented a rigorous analysis of the available information, through research questions and answers, to show the state-of the-art about how Lean-Kanban approach is presented and used. In particular, we formulated and answered five research questions related to the Kanban board management, the use of diagrams and statistical tools, and the availability and features of computer aided tools for managing a “virtual” Kanban board. We used the methods of Evidence-based software engineering, performing a systematic review of the available information.
We examined 14 different Kanban boards, looking for similarities and differences in the board layout, and in the activities used for decomposing the software development work. We also analyzed how work items, or features, are graphically represented in cards on the boards, and which graphical and statistical tools are typically used by Lean-Kanban teams. Eventually, we studied and compared 22 software tools for managing virtual Kanban boards.
The results from this review can help both insiders’ and outsiders’ perception and understanding of how the Lean-Kanban approach is actually implemented. This information, derived from literature and Web site analysis has the potential to suggest possible directions for Lean development standardization and improvement, and to be useful to people considering Kanban adoption.
References:
[1] Manifesto for Agile Software Development,
www.agilemanifesto.org/
[2] An analysis of anti-micro-patterns effects on fault-proneness in large Java systems Destefanis, G., Tonelli, R ., Concas, G., Marchesi, M. , 2012 Proceedings of the ACM Symposium on Applied Computing , pp. 1251-1253.
[3] Refactoring and its relationship with fan-in and fan-out: An empirical study Murgia, A., Tonelli, R., Marchesi, M., Concas, G., Counsell, S., McFall, J., Swift, S. 2012 Proceedings of the European Conference on Software Maintenance and Reengineering, CSMR , art. no. 6178854 , pp. 63-72
[4] Assessing traditional and new metrics for
object-oriented systems Concas, G., Marchesi, M., Murgia, A., Pinna, S., Tonelli, R. 2010 Proceedings - International Conference on Software Engineering , pp. 24-31
[5] Entropy of the degree distribution and object-oriented software quality Turnu, I., Marchesi, M., Tonelli, R. , 2012 3rd International Workshop on Emerging Trends in Software Metrics, WETSoM 2012 - Proceedings , art. no. 6226997 , pp. 77-82
[6] On the distribution of bugs in the Eclipse system Concas, G., Marchesi, M., Murgia, A., Tonelli, R., Turnu, I. 2011, IEEE Transactions on Software Engineering 37 (6) , art. no. 5928349 , pp. 872-877
[7] Dyba T., Dingsøyr T.: Empirical studies of agile software development: A systematic review. Information and Software Technology, vol. 50, nos. 9/10, pp. 833-859, 2008
[8] Abrahamsson P., Warsta J., Siponen M.T. And Ronkainen J.: New Directions on Agile Methods: A Comparative Analysis. In: Proceedings of the International Conference on Software Engineering, Portland, Oregon, USA, 2003
[9] An empirical study of software metrics for assessing the phases of an agile project Concas, G., Marchesi, M., Destefanis, G., Tonelli, R. 2012, International Journal of Software Engineering and Knowledge Engineering 22 , pp. 525-548.
[10] Stapleton J.: DSDM: Business Focused Development, second ed.Pearson Education, 2003
[11] Schwaber K., Beedle M.: Agile Software Development with Scrum,.Prentice Hall, Upper Saddle River, 2001
[12] Beck K.: Extreme Programming Explained: Embrace Change. Addison-Wesley, 2000 [13] Aoyama M.: Web-based agile software
development, IEEE Software 15 (6),1998 [14] Cockburn A.: Crystal Clear: A
Human-Powered Methodology for Small Teams. Addison-Wesley, 2004
[15] Palmer S.R, Felsing J.M.: A Practical Guide to Feature-driven Development. Prentice Hall, Upper Saddle River,2002
[16] Poppendieck M. and Poppendieck T.: Lean software development: An agile toolkit. Boston, Massachusetts, USA: Addison Wesley, 2003
[17] .J. A. Highsmith III:Adaptive Software Development, Dorset House, New York, NY, 1999
[18] .Beck K.: Extreme Programming Explained: Embrace Change, second ed., Addison-Wesley, 2004
[19] Hibbs C., Jewett S. and Sullivan M: The Art of the software Development. Sebastopol, CA: O'Reilly, 2009
[20] Jones D., Roos D.:The machine that Changed the World, James Womack, Simon&Shuster, 1990
[21] Anderson D.J.: Kanban: Successful Evolutionary Change for Your Technology Business, Blue Hole Press, 2010
[22] Ladas C.: Scrumban. Seattle, WA, USA: Modus Cooperandi Press, 2008
[23] Kniberg H. and Skarin M.: Kanban and Scrum making the most of both, C4Media Inc, 2010 [24] A comparative study of scrum and kanban
approaches on a real case study using simulation Anderson, D.J., Concas, G., Lunesu, M.I., Marchesi, M., Zhang, H. 2012 Lecture Notes in Business Information Processing 111 LNBIP , pp. 123-137.
[25] Lean Software Engineering, leansoftwareengineering.com
[26] Los Techies, www.lostechies.com/
[27] Agile consulting,
agileconsulting.blogspot.com/ [28] Get Agile With Crisp, www.crisp.se/
[29] Ohno T.: Just-In-Time for Today and Tomorrow, Productivity Press, 1988
[30] Kitchenham, B., and Charters, S. (2007). Guidelines for performing Systematic Literature Reviews in Software Engineering. Engineering 2, 2007–01. Available online at:
www.dur.ac.uk/ebse/resources/Systematic-reviews-5-8.pdf
[31] Limited WIP Society,
www.limitedwipsociety.org
[32] Anderson D.: Kanban Primer, Better Software, January/February 2009
[33] The Ninja Ferret, ninjaferret.co.uk/
[34] Systems Thinking, Lean and Kanban, leanandkanban.wordpress.com/
[35] Software Project Management, blog.brodzinski.com/
[36] Agile Product Design,
www.agileproductdesign.com/
[37] Sundén J., Hammarberg M., Achouiantz C.:
www.slideshare.net/marcusoftnet/kanbanboard s
[38] Mattias Skarin's Blog,
blog.crisp.se/mattiasskarin/2010/12/03/129136 1993216.html
[39] Erik Willeke' Blog,
manicprogrammer.com/cs/blogs/willeke/ [40] Avail Agility, availagility.co.uk/
[41] The Art of AgileSM, jamesshore.com/ [42] AgileZen, www.agilezen.com/
[43] Digaboard, www.digaboard.net/ [44] flow, flow.io/
[45] Fog Creek Software, www.fogcreek.com/ [46] Hansoft, www.hansoft.se/
[47] Atlassian, www.atlassian.com/ [48] KanbanTool. kanbantool.com/ [49] Kanbanery, kanbanery.com/
[50] LeanKit Kanban, leankitkanban.com/ [51] Pivotal Tracker, www.pivotaltracker.com
[52] Qanban,
https://github.com/qbranchcode/Qanban
[53] radtrack, radtrack.com/
[54] Rally 2009.5 plus Kanban Mashup,
www.rallydev.com/agile_products/lifecycle_m anagement/
[55] Redmine plus Kanban plugin,
https://projects.littlestreamsoftware.com/projec ts/redmine-kanban
[56] Silver Catalyst, www.toolsforagile.com
[58] smartQ, www.getsmartq.com/
[59] TargetProcess, www.targetprocess.com/
[60] Trichord, trichord.change-vision.com/
[61] VersionOne, www.versionone.com/