Deficient Data Classification with Fuzzy Learning
By
Shigang Liu
M.Sc.
Submitted in fulfilment of the requirements for the degree of
Doctor of Philosophy
Deakin
University
I dedicate this thesis to my parents. A special feeling of
gratitude to my loving wife, Denise Xiaosong Men, for her
Table of Contents
Table of Contents v
List of Tables ix
List of Figures x
Acknowledgements xiii
List of Publications xiv
Abstract xvii
1 Introduction 1
1.1 Background . . . 1
1.2 Motivation and Research Issues . . . 3
1.3 Overview of the Work and its Contribution . . . 6
1.4 Organization of the Thesis . . . 7
2 Literature Review 9 2.1 Class Imbalance . . . 9 2.1.1 Resampling Approaches . . . 13 2.1.2 Cost-sensitive Approaches . . . 21 2.1.3 Ensemble Approaches . . . 23 2.1.4 Other Approaches . . . 27 2.2 Missing Values . . . 28
2.3 Related Work for Two Problems . . . 31
3 Problem Investigation 33 3.1 Datasets . . . 33
3.2 Selected Methods for Class Imbalance and Missing Values . . . 35
3.3 Classification Algorithms . . . 36
3.4 Performance Measure . . . 37
3.5 Experiment Results . . . 38
3.5.1 Imbalanced Data with Missing Values . . . 40
3.5.2 Imbalanced Data with Missing Values Recovered . . . 40
3.6 Conclusion . . . 42
4 Fuzzy-based Information Decomposition for Incomplete and Imbalanced Data 43 4.1 Introduction . . . 43
4.1.1 Motivation . . . 44
4.1.2 Contribution . . . 45
4.2 Proposed Method . . . 45
4.2.1 Information Decomposition . . . 46
4.2.2 FID-Based Data Repairing . . . 51
4.2.3 An Example for Illustration . . . 52
4.3 Theoretical Analysis . . . 56
4.3.1 Range of Generated Data . . . 56
4.3.2 Distribution-based Case Study . . . 57
4.4 Performance Evaluation . . . 61
4.4.1 Datasets . . . 62
4.4.2 Evaluation Measures . . . 62
4.4.3 Setting of Experiments . . . 63
4.5 Results Discussion . . . 67
4.5.1 Results Discussion for Imbalanced Data . . . 67
4.5.2 Results Discussion for Imbalanced Data With Missing Values . . . 69
4.5.3 Detailed AUC Results for Imbalanced Data With Missing Values . . 73
4.5.4 Statistical Tests for Performance Comparison . . . 74
4.5.5 Impact of IR and Percentage of MV . . . 77
4.5.6 Remarks . . . 78
4.6 Conclusions and Future Work . . . 80
5 Modelling of Spam Detection in Online Social Network 81 5.1 Introduction of the Background . . . 82
5.1.1 Motivation . . . 83
5.1.2 Contributions . . . 85
5.2 Related Work of This Chapter . . . 86
5.3 Learning from Imbalanced Twitter Spam Data . . . 89
5.4.1 Data sampling techniques . . . 91
5.4.2 Ensemble Empowered Information Decomposition Approach . . . 95
5.5 Evaluation . . . 97
5.5.1 Evaluation Methods . . . 97
5.5.2 Results of Learning from Imbalanced Data . . . 99
5.5.3 Impact of Class Imbalance Rate . . . 102
5.5.4 Impact of the Amount of Positive Data . . . 106
5.6 Conclusion . . . 108
6 Modelling of ‘Drifting’ Twitter Spam Detection 109 6.1 Introduction . . . 109
6.1.1 Motivation . . . 111
6.1.2 Contribution . . . 111
6.2 Related Work of This Chapter . . . 113
6.3 Proposed Method . . . 114
6.3.1 New Detection Framework . . . 115
6.3.2 Fuzzy-Based Redistribution . . . 116
6.3.3 Ensemble with Asymmetric Sampling . . . 118
6.4 Performance Evaluation . . . 119
6.4.1 10-day Ground-truth Dataset . . . 120
6.4.2 Base Classifiers . . . 121
6.4.3 Performance Metric . . . 123
6.5 Results and Discussion . . . 125
6.5.1 Impact of twitter spam drift . . . 125
6.5.2 Overall Detection Performance . . . 126
6.5.3 Day-based Performance for Testing Set-1 . . . 130
6.5.4 Day-based Performance for Testing Set-2 . . . 131
6.6 Conclusions . . . 133
7 A Data-driven Attack against Support Vector Machines 134 7.1 Introduction . . . 134
7.2 Related Work and Notation . . . 138
7.2.1 Adversarial machine learning . . . 138
7.2.2 Notation . . . 139
7.3 Evasion Attack against SVM . . . 141
7.3.1 Support Vector Machines . . . 141
7.3.2 Causative Availability Attack . . . 142
7.3.3 Algorithm Description . . . 148
7.4.1 Simulation study . . . 150
7.4.2 Effectiveness of the attacks on real world data study . . . 152
7.5 Analysis of defence . . . 158
7.5.1 Potential attacker . . . 158
7.5.2 Defence against causative availability attack . . . 159
7.6 Conclusion . . . 160
8 Conclusion and Future Work 162 8.1 Conclusion . . . 162
8.2 Future Works . . . 164
List of Tables
2.1 Imbalanced data learning techniques . . . 10
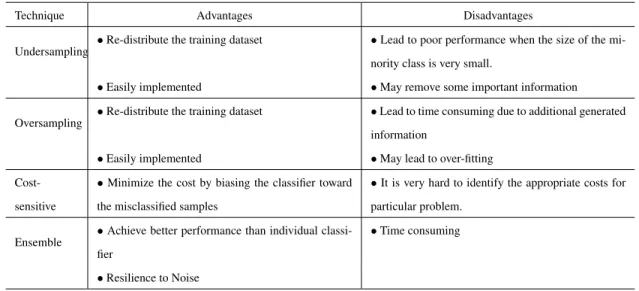
2.2 Advantages and disadvantages of the methods for dealing with imbalanced data . . . 12
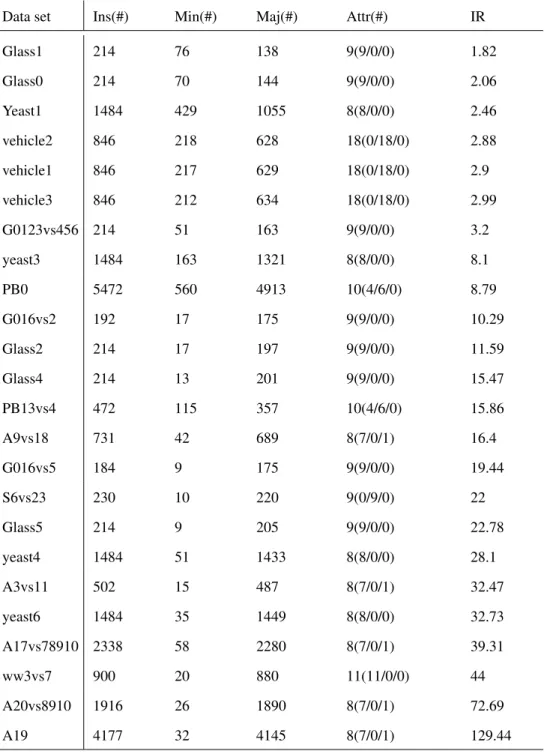
3.1 Dataset characteristics . . . 34
4.1 Symbols used in this chapter . . . 46
4.2 Minority class data used for example . . . 53
4.3 Recovered and re-distributed minority class data . . . 55
4.4 Datasets Information . . . 61
4.5 Parameter setting . . . 64
4.6 Methods for comparison . . . 65
4.7 Averaged GM and MCC values of each technique . . . 71
4.8 AUC values in terms of datasets with 10% missing values . . . 72
4.9 Wilcoxon tests for FID and other methods (No missing values) . . . 75
4.10 Wilcoxon tests for FID and other methods (datasets with 10%-MV) . . . . 76
5.1 Lightweight Statistical Features . . . 91
5.2 Confusion Matrix . . . 97
6.1 Lightweight Statistical Features . . . 122
6.2 ANOVA models for AUC . . . 126
List of Figures
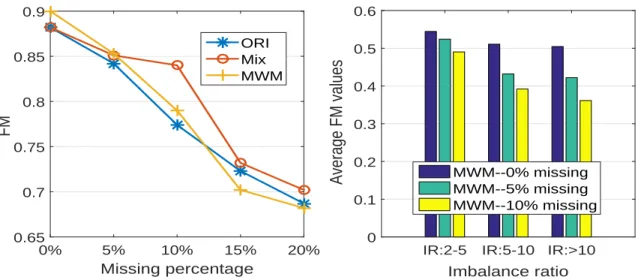
2.1 Impact of missing values and imbalance ratios . . . 31
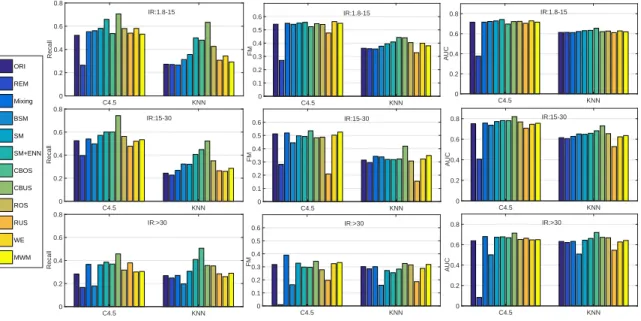
3.1 Classification performance in terms of dataset with 1% missing values . . . 38
3.2 Classification performance in terms of dataset with 5% missing values . . . 39
3.3 Classification performance in terms of dataset with 10% missing values . . . 39
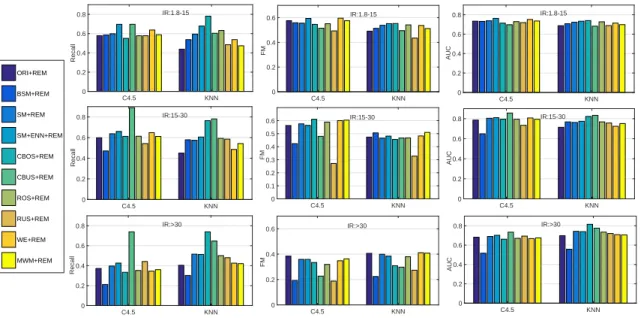
3.4 Classification performance in terms of dataset with 1% missing values (with missing data recovered). . . 40
3.5 Classification performance in terms of dataset with 5% missing values (with missing data recovered). . . 41
3.6 Classification performance in terms of dataset with 10% missing values (with missing data recovered). . . 42
4.1 Processing flow of FID . . . 47
4.2 Illustrating of the data distribution w.r.t Probability Density Function (PDF) 58 4.3 Illustration of Turkey boxplot . . . 59
4.4 Display of distribution: a boxplot . . . 60
4.5 Overall Accuracy performance: imbalanced data. . . 66
4.6 Overall Recall performance: imbalanced data. . . 67
4.7 Overall AUC performance: imbalanced data. . . 68
4.8 Overall Accuracy performance: Datasets with 10% missing values. . . 69
4.9 Overall Recall performance: Datasets with 10% missing values. . . 69
4.10 Overall AUC performance: Datasets with 10% missing values. . . 70
5.1 Performance Degradation Caused by Class Imbalance . . . 88
5.2 Illustrating of the minority and majority class samples on original data, imbalanced data and redistributed data using FOS approach . . . 94
5.3 Distribution Simulation, APDF:Analytical PDF; EPDF: Empirical PDF. . . 94
5.4 Spam Detection Results in Data Sets with a Class Imbalance Rate of 2 . . . 100
5.5 Spam Detection Results in Data Sets with a Class Imbalance Rate of 10 . . 101
5.6 True Positive Rate versus Varying Class Imbalance Rate . . . 103
5.7 False Positive Rate versus Varying Class Imbalance Rate . . . 103
5.8 Spam Detection Precision versus Varying Class Imbalance Rate . . . 104
5.9 Spam Detection F-Measure versus Varying Class Imbalance Rate . . . 104
5.10 True Positive Rate versus Varying Class Imbalance Rate . . . 105
5.11 False Positive Rate versus Varying Class Imbalance Rate . . . 106
5.12 Spam Detection Precision versus Varying Class Imbalance Rate . . . 107
5.13 Spam Detection F-Measure with Different Training Data Set Size . . . 107
6.1 Number of characters in tweets . . . 110
6.2 Account age of tweets . . . 112
6.3 New detection framework . . . 115
6.4 Impact of twitter spam drift . . . 124
6.5 Average performance . . . 128
6.6 Accuracy for testing set-1 . . . 128
6.7 AUC and detection rate for testing set-1 . . . 129
6.8 Accuracy for testing set-2 . . . 131
6.9 AUC and detection rate for testing set-2 . . . 132
7.1 Example-toy of the proposed attack strategy regarding attacking one point on each class (* means the ended point) . . . 150
7.2 The change in the optimal hyperplane display in terms of MMMH and MHL 151 7.3 Accuracy and Detection Rate for MHL and MMMH in terms of online traffic data . . . 153
7.4 Performance of Accuracy and Detection Rate for MHL and MMMH in terms of spambase data . . . 154 7.5 Display of three two-class problems: before and after attack with only
at-tacking one support vector . . . 155 7.6 Performance of Accuracy and Detection Rate for MHL and MMMH in
terms of USPS Handwritten Digits data . . . 156 7.7 Performance of Accuracy and Detection Rate for MHL and MMMH in
Acknowledgements
I would like to express my deepest appreciation and profound thanks to my principle su-pervisor Prof. Yang Xiang and associate susu-pervisor Dr. Jun Zhang for their motivation, continuous support, expert guidance, endless patience and immense knowledge during my PhD study, without which this thesis would never come into existence. I gained much from them regarding writing, presenting and knowledge about research. Their unwavering sup-port and encouragement guided me becoming a confident researcher. I really appreciate. I am also grateful to Dr. Honghua Dai and Prof. Gleb Beliakov for their full support, kindly understanding and helpful criticism. Their invaluable advice will definitely assist me in my future career.
I am thankful to Deakin University for awarding me the Deakin International Postgrad-uate Research Scholarship (DIPRS), without which my PhD study would not have been possible. I would like to thank many academic and staff members of the School of Infor-mation Technology, Deakin University. They are Prof. Wanlei Zhou, Prof. Yong Xiang, Dr. Shui Yu, Dr. Gang Li, Dr. Shen Wen, Dr. Yu Wang, Dr. Tianqin Zhu, Dr. Yuxia Cheng, Ms. Lauren Browne, Ms. Kathy Giulieri, Ms. Alison Carr, Ms. Linlin Zhao and many others for their valuable help.
I also would like to thank my friends and colleagues with whom I had the opportunity to interact in a friendly working environment. They are Mr. Chao Chen, Mr. Yuexin Zhang, Mr. Xiao Chen, Ms. Mengmeng Yang, Ms. Liu Liu, Mr. Shuiqiao Yang, Ms. Jiaojiao Jiang, Ms. Kongalage Nishchitha Indivarie Ubhayaratne, Mr. Keshav Sood, Mr. Tianrui Zong, Ms. Tingmin Wu and many others.
Thanks to the reviewers for their efforts to help improve this thesis.
Special and heartfelt thanks to my parents for their long distance support, endless love and standing by me no matter what and when. The greatest debt goes to my wife, Denise Xiaosong Men for her endless love, care, and encouragement.
List of Publications
During the period of candidature the following publications were produced in fully refereed international conference proceedings and journals.
Refereed Journal Articles
1. S. Liu, W. Yu, J. Zhang, C. Chao, and X. Yang. “Addressing the Class Imbalance Problem in Twitter Spam Detection Using Ensemble Learning.” Computers & Secu-rity, 2016. Impact Factor 1.640.
2. S. Liu, H. Dai, and M. Gan. “Information-decomposition-model-based missing value estimation for not missing at random dataset.” International Journal of Machine Learning and Cybernetics, pp. 1-11, 2015. Impact Factor 1.110.
3. S. Liu. “Detecting communities of directed networks via a local algorithm.”J. Math. Inform, v.1, pp. 43-51, 2013.
Refereed Conference Articles
1. S. Liu, W. Yu, C. Chao, and X. Yang. “An Ensemble Learning Approach for Address-ing the Class Imbalance Problem in Twitter Spam Detection.” In Australasian Con-ference on Information Security and Privacy (ACISP2016), pp. 215-228. Springer International Publishing, 2016.
2. S. Liu, J. Zhang, and Y. Xiang. “Statistical Detection of Online Drifting Twitter Spam: Invited Paper.”In Proceedings of the 11th ACM on Asia Conference on Com-puter and Communications Security(AsiaCCS2016), pp. 1-10. ACM, 2016.
3. S. Liu, J. Zhang, Y. Wang, and Y. Xiang. “Fuzzy-based feature and instance recov-ery.”In Asian Conference on Intelligent Information and Database Systems(ACIIDS2016), pp. 605-615. Springer Berlin Heidelberg, 2016.
4. S, Keshav, S. Liu, S. Yu, and Y. Xiang. “Dynamic access point association using Software Defined Networking.” In Telecommunication Networks and Applications Conference (ITNAC2015), pp. 226-231. IEEE, 2015.
5. S. Liu, and H. Dai. “A New Effective Information Decomposition Approach for Missing Data Recovery.” In Proceedings of the International Conference on Data Mining (DMIN2014), The Steering Committee of The World Congress in Computer Science, Computer Engineering and Applied Computing (WorldComp2014), 2014. 6. S. Liu, and H. Dai. “Examination of reliability of missing value recovery in data
min-ing.”In 2014 IEEE International Conference on Data Mining Workshop(ICDMW2014), pp. 306-313. IEEE, 2014.
7. S. Liu, M. Gan, and H. Dai. “A hybrid approach to fuzzy risk analysis in stock market.” In Fuzzy Systems and Knowledge Discovery (FSKD2013), pp. 295-298. IEEE, 2013.
8. T. Wu, S. Liu, J. Zhang and X. Yang. “Twitter Spam Detection based on Deep Learn-ing.” In Proceedings of the Australasian Computer Science Week Multiconference, ACM, 2017.
Submitted Articles
1. S. Liu, J. Zhang, X. Yang and W. Zhou. “Fuzzy-based Information Decomposition for Incomplete and Imbalanced Data Learning.” IEEE Transactions on Fuzzy Sys-tems, Impact Factor 6.701). (Major Revision).
2. S. Liu, J. Zhang, Y. Wang, X. Yang and D. Xiang. “A Study of Data Pre-processing Techniques for Imbalanced Bioinformatics Data Classification.” Journal of Biomed-ical Informatics. Impact Factor 2.447). (Major Revision).
3. T. Wu, S. Liu, J. Zhang, S. Wen and X. Yang. “Detecting Spamming Activities in Twitter based on Deep Learning Technique.” Concurrency and Computation: Prac-tice and Experience, Impact Factor 0.942. (Major Revision).
4. S. Liu, Jun Zhang, Xiang Yang, Wanlei Zhou, and Olivier De Vel. “A Data-driven Attack against Support Vector Machines.”IEEE Transactions on Information Foren-sics and Security. Impact Factor 2.441. (Under review)
5. Tingmin Wu, Sheng Wen, S. Liu, Jun Zhang and Yang Xiang, Wanlei Zhou. “Sur-vey of Twitter Spam Detection: State-of-the-Art and Comparative Studies.” IEEE Communications Surveys and Tutorials. Impact Factor 9.22. (Under review).
Abstract
Class imbalance problem has been identified as one of the top ten challenging problems in machine learning research. Traditional machine learning tends to favour the majority class and results in very high overall accuracy while performs poorly on the minority class. The problem can be more severe when there are missing values in the imbalanced data. It will further destroy the symmetry of the training data and decrease the classifier’s performance. In order to counter this challenge, a number of techniques have been proposed to handle missing values or imbalanced data. However, each method focuses on a single problem. It cannot solve the complex problem of imbalanced data with missing values by simply combining two methods. Moreover, class imbalance problem, which has a negative impact in spam detection on online social network, has not been considered in previous study. Fur-ther, machine learning-based technique for ’drifting’ spam detection is still open, because the structure are changing from time to time which decreases the classification perfor-mance. Last but not least, traditional classifiers have not considered the security problem in spam detection, therefore, adversaries can exploit specific vulnerabilities exposed by classical methods to fool the classification systems.
In this dissertation, I attempt to address the aforementioned problems. The work mainly consist of four schemes: Firstly, we propose a fuzzy-based learning method, which can deal with the imbalanced data and robust to missing values at the same time. In the new solu-tion, both missing data imputation and rebalance of the training data are treated as a specific missing data estimation problem. The proposed method has two steps: weighting and re-covery. In the weighting step, the weights obtained by membership functions are used to quantify the contribution of the observed data to the missing features. In the recovery step,
missing values are estimated by considering different contribution of the observed data. Secondly, in order to deal with the class imbalance problem in spam detection with respect to online social network, we develop an ensemble learning. The presented ensemble learn-ing approach involves three steps. Class distribution rebalance uslearn-ing various strategies, including random oversampling, random undersampling and fuzzy-based oversampling; classification model creation upon each of the redistributed data sets; and decision making based on majority voting. After that, we have modelled the ‘drifting’ Twitter spam detec-tion problem. The scheme of the proposed ensemble learning involves three steps: data preparation, multiple classifier creation and final results aggregation. Experiments results show that the proposed algorithm can build an effective classification model for streaming Twitter spam detection in dataset with imbalanced class distribution. Finally, the vulnera-bility of support vector machine regarding poisoning attack has been investigated, and the possible defence strategy has been analysed as well.
All in all, our work is of great of significance in this research area either from academic or industrial perspective, although there are still some ongoing work to do in future. In order to enable validation and extension of the work in this thesis, the datasets can be download from http://nsclab.org/nsclab/resources/.
Keywords: Machine Learning, Sampling, Ensemble, Imbalanced Data, Missing Data,
Chapter 1
Introduction
This chapter first introduce the background of the research problems, followed by motiva-tion and the detailed explanamotiva-tion of the identified research problems. Finally, the contribu-tions and organization of this thesis have been outlined.
1.1
Background
In the terminology of machine learning, classification which is a supervised learning proce-dure, trains a concise classification model based on a set of correctly labelled observations. Then, the classification model is used to predict the labels for the test data which are repre-sented by observed features. Machine learning techniques have been successfully applied in many scientific fields such as computer science, engineering, statistics, biology and even medicine.
However, in many real-world problems, the classification performance drops dramat-ically during to the class imbalance problem. Generally speaking, class imbalance [1–3] appears in the training set when the instances of one class are significantly outnumbered by the instances of another class. In some applications, class imbalance is treated as an
intrinsic property. For example, in twitter spam detection, there are usually very few spam samples compared to a large number of legitimate Tweets. In some other applications, class imbalance could be caused by variable factors such as time and storage, which hinders the classification ability of standard learning algorithms. For instance, suppose a dataset is produced from a continuous data stream and there are sporadic interruptions during the transmission, it is likely that the acquired dataset is extrinsic imbalanced. With class im-balance, conventional machine learning tends to favour the majority class and results in very high overall accuracy while performs poorly on the minority class. However, in most cases, the minority class is highly interested from a learning point of view [4, 5]. For ex-ample, in the diagnosis of a disease, we often have plenty of data for the healthy condition but very limited data about diseases. If a learning algorithm is applied to such data directly, the learned diagnosis model would perform poorly because it is biased to the major class of healthy data [6]. The problem will be more severe when there are missing values present in the imbalanced data. The missing values will further destroy the symmetry of the training data and decrease the classifier’s performance. This thesis aims to improve the classifi-cation performance when we are faced with deficient data, which means imbalanced data with missing values.
Although many techniques have been developed to deal with missing values [7] or imbalanced data [1], none of these techniques have been initially designed for both. To be specific, the techniques of estimating missing values [7, 8] do not have the capability to address the problem of imbalanced data. The techniques proposed for handling imbalanced data [1, 9] have not considered the problem of missing data. Therefore, the problems of imbalanced data with missing values must be effectively addressed in real world pattern classification tasks.
In addition, although machine learning (ML) is commonly used in multiple disciplines and real-world applications, such as information retrieval, financial systems, health, bio-metrics and online social networks, their security profiles against deliberate attacks have not often been considered. Sophisticated adversaries can exploit specific vulnerabilities ex-posed by classical ML algorithms to deceive intelligent systems. It is impossible to forecast all potential face spoofing attacks and fake fabrication techniques, as attackers constantly aim to find novel ways to cheat the system [10]. Therefore, we must have a good under-standing of the vulnerabilities as well as potential attacks so as to develop novel method to guarantee that machine learning can be securely applied in an adversarial setting [11].
This chapter introduces the research problems and research strategies.
1.2
Motivation and Research Issues
In the last decades, many techniques have been proposed to address either missing data or imbalanced data problem.
Class imbalance that presents between two classes is referred to between-class im-balance. However, the decreased classification performance on the minority class is not only because of the between-class imbalance. Another problem is within-class imbalance, which concerns itself with the distribution of representative data for subconcepts within a class [12]. The existing approaches for imbalanced data learning fall into three groups: data sampling, cost-sensitive learning and ensemble learning. Data sampling re-distributes the training data by sampling, which allows classifiers to perform in the conventional way. Two well-known approaches are undersampling and oversampling, either eliminating the ma-jority class instances [13–15] or increasing the minority class instances [16–21]. However,
undersampling may remove some important information from the training data. Oversam-pling may add noise to the training data and violate the inherent geometrical structure of the original data [5]. Besides, feature selection [22], [23] can be considered as another sam-pling technology, which has been widely applied in imbalanced high-dimensional data. To address the class imbalance problem, the cost-sensitive learning can work on the data level, algorithm level or both. It takes the misclassification cost into consideration and assigns a higher cost to misclassified positive samples [24]. However, the misclassification costs are often unknown and cost-sensitive learning usually leads to overfitting [25]. Lastly, ensem-ble learning trains multiple classifiers for the same task and combines their predictions to classify new instances, which can effectively improve the classification performance. The typical ensemble methods include bagging-family-based, boosting-family-based and ran-dom forests-family-based learning methods [26, 27]. The limitation of ensemble learning is time-consuming [26].
Nowadays, real world data can be obtained from various ways such as sensor networks, questionnaires, online service streaming API etc. However, many of the real world appli-cations suffer from the problem of incomplete and imbalanced data [28, 29]. Incomplete data have missing values [30],since some of the data values in the current observation have not been stored. For example, in a manufacturing line, it is not feasible to record every line variables of every product at all times. Instead, variables are only measured on some products at certain times without significantly slowing down producing output.
The existing techniques have a number of limitations. Without knowing the data dis-tribution in advance, statistical imputation usually lead to bias. The soft-computing tech-niques usually do not function when there are a large amount of missing values. In par-ticular, none of the techniques have been initially designed for imbalanced data learning
problem. In real-world applications, the deficient data (missing value in the imbalanced data) is a critical problem for machine learning and knowledge discovery [7, 31]. Inappro-priate treatment of missing values will cause large errors or even false results. Therefore, it is very necessary to address the two problems simultaneously when using machine learning classification algorithms with deficient data.
In the thesis, another problem investigated is that the data structure are changing from time to time, which is referred to “data drift”. “Twitter spam drift” is taken as an example for detailed study. Twitter as one of the most popular online communication medium, is inevitably attracting many spammers to infiltrate legitimate users’ accounts with large number of spam links. To alleviate the spamming problem, recent researchers focused on applying machine learning techniques to Twitter spam detection with satisfactory results reported. However, tweets are retrieved in a streaming way, thus the performance of an existing machine learning based classification model decreases seriously over time.
In addition, although machine learning, as an emerging field, is commonly used in security-sensitive applications, their security properties against deliberate attacks have not yet been taken into account, and there remain many unsolved research problems. For ex-ample, training targeted attacks have only been sparsely addressed under different scenar-ios [32] or to a limited extent [33]. For example, it is hard to choose the best starting point and it is unreasonable to assume that the attacker controls the labels (e.g., flips the label) of the injected points in real world problems when conducting a poisoning attacks against a support vector machine; it is hard to identify the data distribution for the empirical framework of classifier security in the case of drifting Twitter spam [34].
1.3
Overview of the Work and its Contribution
This thesis first aims to address the deficient data classification problem. Moreover, the online social media spam detection has been studied by taking drifting twitter spam and class imbalance problem into account. Furthermore, considering that conventional machine learning algorithms have not taken the security issue into account, this thesis also simulates and analyses the vulnerability of support vector machine classification algorithm. Overview of the work and the major contributions are summarized as follows:
• Firstly, to deeply understand the problem of class imbalance, this work has modelled it using varies of datasets across different kind of imbalanced ratios. Meanwhile, different levels of missing values are investigated in the imbalance data. Experiment results quantitatively show the impact of the deficient data (missing values and im-balance class) to classification performance.
• Secondly, to address class imbalance and missing values at the same time, a new approach is proposed to unify two different problems as a specific missing data im-putation problem. The proposed algorithm rebalances the training data by creating synthetic samples for the minority class. We apply the new fuzzy based learning algorithm to the deficient data (in order to address class imbalance and missing val-ues). To evaluate the proposed method, a large number of classification experiments have been carried out on 27 well-known datasets. The results show that the proposed method significantly outperforms other 10 state-of-the-art individual methods and 8 different combinations.
• Thirdly, considering online social network spam detection experiences the class im-balance problem, an ensemble approach is developed to empower the information de-composition algorithm for repairing imbalanced data. The new algorithm integrates the information decomposition, random undersampling and random oversampling into a compound spam detection framework.
• Fourthly, to alleviate the ‘data drifting’ problem in online social network spam detec-tion, we make use of asymmetric sampling technique to re-balance the sizes of spam samples and non-spam samples in small number of imbalanced training data, and then update the model from time to time. A number of experiments are performed on ground-truth datasets to evaluate the proposed method. Experimental results show that the proposed scheme can significantly improve the detection performance.
• Finally, in order to further explore the vulnerabilities of the classification algorithms, and response to the threat of adversarial data manipulation. In this thesis we specif-ically investigate the vulnerability of SVM with an effective and applicable attack by minimizing the margin and maximizing the hinge loss. Meanwhile, the potential defence methods have been discussed.
1.4
Organization of the Thesis
The rest of the thesis is organized as follows:
• Chapter 2: This chapter presents the comprehensive literature review of the existing method for addressing imbalanced data, and techniques for dealing with missing values are also recalled. In addition, the disadvantages of the recalled methods are also discussed.
• Chapter 3: We investigate the class imbalance problem as well as the classification with deficient data problem. Experiments show that the classification performance decreased with the increase of imbalance ratio and percentage of missing values.
• Chapter 4: In this chapter, a fuzzy-based oversampling algorithm is developed to address the class imbalance problem, and it is also robust to missing values. Experi-ments based on deficient data have been conducted and analysed.
• Chapter 5: In order to empower the new fuzzy-based oversampling method, the ensemble learning has been employed in out study. The proposed ensemble method is capable in real-world spam detection. A series of experiments and analysis have been conducted in order to show the effectiveness of the proposed algorithm.
• Chapter 6: This chapter proposes another new ensemble method based on fuzzy re-distribution and asymmetric sampling. The new scheme can address ‘drifting’ spam detection problem. The empirical study shows that the asymmetric-based ensemble can further improve the classification performance for at least 5%.
• Chapter 7: We investigate the vulnerabilities of the Support Vector Machine (SVM) classification algorithm, and response to the threat of adversarial data manipulation. The new experimental result in this study is that SVM will lose its generalization even though several support vectors have been attacked.
• Chapter 8: This chapter concludes the contributions of the thesis and offers some ideas for future work.
Chapter 2
Literature Review
This chapter first recalls the class imbalance and missing values problems, separately. Then, existing work regarding the deficient data classification problem has been reviewed.
2.1
Class Imbalance
Imbalanced data means the target classes of the data is skew in distributions; that is, there is at least one class of instances which significantly out numbers other classes. Accordingly, the minority dataset is called positive examples while the majority dataset is called negative examples. Traditional classification methods, seeking to minimize the overall error rate of the whole training set, do not perform well on imbalanced data, since they generally assume a relatively balanced class distribution, and put too much strength on the majority class.
Moreover, there exist many domains that do not have a balanced dataset. Such as med-ical problems-rare but dangerous illness, discrimination between earthquakes and nuclear explosions, document filtering, direct marketing, detection of oil spills, network intrusion detection, detection of fraudulent telephone calls, spam filtering, and detection of false
information. However, traditional classification algorithms are more focused on classifica-tion of majority samples while ignoring or misclassifying minority samples. In practice, the minority samples which rarely occur are usually the most important to us.
Table 2.1: Imbalanced data learning techniques
Category Acronym Year Algorithm Study work
Sampling
Basic methods
ROS 2004 Random oversampling [35] [1] [13] [9]
RUS 2004 Random undersampling [35] [1] [13] [9]
Advanced methods
NCL 1972 Neighbourhood Cleaning Rule [36] [9]
OSS 1997 One-Sided Selection [37] [13] [9]
TL 1976 Tomek Links [38] [9] SM 2002 SMOTE [17] [13] [1] BSM 2005 Borderline SMOTE [18] [13] [1] SM+ENN 2004 SMOTE+ENN [35] [9] SL-SM 2009 Safe-Levels-SMOTE [39] [9] WE 2004 Wilsons Editing [40] [13]
BootOS 2007 Bootstrap-based Oversampling [41] [3] ADA-SYN 2008 Adaptive Synthetic Sampling [42] [1]
CBOS 2004 Cluster-based oversampling [16] [13]
SMOTE-FRST 2012 SMOTE based on fuzzy rough set theory [43] [25] CBUS 2013 Cluster-based undersampling [14] [25] [14] MWMOTE 2014 Majority Weighted Minority Oversam-tech
[12]
[44]
Cost-sensitive
Cost-sensitive sampling
Costing 2003 Cost-sensitive meta-learning [45] [46]
Cost-sensitive non-sampling
MetCost 1999 MetaCost [47] [46]
CSC 2003 CostSensitiveClassifier [45] [46]
Thresholding 2001 Thresholding methods MetCost [48] [46] weighting 2007 Instance-weighting method [49] [46] [50]
Bagging
asBagging 2006 Asymmetric bagging [51] [27]
RB Bagging 2009 Roughly Balance Bagging [52] [27]
continued from previous page
Category Acronym Year Algorithm Study work
SMOTEBagging 2009 SMOTE and Bagging [53] [53]
Over Bagging 2009 Random oversampling and Bagging [53] [53] Under Bagging 2006 Random undersampling and Bagging [54] [27]
Lazy Bagging 2008 Lazy Bagging [55] [56]
RFS 2008 Random features selection [57] [58]
asBagging FSS 2014 Asymmetric bagging and feature subspace [59]
[59]
IAB 2016 An Improved Asymmetric Bagging [60] [60]
Boosting
SMOTEBoost 2003 SMOTE and the boosting procedure [61] [27]
EasyEnsemble 2009 EasyEnsemble [62] [27]
BalanceCascade 2009 BalanceCascade [62] [63]
RAMOBoost 2010 RAMOBoost [64] [63]
RUSBoost 2010 Random undersampling and boosting [65] [27] LP-Boost 2002 Linear program approaches to boosting [66] [66] Random Forests
RBF 2004 Balanced Random Forest [67] [67]
WRF 2004 Weighted Random Forest [67] [67]
Others
Kernel methods
KBA 2006 Kernel boundary alignment considering im-balanced data distribution [68]
[1] [27]
GSVMs 2005 Granular support vector machines [69] [1] GSVM-RU 2006 Granular SVM-Repetitive
Undersam-pling [70]
[1]
KernelADASYN 2015 Kernel based adaptive synthetic data genera-tion for imbalanced learning [71]
[71]
Active learning
2007 Active Learning on the border [72] [1] GSsw/GSadapt 2013 Active Learning for Discovery and
Classifica-tion [73]
[73]
PLAT+CFI 2015 positive label threshold and the combination method [74]
[75]
OCE 2006 Off Center Entropy [76] [77]
IFROWANN 2015 Imbalanced Fuzzy-Rough Ordered Weighted Average Nearest Neighbor Classification [78]
Table 2.2: Advantages and disadvantages of the methods for dealing with imbalanced data
Technique Advantages Disadvantages
Undersampling
•Re-distribute the training dataset •Lead to poor performance when the size of the mi-nority class is very small.
•Easily implemented •May remove some important information
Oversampling
•Re-distribute the training dataset •Lead to time consuming due to additional generated information
•Easily implemented •May lead to over-fitting
Cost-sensitive
•Minimize the cost by biasing the classifier toward the misclassified samples
•It is very hard to identify the appropriate costs for particular problem.
Ensemble
•Achieve better performance than individual classi-fier
•Time consuming
•Resilience to Noise
To address the class imbalance problem, many methods have been proposed. Generally speaking, approaches to classification with imbalanced data issues involve three main cat-egories: the resampling, cost-sensitive methods and the ensemble methods [1], [79]. Table 2.1 is the detailed description of each method with the related reference and study work. Table 2.2 presents the general advantage and disadvantages of each technique. In this chap-ter we mainly pay more attention to resampling and ensemble techniques which are more related to our study. For the detailed information of each technique, please refer the related work from Table 2.1.
2.1.1
Resampling Approaches
The data sampling approach is actually a re-balancing process for an imbalanced dataset. The simplest oversampling method is to randomly duplicate the minority class, namely ran-dom oversampling (ROS) [35], which usually causes over-fitting. To overcome ROS’ draw-back, some complicated sampling methods were developed. Chawalet al. proposed a syn-thetic minority oversampling technique SMOTE [17]. However, SMOTE does not consider the original distributions of classes, it may lead to more over-fitting between classes. Han et al. [18] realized that most of the classification algorithms are attempting to learn from the borderline of each class in the training process, and proposed Borderline-SMOTE over-sampling method [18]. Furthermore, cluster-based overover-sampling (CBOS) was proposed to even out the between-class imbalance as well as the within-class imbalance [16]. In addi-tion, Barua proposed a Majority Weighed Minority Oversampling Technique(MWM) [12] to address the class imbalance problem.
The simplest undersampling method is random undersampling (RUS) [35], which ran-domly removes examples from the majority class. One-sided selection(OSS) [37] is another early undersampling technique, which removes the majority class examples that are consid-ered either redundant or noisy. Later, Wilsons editing (WE) [40] was proposed to apply the KNN to classify each example and remove misclassified majority instances. Rahman and Davis introduced a cluster based under-sampling (CBUS) [14] method. In addition, The author proposed the SMOTE+ENN [35] method which first apply SMOTE to the training data and then make use of Wilson’s Edited Nearest Neighbor Rule (ENN) to remove the misclassified majority class examples.
In this section, we will provide a detailed introduction in regard to some popular sam-pling methods, because they are closely related to this research.
Random over-sampling (ROS): In ROS, a new minority sample is created by ran-domly selecting a training sample from the minority class, and then duplicating it. In doing so, the class distribution can be balanced, but this may usually cause over-fitting and longer training time during imbalance learning process.
Random under-sampling (RUS):This technique draws a random subset from the
ma-jority class while discarding the rest of instances, where the class distribution can be bal-anced. The size of the subset is calculated according to the desired class distribution ratio. However, one common criticism is that some important information may be lost when ex-amples are removed from the training data set at random, especially when the dataset is small.
One-sided selection(OSS) [37]: OSS initially reduce the number of redundant
neg-atives by creating a subset, consistent with the training set. After this, it deletes those negative examples which are participated at Tomek links [38]. Precisely, given an in-stance xi ∈ Smin, and xj ∈ Smaj, Tomek link first calculate the distance between xi
and xj, then xi and xj is called Tomek link as long as there is no example xk, such that
d(xi, xk)< d(xi, xj)ord(xj, xk)< d(xi, xj). In this case,xiandxj are regarded as either
noise or near a border, which will be ‘cleanup’ in order to create a training set consisting of safe cases by removing the considered either redundant or ‘noisy’ examples of the ma-jority class examples. Other similar works that using Tomek links are condensed nearest neighbor rule and Tomek Links (CNN+Tomek Links) [35], neighbourhood cleaning rule (NCL) [80], and SMOTE applies Wilson’s ENN rule [35].
Synthetic Minority Over-sampling Techniques (SM) [17]: This technique add new
artificial minority attribute examples by extrapolating instances from thek nearest neigh-bors (kNN) to the minority class instances. To be specific, let x, as a sample from the
minority class, andy is one of its neighbours based onkNN-based approach. In order to generate a synthetic sample from the original minority class sample, say z, SM create a syntheticz using the linear interpolation ofxandy:
g =x+gap×(y−x) wheregamis a random number between 0 and 1.
However, one typical shortage is that SM generates numbers of synthetic data samples from the original minority class while ignoring the nearby majority class samples.
Borderline-SMOTE (BSM) [18]: BSM is an attempt to improve upon SMOTE by
only over-sampling minority class instances which are considered to be on the border of the minority-decision region. It can be described as follows: Firstly, for each original sample
xi ∈Smin, choose a set of its neighbours usingkN N. Then, identify the numbertof nearest
neighbours that belong to the majority class. Then ifk/2 < t < k is true,xi ∈ Smin is
considered as borderline instance. Finally, SM is applied to create new examples by using borderline samples.
SMOTE applies Wilson’s ENN rule (SM+ENN) [35]: This technique is mainly for
removing any over-fitting examples using three nearest neighbours from training set. For example, artificially introducing some minority class can expand the majority class clusters, which may lead the minority examples deep into majority class space. In this situation, a classifier can be over-fitting. This method is more applicable when facing a small number of positive class examples.
Safe-Levels-SMOTE (SL-SM) [39]: Considering SMOTE has the disadvantages of
ignoring the nearby majority samples because it randomly generates numbers of synthetic data samples based on a joining minority instance and its neighbours. SL-SM carefully
oversamples the minority class along the same line with different weight degree. To be specific, SL-ML first calculates a safe-level for each positive sample. In this case, all syn-thetic instances are created only in safe regions because each synsyn-thetic sample is positioned closer to the largest safe level.
Adaptive Synthetic Sampling [42, 71, 81–85]: Generally speaking, ADASYN
uti-lizes a systematic method to adaptively assign different oversampling ratio according to their distributions. Many adaptive synthetic sampling techniques have been proposed [1]. For example, considering SM creates the same number of synthetic samples for each minority class dataset without considering its neighbours, which usually cause overlap-ping between classes [1]. Several adaptive sampling methods such as Adaptive Synthetic Sampling (ADASYN) [42], probability density function (PDF) estimation based over-sampling (PDFOS) [81], KernelADASYN [71], adaptive over-sampling with optimal cost [82], Minority Oversampling Technique based on Local Densities in Low-Dimensional Space (MOT2LD) [83] have been developed to address such limitation. Specifically, the main idea of ADASYN is to use a density distribution function to identify the number of syn-thetic samples to be generated regarding each of the minority class, and then adaptively assigns different weights for the minority class in order to alleviate the imbalance ratio. By doing so, ADASYN not only can re-balance the training data by adaptively gener-ating synthetic data samples for the minority class but also can shift the classifier deci-sion boundary regarding the easily misclassified samples. Motivated by the success use of ADASYN, [12] proposed a KernelADASYN algorithm for class imbalance problem. In order to obtain a reliable sampling distribution for synthetic minority class samples gener-ating, KernelADASYN applies kernel density estimation methods to identify the PDF of the minority class. After that, ADASYN is used to weight the sampling distribution of the
minority class. Finally, experiments show satisfied results. Further, in [85] an Adaptive Semi-Unsupervised Weighted Oversampling (A-SUWO) has been developed for dealing with imbalanced binary dataset problem. This method first groups the positive class us-ing a semi-unsupervised hierarchical clusterus-ing, and then, the oversample ratio for each sub-cluster will be adaptively determined by using the cross-validation and classification complexity. Finally, the minority class will be re-balanced by taking their Euclidean dis-tance into account.
Wilsons Editing(WE) [40]: WE which introduced by Barandela et al., modifies the
older strategy (by Wilson) for pruning a data set in order to improve the balance level. Precisely, this technique consists of applying the kNN classifier with k = 3 to classify each example in the training set by using all the remaining examples, and removing those majority class instances whose class label does not agree with the class associated with the largest number of the k = 3 neighbours. Realized that the editing technique did not produce significant reductions in the size of the majority class. Barandela et al. modified the distance calculation with the weighted distance below mentioned, which have taken the class into account. Formula (7.3.1) is the modified weighting distance, where Ni is the
number of examples in classiof the training data,N is the total number of samples in the dataset, and m is the number of features in each sample. We can see that the weighting distance for a minority class sample is smaller than the weighting distance for a majority class sample. weighting distance= Ni N m1 (2.1.1)
Cluster-based over-sampling(CBOS) [16]: The main idea of this approach is that
be-fore performing random over-sampling, first usingk-means algorithm to cluster the minor-ity and majorminor-ity classes separately. After the training examples of each class have been
clustered, all clusters in the majority class, except for the largest one, are randomly over-sampling as the same number of the training examples as the largest cluster samples. Then the total number of the majority clusters are even out to each cluster of minority clusters. Thus, the minority class and majority class are balanced with the same number of exam-ples. Finally, merge the updated minority class and majority class into one data set as a new training data set. Take the example from [16], let assume that the training examples of the minority and majority classes are respectively clustered as follows:
Majority class:10,10,10,24(which means there are four clusters with each cluster has 10,10,10,24examples, respectively).
Minority class: 2,3,2
According to CBOS, we obtain the below new distribution of each cluster: Majority class: 24,24,24,24
Minority class: 32,32,32
That is to way, in the majority class, all size 10 clusters are oversampled to 24 training samples, which is the largest majority subcluster. In this respect, the minority should have the same number of examples which is 96 after resampling, since it includes only three clusters, therefor, each minority class cluster is randomly oversampled until it contains 96/3 = 32examples.
Cluster-based under-sampling(CBUS) [14]: The aim of Cluster-based
undersam-pling approach is not to balance the data ratio of majority class of minority class into 1:1, instead, to reduce the gap between the numbers of minority class and minority class. Dif-ferent from CBOS, this method only clusters the majority class into k clusters and regard each cluster as one subset of the majority class samples. After that combine each cluster with the whole minority class, and then the combined datasets will be considered as the
updated training datasets. Finally, classify all thekdatasets with a classifier and chose the one that has the highest accuracy for building the training model.
Majority Weighed Minority Over-sampling Technique (MWM) [12]: This
tech-nique involves three key steps, identifies the most important and hard-to-learn minority class samples,Simin, calculates a select weightSwfrom each member ofSimin, and
gener-ates the synthetic samples fromSiminusingSw and produce the output setSominby adding
the newly generated samples to the original minority class,Smin.
Precisely, there are three stages in constructing Simin. In the first stage, MWMOTE
filters the original minority class samples, Smin, in order to find a filtered minority set,
Sminf. In this respect, the nearest neighbour of each sample xi of Smin is calculated,
N N(xi). Thenxi will be removed if itsN N(xi)contains only the majority class samples.
In the second stage, construct a borderline majorities,Nmaj(xi)for eachxi with expected
the number of majority neighbours used for constructing informative minority samples (k2) as small as possible, and a borderline majority set Sbmaj is obtained by combining all the
Nmaj(xi). Finally, MWMOTE constructsNmin(yi)regarding eachyi ∈Sbmaj, and then we
can obtainSiminby combining all theNmin(yi).
For the weights of MWMOTE,Sw is expressed as:
Sw(xi) = P
yi∈SbmajI(yi, xi)whereIw(yi, xi)is the information weight, which is
com-puted as the product of the closeness factor,Cf(yi, xi)and the density factorDf(yi, xi):
Iw(yi, xi) =Cw(yi, xi)×Dw(yi, xi) (2.1.2)
While the closeness factorCf(yi, xi)is defined as:
Cf(yi, xi) =
f(d 1
n(yi,xi))
Cf(th)
Where Cf(th) and CM AX are the user defined parameters and f is a cut-off function which is: f(x) = ( x if x6Cf(th) Cf(th) otherwise (2.1.4) Moreover, MWMOTE computeDf(yi, xi)by normalizingCf(yi, xi), which is:
Df(yi, xi) =
Cf(yi, xi) P
q∈SiminCf(yi,xi)
(2.1.5) In addition, in synthetic samples generating process, MWMOTE first clusterSmin intoM
clusters, which can be denoted as L1, L2,· · ·, LM. Then select a sample x from Simin
following the probability distributionSp(xi) (whereSp(xi) = Sw(xi)/Pzi∈SiminSw(zi)).
Let’s assume x ∈ Lk. After After that randomly choose another sample y from Lk, and
generate a synthetic samplesusing the linear interpolation ofxandy, which is:
s =x+a×(y−x) (2.1.6)
Whereαis a random number of[0,1].
Feature Selection (FS) [12]:This technique is employed in the asBagging FSS method
[12], in which the irrelevant and redundant features are expected to be removed. In order to delete the redundant features, FS first collect the similar features into multiple different groups by using hierarchical clustering method which utilizes Pearson correlation coeffi-cient [86]. The Pearson correlation coefficoeffi-cient computes the similarity across two features
fiandfj as: Sim(fi, fj) = PN k=1(fik−f¯i)(fjk −f¯j) q PN k=1(fik−f¯i)2 q PN k=1(fjk −f¯j)2 (2.1.7)
Where fik is the value offi on the kth sample, f¯i is the mean offi andN is the size
of the training dataset. After the multiple clusters are obtained, FS utilize the following signal-noise ratio (SNR) to extract the most relative features of the classification task:
Whereµ0andµ1are mean values of featuref1belonging to two different classes,σ0andσ1
are their standard deviations. According to [86], the extracted features are closely related with classification and approximatively non-redundant.
2.1.2
Cost-sensitive Approaches
Researchers have shown that cost-sensitive learning has a strong connection with imbal-anced data learning, and various studies have emphasized that cost-sensitive learning even superior than sampling techniques for dealing with class imbalance problems in certain domains [1, 3, 87–90]. Different from sampling techniques which create synthetic sam-ples for the minority class, cost-sensitive approaches are mainly focused on the assigning different costs for the misclassified data samples. Many cost-sensitive methods have been proposed. One category is adaptive boosting-based cost-sensitive such as meta cost [47], AdaCost [91], AdaC1, AdaC2 and AdaC3 [92], Multi-class classification using AdaBoost [93], adjusting misclassification costs algorithm [94], cost-based soft-margin maximization method [79], empirical study [95], CogBoost [96], Cost-Sensitive Large margin Distribu-tion Machine (CS-LDM) [97]. The main idea of weighting strategy of AdaBoost is to balance the weights between the misclassified class samples and correctly classified sam-ples, which means the costs of the misclassified samples will increase while the costs for the correctly grouped samples will decrease by an identical ratio. However, one problem is that an explicit description of misclassification costs is hard to know in many situations, another issue is that it is very challenging to determine a cost for a given domain which is even impossible.
there are three forms regarding this category which are: decision threshold-based sensitive adjustments; the node of split criteria-based sensitive learning; and cost-sensitive pruning-based decision tree. In [98], the placement of the decision threshold, the imbalance ratio of the training data and the misclassification costs of each class have been discussed, and [99] presented the evidence regarding the varying of the cost matrix and the moving of decision tree threshold in terms of misclassification costs were unknown. Sheng and Ling [46] proposed aThresholdingapproach for imbalanced data learning. Similar to other cost-sensitive mate-learning techniques, with the help of Thresholding, the existing cost-sensitive learning algorithms can be converted into cost-sensitive ones. In this respect,
Thresholdingcan assign proper thresholds for the training class samples By taking misclas-sification cost into account. Experiments have shown the sensitivity ofThresholdingon the misclassification cost ratio, especially when there is large difference on misclassification costs. Sahin et al. [100] proposed a novel cost-sensitive decision tree method for fraud detection problem. The proposed scheme is focused on minimizing the sum of misclassi-fication cost and developing the strategy of splitting attribute regarding each non-terminal node. Experiment results show that the proposed method outperforms other state-of-the-arts techniques in fraud detection problem. Further, by using an evolutionary algorithm for the selection of classifier and placement of the weights for the fusion process simultane-ously, [88] presented an effective ensemble learning in terms of the basis of a cost matrix for addressing the minority classification performance. The proposed algorithm is using ROC analysis to optimize its parameters rather than a fixed cost matrix. Experiments on various of imbalanced data demonstrated the useful of the proposed scheme.
Besides, neural networks (NN)-based cost-sensitive learning [89,101–103] is also widely studied in the community of class imbalance. In general, there are four ways of introducing
cost sensitivity to neural networks: probabilistic estimate-based cost sensitivity; neural net-work outputs-based cost sensitivity; learning rate based and error minimization function-based cost sensitivity, all such scenarios are studied in [101]. Firstly, the probability es-timation regarding the neural network output has been adaptively modified by integrating the classification cost factors into test step. Then, another scheme is to change the output of the neural network [103], which means the outputs of the neural network are modified in order to focus more on the easily misclassified class. In addition, cost-sensitive factors can also be utilized in modifying the learning rate in order to keep a balance in training time by assigning more attention on costly samples and decrease the learning rate in regard to each costly sample. Finally, one can make use of the expected cost minimization function to replace the error-minimizing function [101].
Although we have recalled some sensitive methods, there are still much cost-sensitive learning for dealing with class imbalance problem. For example, meta cost [47], adjusting misclassification costs algorithm [94], and kernel-based one-class classifier via optimizing its parameter [104]. The use of cost-based soft-margin maximization method [79], which is used to penalize certain misclassified examples and treats the positive and negative example differently. Least Squares Fuzzy One-class [105] and Near-Bayesian SVM [106]. Readers who are interested can refer to these works for a broader overview.
2.1.3
Ensemble Approaches
Using ensemble learning to boost classifier’s performance has been widely used for a long time. Many works have reviewed such learning from various perspective [27, 29, 107, 108]. Basically, ensemble learning can be generally grouped into bagging family-based ensemble learning, boosting family-based ensemble learning, and random forests.
The idea of Bagging is to train multiple classifiers based on different inputs either us-ing iteration of bootstrap samplus-ing methods upon trainus-ing samples or by usus-ing different weights for the observations, and majority voting is used for final decision making. The us-ing of baggus-ing can reduce the variance of the mean squared error (MSE) and significantly improve the classification performance. However, since bootstrap sampling works upon the unlabelled data, in this case, the class imbalance still holds when using the bagging method. To overcome this shortage, various approaches have been proposed, which in-cludes: Asymmetric Bagging(asBagging) [59], SMOTEBagging [53], Over Bagging [53], Underbagging [54], Roughly Balance Bagging(RB Bagging) [52], EasyEnsemble and Bal-anceCascade [62], Lazy Bagging [55], features selection-based ensemble [109], asBag-ging FSS(ABSF) [59], Local-and-Over-All Balanced BagasBag-ging [110], Neighbourhood Bal-anced Bagging [111], Improved Asymmetric Bagging [60]. Generally, asBagging improve the SVM classification performance based on the many bootstrap iterations. In each iter-ation, asBagging initially keeps the minority class samples, and derives the same number of majority samples for training the model. SMOTEBagging first re-distribute the imbal-anced data using SMOTE, and then apply bagging to the majority class. Over Bagging is a method that using random oversampling for the minority class samples on the each iter-ation. In RB Bagging, the full minority class samples are maintained, while the number of majority class samples are determined by a negative binomial distribution. EasyEnsemble first partitions the majority class into several subsets, and then combine each of the divided subsets with the minority class to form a new training data for learning, while BalanceCas-cade iteratively removes the correctly classified samples, by doing so the classifier would be more sensitive to the misclassified samples in the next prediction process. Consider-ing the nearest neighbours of the unlabelled samples usually provide helpful information
for enhancing the classification performance, Lazy Bagging only utilizes bagging to the identified k nearest neighbours. In order to draw more minority class samples, a Local-and-Over-All Balanced Bagging has been developed by taking the radical probabilities of sampling examples into account, and experiments have shown competitive results of the proposed Local-and-Over-All Balanced Bagging method. Later, a new ensemble algorithm called asBagging FSS(ABSF) [59] which combining asymmetric bagging ensemble clas-sifier and feature subspace, is proposed by Yu and Ni. Realized that local characteristics of the minority class distribution often very helpful in improving the classification per-formance, Neighbourhood Balanced Bagging method has been presented modifying the sampling probabilities from the training data in terms of the class distribution. In addition, Wang and Shao argued that current SVM-based learning often encounter some problems such as small size of the sample and long feedback cycle, to address these problems, they provide an Improved Asymmetric Bagging by applying a new fuzzy SVM. Experimental results illustrate that the retrieval efficiency and retrieval precision can be improved Im-proved Asymmetric Bagging.
Another category is boosting-based family study [112] includes: RUSBoost [65], SMOTE-Boost [61], RareSMOTE-Boost [113], AdaSMOTE-Boost [114], LPSMOTE-Boost [66], integrated sampling tech-nique with an ensemble of SVMs [115], boosting ensemble of SVMs [115, 116] Ranked Minority Over-sampling in Boosting (RAMOBoost) [64], and even comparative study of boosting ensemble [117]. RUSBoost algorithm is to make use of RUS to form several subsets which contains the same number of minority and majority class samples, and the classification model is built based on each subset. In order to avoid the minority class be-ing over-trained, Chawla et al [61] proposed a SMOTEBoost method for addressbe-ing the class imbalance problem. Instead of increasing the weight for the minority class samples,
SMOTEBoost algorithm is mainly focused on generating some synthetic minority samples for the minority class using SMOTE method. In [113], a different treatment of minority and majority predictions has been presented, in which the weights of correctly classified samples will be decreased if the accuracy is greater than 50%. Some other algorithms such as SVM-based boosting ensemble either combine an integrated sampling method with an ensemble of SVM or by taking the excessive bias obtained by soft margins SVM into ac-count. Further, realizing that many real-world solutions usually cannot achieve a robust efficiency due to the complex characteristics of the datasets, to alleviate this issue, Chen et al. [64] presented a RAMOBoost learning method. Given an imbalance dataset, RAMO-Boost adaptively modifies the samples weights based on the data distribution. Experiments across 19 real-world datasets emphasized the effectiveness of the RAMOBoost algorithm.
Finally, Random Forest (RF) [118] which is a well-known decision tree ensemble based on bagging, is popularised used in class imbalance problem [23, 26, 119–121]. There are two kinds of RF: balanced random forest (RBF) and weighted random forest (WRF). For BRF learning, it obtains the minority samples using bootstrap at each iteration; after that, the same number of majority class samples will be extracted and combined with the sam-pled minority class to form a training data; then, train a model with each bootstrap sample, and finally, majority voting is using for the decision-making. Differently, WRF will con-sider the classes’ weights during learning process, which means there is a penalization for the misclassified minority class samples. Finally, a weighted majority vote is used for decision-making. RF has been used many research areas such as: disease diagnosis [122], civil war onset prediction [123], DNA-binding sites in proteins prediction [124], ecological data mining [125].
2.1.4
Other Approaches
To deal with the class imbalance problem, other kind of approaches such as active learning and kernel-based methods, have been proposed recently.
Previously, active learning is used to solve problems of unlabelled data. However, nowadays, researchers have developed many approaches using active learning for imbal-anced datasets [72, 73, 126–128]. For instance, to reduce the computational cost of SVM when dealing with big imbalanced datasets, [127], [72] proposed an active learning strat-egy which can effectively choose most useful instances from a given dataset rather than searching the entire given dataset space. Li et al. [128] proposed an active co-selecting approach for classifying imbalanced sentimental data. classification. The proposed co-selecting approach initially trains two complementary classifiers with two disjoint feature subspaces. The trained classifiers are then used for selecting the most useful positive class instances by leveraging a certainty measurement and an uncertainty measurement. At the same time, it automatically labels the these selected instances, which reduced the effort for humans. In [73], a unified active learning model has been proposed for discovering rare categories classifying new categories by adapting query criteria online. Considering the shortage of time-consuming and the setting proper values misclassification cost arise during the training process, Zieba and Tomczak [129] proposed a boosted SVM with active learning used for dealing with imbalanced data by taking the ratio between negatives and positives into accounts. Each of the based learners in the boosted SVM is built based on a selected samples, which are situated near the borderline. In [74], an active learning for noisy labelling imbalanced multiple data scheme has been presented. This method first reduces the class membership from the multiple noisy label set regarding each sample of the training set using a positive threshold. Then, three label strategies which are based on
uncertainty derived from multiple labels, uncertainty derived from the learned model and the combination method, have been provided for improving the classification performance. In addition, kernel-based methods also have been proposed for imbalanced data learn-ing [68, 71, 130–133]. To alleviate the decreased classification performance problem when using SVM classifier, a kernel-boundary-alignment (KBA) method which is based on mod-ifying the kernel matrix according to the imbalanced data distribution, has been proposed [131], [68]. KBA method employs the adaptive conformal transformation (ACT) methodol-ogy, in which the feature-space distance and the class imbalance ratio is considered during the conformal transformation regarding a kernel function. By modifying the kernel matrix in the feature space, the KBA algorithm can improve the imbalanced data learning issue. The theoretical analyses and empirical studies demonstrate that the effectiveness of the proposed KBA algorithm. In [130], a new two-class kernel based classification method has been developed using orthogonal forward selection (OFS). The kernel classifier is com-posed of two elements for dealing with the class imbalance problem. The first element combines the idea of leave-one-out (LOO) cross-validation and area under curve (AUC) evaluation metric to form a unified LOO-AUC objective function which is used as a se-lection mechanism for the most optimal kernel model, while the second one employs a forward regularized orthogonal weighted least squares algorithm to assign greater weight to misclassified data samples in the positive class.
2.2
Missing Values
Missing values in real world data often cause serious problems for machine learning and knowledge discovery [7], [31]. One simple strategy is ‘complete case analysis’ that ignores the observations with missing values and uses only the complete case data. The other
strategy is recovering the missing values [134]. In this section, we give a short review on the recent progress. For detailed reviews on missing values techniques, please refer to [7, 135].
Many methods have been proposed to impute the missing values [136], [30], [134], [135]. The recovery/imputation approach [7, 31] aims to construct a predictive model to estimate absent values according to the information provided by the dataset. The existing imputation methods can be categorized into two groups [137]: traditional statistical im-putation methods and soft computing methods with machine learning. The typical statis-tical methods including hot-deck imputation and regression substitution recover the miss-ing value with the similar data among the historical data. A simple way is to recover a missing value with the mean/mode of features upon all the training data. Nevertheless, the mean/mode imputation usually makes the distribution more peaked around the mean and has negative impacts to the variance. To address this problem, some advanced meth-ods [136], such as linear regression imputation [138], multiple imputation [139] and Ex-pectation Maximization (EM)-based algorithm are proposed. Regression imputation uses the observed data to estimate the continuous missing values. EM algorithm is an itera-tive procedure, which uses the observed values to impute a missing value (Expectation) and checks whether the recovered value are most likely (Maximization). If not, EM al-gorithm re-estimates a more likely datum until it reaches the most likely value [30]. In addition, multiple imputation (MI) [139] is another common method for missing data re-covery. MI replaces each missing value by M simulated values [140]. The statistical analyses are performed across theM complete datasets. Then, these results are combined to produce the final estimation such as the average of theM imputations [140]. However, the regression imputation could underestimate the missing values when the observed data