A R K A N S A S A G R I C U L T U R A L E X P E R I M E N T S T A T I O N
Division of Agriculture
University of Arkansas System
December 2005
Research Report 977
John Nwoha, Bruce L. Ahrendsen, Bruce L. Dixon,
Eddie C. Chavez, Sandra J. Hamm, Daniel M. Settlage, Diana Danforth
Direct Farm Loan Program
Effectiveness Study
African American/Black Hispanic/Latino All Farms All SDAs SDA Ethnic Female United States P e rc e n t E lig ib le 40 35 30 25 20 15 10 5 0Farm Service Agency Direct Farm
Loan Program Effectiveness Study
John Nwoha
Bruce L. Ahrendsen
Bruce L. Dixon
Eddie C. Chavez
Sandra J. Hamm
Daniel M. Settlage
Diana Danforth
Department of Agricultural Economics and Agribusiness
University of Arkansas, Division of Agriculture, Fayetteville
This research was supported by Cooperative State Research, Extension, and Education Service (CSREES) Award number 2004-39528-14476 between the Farm Service Agency and the Department of Agricultural Economics and Agribusiness at the University of Arkansas, Division of Agriculture, Fayetteville. The views expressed herein are those of the authors and do not necessarily reflect the views of the University of Arkansas or the Farm Service Agency of the United States Department of Agriculture. The authors are, respectively: program associate, associate professor and project principal investigator, professor and co-principal investiga-tor, program associate, program associate, University of Arkansas, Division of Agriculture at Fayetteville; assistant professor, University of Arkansas at Fort Smith; and program associate, University of Arkansas, Division of Agriculture at Fayetteville.
University of Arkansas Division of Agriculture
Arkansas Agricultural Experiment Station
This is the final report on the project titled “Farm Service Agency Direct Farm Loan Program Effectiveness Study” funded through Cooperative State Research, Extension, and Education Service (CSREES) award num-ber 2004-39528-14476 between the Farm Service Agency (FSA) and the Department of Agricultural Economics and Agribusiness at the University of Arkansas, Division of Agriculture, Fayetteville.
The first part of the report focuses on Objective 1 of the study, which is to identify groups being served by FSA Direct Farm Loan Programs. This objective is concerned with how consistently FSA is serving its vari-ous targeted groups relative to its mission. The second part of this report discusses the results of Objective 2, which examines the length of time borrowers remain in the FSA Direct Farm Loan Programs and how fre-quently direct borrowers “graduate” to conventional sources of credit. Part three of the report considers Objective 3, which measures and examines ways of reducing loan subsidy rates. The scope of Objective 3 is limited to identifying ways to lower loan reorganization and default costs.
In accordance with the contract stipulations for the funding of this project, a preliminary report was submit-ted to FSA on July 29, 2004. Partial findings on Objective 1 were given in the preliminary report. The pres-ent report revises some of the findings in the preliminary report and provides additional findings. Charles Dodson and Steven Koenig of FSA provided comments on the preliminary report and a draft of the final report. Many of their comments have been incorporated into this report.
Data from the National Agricultural Statistics Service (NASS) and the Economic Research Service (ERS) Agricultural Resource Management Survey (ARMS) provide vital information for this study. Farm popula-tion counts from NASS and detailed financial characteristics of FSA loan recipients by relevant groupings from the ARMS were vital to this study. We acknowledge the assistance of James Burt of NASS and Charles Dodson of FSA in obtaining Census of Agriculture data. We acknowledge and extend our appreciation to Robert Dubman of ERS who has been extraordinarily helpful in processing the memorandum of understand-ing (MOU) between the ERS and the University of Arkansas, in constructunderstand-ing data sets used by the research team at the Arkansas Agricultural Statistics Office in Little Rock, Arkansas, and also in providing statistical computations that eased the team’s computational burdens. We thank Charles Dodson and Steven Koenig of FSA for their guidance and assistance at various stages of the project. The team also wishes to thank Ben Klugh and Doug Rundle of the Arkansas Agricultural Statistics Office who provided expertise, access, and a work environment conducive to analysis of the ARMS data set in their Little Rock offices. Edward Gbur and Kevin Thompson of the University of Arkansas Division of Agriculture provided much-appreciated statisti-cal expertise. Many FSA personnel provided help in this study. In particular, we thank Connie Holman, Charles Dodson, Steve Koenig, Kathleen Miller, Lonnie Ewing, Rebecca Carpenter, Veldon Hall, Ed Zera, Jim Bolego, and Ellen Sachs and her DLPESA group who coordinated and implemented the FSA borrower survey. We also thank Nan Ma, our graduate research assistant, for preparing the GIS maps and other technical assis-tance. The technical editing provided by Camilla Romund is appreciated. Responsibility for errors in analy-sis and interpretation of findings lies solely with the research team.
This final report presents the results of an independent, performance-focused review of the effectiveness of Farm Service Agency (FSA) Direct Farm Loan Programs (FLPs) as requested by the Office of Management and Budget (OMB) in the 2005 Passback for FSA. The study focuses on FSA’s direct Farm Ownership (FO), Farm Operating (OL), and Emergency (EM) loan programs.
The study has three major objectives: (1) identify groups being served by FSA Direct Farm Loan Programs, (2) examine the length of time borrowers remain in the direct FLPs and the proportion of borrowers who exit or “gradu-ate” from the programs, and (3) measure and identify ways of reducing loan subsidy rates. The first objective required examining characteristics and creditworthiness of recent borrowers to determine if they are consistent with the creditworthiness of groups targeted by the direct FLP mis-sion. The second objective measured duration of loans and how many borrowers exited FLPs and graduated to commercial sources of credit. The third objective empha-sized reducing FSA’s loan restructuring and default costs. This independent study was undertaken by a team of researchers in the Department of Agricultural Economics and Agribusiness at the University of Arkansas, Division of Agriculture, Fayetteville. The award for the project con-tract (CSREES Award number 2004-39528-14476) was finalized on June 14, 2004, with the goal of having a final report by June 2005. A preliminary report on the first objective was delivered to FSA’s FLP staff on July 29, 2004. Where feasible, FSA worked conscientiously with the research team by providing data and explanations as requested. FSA also provided reviews of the preliminary report and an early draft of this final report. While the team appreciated and incorporated many of the reviewers’ suggestions, this report is independent and is the sole responsibility of the research team. Responsibility for errors in analysis or interpretation of findings lies solely with the research team.
The analysis within the report draws primarily on four dis-tinct data sources for two time periods. Data on individ-ual loans from FSA loan making and servicing databases were obtained for fiscal years (FY) 1994–1996 and FY 2000–2003. The other three sources are USDA’s Agricultural Resource Management Survey (ARMS) for 2000–2003, the 2002 Census of Agriculture, and a survey designed by the research team and administered by FSA staff of a sample of direct loans originated in FY 1994–1996.
Objective 1: Identify Groups Being Served by FSA Farm Loan Programs
•
Direct FLPs are primarily serving family-sized farms. An estimated 78–92 percent of FLP Direct Loan recipients in FY 2000–2003 were farms with annual gross sales less than $250,000, a common definition for a small farm. The caps on the total amount of indebtedness a borrower can incur in the programs plus loan eligibility criteria appear to ensure that the clienteles of these programs are consistent with FSA’s mission. Most borrowers had weak financial characteristics and would likely have had difficulty obtain-ing loans elsewhere.•
There is substantial geographical dispersion in the inten-sity of FLP loan use by loan type (FO, OL and EM). Loan size (principal) also differs among regions. The regional dispersion of FO and OL loans appears driven, in part, by the distribution of farmers eligible for FSA Direct Loans. In this report, EM loans are not evenly distributed geo-graphically because demand for these loans was driven pri-marily by the location and intensity of natural disasters during the study period.•
Approximately 37 percent of all U.S. farms are estimated as the target market for FSA Direct Loans when farm size, credit needs, years of farming experience, and farming as an occupation rather than a hobby are taken into account. This is due largely to the large number of “hobby farms” that are not the target of FLPs.•
Market penetration, measured as the proportion of the target market for FSA Direct Loans that actually received FSA Direct Loans for FY 2000–2003, varies considerably across states, with the national average rate for all direct loans being 3.7 percent. Rates for any of the major FSA cohorts are below six percent. The majority of the states have rates less than 8.0 percent, ranging from 0.4 percent to 21.5 percent. These penetration levels may seem low but penetration as defined in this study refers only to bor-rowers originating new loans during FY 2000–2003. Based on estimates from ARMS data, market penetration increases by approximately a factor of five if all existing FSA FLP borrowers are included. Increased market pene-tration would require more obligation allocation or smaller loan amounts.•
FSA borrowers are in a weaker financial position (less creditworthy) than their non-FSA (farms with no FSA debt) counterparts as indicated by lower farm solvency, liquidity, repayment capacity, and financial efficiency. However, no significant differences in gross cash farm incomes, net cash farm incomes, and net farm incomes between FSA borrowers and non-FSA operators were found. The data suggest that direct loans on average are supporting farmers who would likely fail to meet conven-tional lending standards and hence would have trouble securing credit from private-sector sources at reasonable rates and terms.•
Direct FLPs provide less than 4 percent of the total farm debt in the U.S. But since FLPs are targeted to family farms, an estimated 18 percent of indebted non-hobby farmers and beginning farmers were found to rely on direct FLP loans for at least a portion of their credit needs. Given that these recipients were found to typically have weakness in their financial profiles and likely would have difficulty qualifying for commercial credit, the direct FLPs are largely servicing the intended clientele based on the agency’s mission.•
Socially Disadvantaged (SDA) farmers tend to be geo-graphically concentrated in southwestern and southeast-ern states. FSA market penetration rates into the SDA market are generally highest in states where SDAborrow-ers are clustered. In these regions a higher percentage of loans go to SDA borrowers than in the northern regions. Average national market penetration of SDA loans is 4.6 percent compared with a penetration ratio of 3.7 percent in the family farm market. Hence, penetration is greater for SDA operators than the overall family market.
•
In general, race-based SDA borrowers appear to be finan-cially comparable to non-SDA farmers, except for SDA race borrowers being more solvent. FSA targeting has, most probably, enabled more SDA borrowers to obtain FSA credit than they otherwise would. Targeting beginning farmers likely restricts allocations available to non-begin-ning farmer borrowers.•
SDA gender (female) farms exhibit statistically signifi-cant differences in financial characteristics from both the non-SDA and SDA race farms. SDA gender farms are sig-nificantly smaller and exhibit sigsig-nificantly less income but higher solvency than non-SDA farms. Differences in liq-uidity, repayment capacity, and financial efficiency between the two groups are not statistically significant. FSA Direct Loan market penetration for female farms is 2.6 percent.•
Beginning farmers operate significantly smaller farms (in terms of acres operated and gross cash farm income). As expected from their small sizes, they have significantly lower total incomes, assets, liabilities, and net worth levels. With their limited financial resources, size, and experience, beginning farmer borrowers are unlikely candidates for conventional credit.•
FSA is required to target 35 percent of OL allocations and 70 percent of FO allocations to beginning farmers. Thirty-eight percent of the OL loan dollar volume went to begin-ning farmer borrowers and 69 percent of FO loan dollar volume went to beginning farmer recipients over FY 2000–2003.Objective 2: Length of Time Borrowers Remain in Program and Type of Exit
•
An estimated 78 percent of direct FLP loans that origi-nated from FY 1994–1996 were termiorigi-nated (paid back or otherwise settled) by November 30, 2004. More than halfof the borrowers who originated loans during FY 1994–1996 no longer had any active OL, FO, or EM loans by November 30, 2004. The analysis did not identify if there is a cohort oflong-termFLP participants.
•
Loan termination was much more frequent for OL and EM loans than for FO loans. Duration times to termina-tion were close to the term lengths for OL loans paid in full, and were between five and six years for EM loans although a larger proportion of these loans remain to be terminated.•
An estimated 53.4 percent of the terminated FY 1994–1996 loans had borrowers who exited FLPs and con-tinued farming. Twenty-four percent of the terminated loans had borrowers who exited the FLPs and left farming voluntarily other than for retirement, and 6.9 percent of the loans had borrowers who retired. The remaining loans were terminated due to leaving farming involuntarily (11 percent) or due to death (5 percent). Among the 53.4 per-cent who continued farming, only 17 perper-cent of these loans had farmers who graduated to FSA guaranteed cred-it and the remainder graduated by continuing farming and using conventional credit (65 percent) or no credit at all (18 percent).•
Consistent with other findings about FO loans, FO bor-rowers were least likely to exit. Also, borbor-rowers who had larger numbers of other active FSA Direct Loans and high-er debt-to-asset ratios at time of loan origination whigh-ere less likely to exit FLPs. Borrowers with more direct loans may have a greater need for FLPs.•
The evidence on change in financial well-being is mixed but generally positive. Annual changes in net worth were positive and significant. Rising farmland values over this period undoubtedly contributed to this. Debt-to-asset ratios increased over time, which could indicate that the relatively young borrowers are in an expansion phase and acquiring new debt to support their operations. Current ratios did not change significantly over time for the sam-pled borrowers. These findings on financial characteristics coupled with the majority of borrowers leaving FLPs to continue farming or leave voluntarily indicate financial progress.•
For the most part, it appears FSA borrowers are using direct loans as a temporary credit source. A majority of the loans were paid back without a loss. A majority of borrow-ers did not become permanent clients of FSA.Objective 3: Measuring and Reducing Subsidy Rates
•
The amounts and percentages of direct FLP loan losses have generally trended downward over the FY 1994–2004 period. FO loans had a lower average annual loss percent-age (2.0 percent) than OL (5.3 percent) and EM (13.2 per-cent) loans. FO loans are secured with real estate while OL and EM loans may be secured with either real estate or non-real estate assets, but primarily non-real estate assets. In general, during the study period, farmland values rose steadily, thereby greatly decreasing the likelihood of FSA sustaining material losses on farm ownership loans.•
An estimated statistical model shows the likelihood of a loan loss is positively related to borrowers with previous debt settlement experience with FLPs, indicating that loan restructuring activities are generally more likely to result in a loan loss. Farms found to be at greater risk of having their loans end in a loss—and hence increasing program costs—include those with higher relative indebtedness, less repayment capacity, less liquidity, crop farms, and larger farms. The likelihood of a loan loss is negatively related to borrowers already having or receiving an FO loan. The likelihood of a loan loss is not found to be significantly related to borrowers receiving limited resource rates (subsi-dized interest) or to those classified as socially disadvantaged.•
An estimated regression model indicates that, when a loan loss occurs, the amount of loan loss as a percent of the original loan amount is positively related to beginning farmer loans and negatively related to borrowers receiving FO and OL loans and having greater repayment capacity. The beginning farmer loan relationship indicates loan losses relative to loan amounts are greater for beginning farmer loans than non-beginning farmer loans.•
The loan loss analysis suggests the following options to reduce loan loss occurrence: reject applicants who have had previous debt settlement experience (i.e., adhere strictly to the existing one-time debt forgiveness policy);grant loans to borrowers who already have FO loans; require increased collateral and stronger financial stan-dards, and continue to concentrate on lending to small farms. However, in addition to reducing loan losses, these options would greatly reduce the number of farmers receiving FSA loans.
•
A consistent policy requiring farmers to purchase insur-ance in order to receive farm program payments and qual-ify for emergency assistance should limit the demand for emergency loans and thus the rate of loan losses. Crop insurance and additional collateral beyond the crop itself would likely mitigate loan loss rates.•
There are several options to decrease loan loss rates such as: increase the proportion of FO and OL loans relative to EM loans; decrease the number of beginning farmer loans (i.e. the group of farmers most likely to be denied credit from conventional creditors due to limited experience, lack of track record, and inadequate equity); and restrict loans to farms with less than a specified repayment capacity (many existing FSA recipients with low repayment capaci-ty would instead be denied credit). In general, such activ-ities would run counter to the role of FLPs—i.e. making credit available to farm operators on the financial margin.Limitations
A primary study goal was to measure the market for FSA Direct Loans. While the majority of U.S. farms were des-ignated ineligible, we believe far too many farms were left in the eligible pool. Yet, to be consistent with precedent in the literature, the eligibility criteria were minimal. Hence, estimated penetration ratios seem low.
The study did not focus on identifying and estimating a subset of long-term (“life-time”) FLP borrowers. Such research would require much different data than those col-lected in this study. To the extent that there are such bor-rowers, a detailed analysis would need to be conducted to determine the attributes of such borrowers and how the life-time cycle could be ended.
FSA would further like to lessen losses and the need to do loan restructurings. The data collected do not explain the
occurrence of such events as well as better data probably could. Personal events such as medical emergency, change in marital status, and loss of off-farm employment are probably important factors explaining the occurrence of these losses. Collection of such data would go far beyond what FSA does in its loan application and Farm and Home Plans. Perhaps a longitudinal panel of sample borrowers would help FSA to better understand the dynamics of its borrowers.
The estimates of loan terminations and loan losses are biased downwards. More loans were terminated than reported here, but our assumptions bias this estimate downward. An ability to track loans through their various restructurings and consolidations would have made the termination estimates more exact. Loan losses for the FY 1994–1996 loans will increase as some currently active loans encounter financial difficulties in the future. The Farm and Home Plan data used have some quirks. In particular we strongly believe that zeroes were entered where an observation was potentially missing. We assumed the zeroes in such instances were, in fact, missing data. Also, although we treated the Farm and Home Plan data as completely representative of the FY 2000–2003 borrowers, only 43 percent of the loan originators were paired with a Farm and Home Plan.
The data in the survey of FY 1994–1996 loans had to be “cleaned.” Observations that appeared as data entry errors or implausible guesses were changed to missing observa-tions. Questions in the survey answered as “unknown” were also set to missing. Such practices are common in the use of primary data. The inferences from the data are con-ditional upon these actions.
Estimates based on ARMS data identifying FSA borrowers are likely biased downwards. In ARMS farm operators only report five of their loans. If they have six or more loans, these extra loans are not reported. A farm operator with six or more loans could have omitted all FSA loans and therefore be counted as a non-FSA Direct Loan partic-ipant even though they had an FSA Direct Loan.
TABLE OF CONTENTS . . . ix
LIST OF FIGURES . . . x
LIST OF TABLES . . . xii
FINAL REPORT INTRODUCTION . . . 1
1. GROUPS BEING SERVED BY FSA DIRECT FARM LOAN PROGRAMS. . . 1
1.1. FSA Mission and History, and Data Sources for Study . . . 1
1.1.1. Farm Service Agency Mission . . . 2
1.1.2. History of Federal Farm Credit Assistance . . . 2
1.1.2.1. The Early Years . . . 2
1.1.2.2. Farmers Home Administration . . . 3
1.1.2.3. Farm Service Agency. . . 4
1.1.3. Data Sources . . . 5
1.1.4. Current Agricultural Lending Trends. . . 6
1.2. Demographics, Location, and Volume of FSA Direct Loans, FY 2000–2003 . . . 7
1.2.1. FSA Direct Loans to All Borrowers. . . 7
1.2.2. FSA Direct Loans to Family Farm Borrowers . . . 12
1.2.3. FSA Direct Loans to Small Family Farm Borrowers . . . 13
1.2.4. FSA Direct Loans to SDA Borrowers . . . 14
1.2.5. FSA Direct Loans to Beginning Farmer Borrowers . . . 24
1.3. FSA Direct Loan Market Penetration . . . 28
1.3.1. FSA Penetration in Family Farm Markets . . . 30
1.3.2. FSA Penetration in Small Family Farm Markets. . . 34
1.3.3. FSA Penetration in SDA Farm Markets . . . 35
1.3.4. FSA Penetration in Beginning Farmer Markets . . . 38
1.3.5. Summary of Market Penetration for FSA Direct Loan Programs. . . 39
1.4. Financial Characteristics of FSA Borrowers . . . 42
1.4.1. Comparative Financial Characteristics of FSA Eligible Farmers . . . 43
1.4.2. Comparative Financial Characteristics of SDA and Non-SDA Farmers. . . 46
1.4.3. Comparative Financial Characteristics of Beginning Farmers . . . 48
1.4.4. Comparative Financial Ratios among FSA Direct Loan Borrower Groups . . . 52
1.5. Alternative Creditworthiness Standards for FSA Borrowers . . . 57
1.5.1. Using Solvency as a Creditworthiness Standard . . . 57
1.5.2. Using Repayment Capacity as a Creditworthiness Standard . . . 60
1.5.3. Impact of Using Stricter Creditworthiness Standard . . . 62
1.6 Summary . . . 63
2. DURATION IN FARM LOAN PROGRAMS AND FINANCIAL PROGRESS . . . 65
2.1. Survey of Borrowers Originating FSA Direct Loans During FY 1994–1996 . . . 65
2.1.1. Sampling Strategy and Geographical Distribution . . . 66
2.1.2. Borrower Demographics . . . 70
2.1.3. Borrower Balance Sheet Characteristics. . . 70
2.1.4. Borrower-Expected First Year Cash Flows . . . 73
2.1.5. Past Use of FSA Loans and Credit History Characteristics . . . 73
2.2. Duration and Graduation. . . 75
2.2.1. Identifying a Loan’s Termination Status . . . 75
2.2.2. Overall Loan Termination Rates and Length of Terminated Loans . . . 76
2.3.2. Modeling Issues . . . 84
2.3.3. Empirical Model Specification . . . 84
2.3.4. Analysis of Estimated Model. . . 87
2.4. Borrower Progress Measured by Changes in Financial Characteristics. . . 91
2.4.1. Measuring Change . . . 91
2.4.2. Outlier Observations . . . 92
2.4.3. Empirical Results: Change in Net Worth . . . 92
2.4.4. Empirical Results: Change in Current Ratio . . . 94
2.4.5. Empirical Results: Change in Debt-to-Asset Ratio . . . 96
2.5. Summary . . . 96
3. MEASURING AND REDUCING SUBSIDY COSTS . . . 97
3.1. Recent Loan Loss Experience for FSA Direct FLPs . . . 98
3.2. Direct FLP Subsidy Rates . . . 101
3.3. Factors Associated with Loan Losses. . . 104
3.3.1. Technical Presentation of the Incidental Truncation Model . . . 104
3.3.2. Empirical Model Specification . . . 105
3.3.3. Estimation Results for the Loan Loss Selection Equation . . . 108
3.3.4. Estimation Results for the Loss Percentage Regression Equation . . . 110
3.3.5. Implications of the Loan Loss Estimations . . . 111
3.4. Summary . . . 113
CONCLUSIONS . . . 114
REFERENCES. . . 115
APPENDICES . . . 118
Appendix 1.A. Abbreviation Definitions . . . 118
Appendix 1.B. Definitions of Targeted Groups. . . 119
Appendix 1.C. Matching Farm and Home Plans to Borrowers in the New Loan Database. . . 120
Appendix 1.D. FSA borrower financial data by loan type. . . 121
Appendix 2.A. Survey Sampling, Data Collection, and Data Cleaning . . . 122
2.A.1. Sorting the Sampling Frame Prior to Sampling . . . 122
2.A.2. Sampling Algorithm . . . 123
2.A.3. Data Collection . . . 123
2.A.4. Data Cleaning . . . 125
Appendix 2.B. Survey Instrument and Drop Down Codes. . . 127
2.B.1. The Survey Instrument. . . 127
2.B.2. Alternatives in Survey Drop Down Boxes . . . 132
2.B.3. Assistance ID and codes: FY 1994-1997 FSA loans . . . 135
List of Figures Figure 1.1. Share of total farm business debt by originating lender, 1960–2003 . . . 7
Figure 1.2. Share of total FSA farm business debt: direct vs. guaranteed loans, 1982–2002 . . . 8
Figure 1.3. Average direct loan size vs. average guaranteed loan size, FY 2000–2003 four year average . . . 8
Figure 1.4. FSA Direct OL, FO, and EM borrowers, FY 2000–2003. . . 9
Figure 1.5. FSA Direct OL borrowers, FY 2000–2003 . . . 10
Figure 1.6. FSA Direct FO borrowers, FY 2000–2003 . . . 10
Figure 1.7. FSA Direct EM borrowers, FY 2000–2003. . . 11
FY 2000–2003. . . 19
Figure 1.12. Distribution of African American or Black farmers receiving FSA Direct loans, FY 2000–2003 . . . 19
Figure 1.13. Distribution of Asian farmers receiving FSA Direct loans, FY 2000–2003 . . . 20
Figure 1.14. Distribution of Native Hawaiian or Other Pacific Islander farmers receiving FSA Direct loans, FY 2000–2003. . . 20
Figure 1.15. Distribution of Hispanic or Latino farmers receiving FSA Direct loans, FY 2000–2003 . . . 21
Figure 1.16. Distribution of Women receiving FSA Direct loans, FY 2000– 2003 . . . 21
Figure 1.17. Percentage of FSA OL and FO loans made to SDA borrowers, FY 2000–2003 . . . 22
Figure 1.18. Percentage of FSA OL loans made to SDA borrowers, FY 2000–2003 . . . 23
Figure 1.19. Percentage of FSA FO loans made to SDA borrowers, FY 2000–2003 . . . 23
Figure 1.20. Average FSA loan size by type and USDA production region for beginning and non-beginning farmers, FY 2000–2003 four year average. . . 24
Figure 1.21. FSA Direct beginning farmer borrowers, FY 2000–2003 . . . 25
Figure 1.22. Percentage of FSA Direct OL and FO loans made to beginning farmer borrowers, FY 2000–2003 . . . 26
Figure 1.23. Percentage of FSA Direct OL loans made to beginning farmer borrowers, FY 2000–2003 . . . 27
Figure 1.24. Percentage of FSA Direct FO loans made to beginning farmer borrowers, FY 2000–2003 . . . 27
Figure 1.25. FSA-eligible farms as a percentage of total farms by cohort, 2002 . . . 31
Figure 1.26. All FSA Direct loans market penetration percentage by state, FY 2000–2003. . . 31
Figure 1.27. All FSA Direct loans market penetration percentage by county, FY 2000–2003 . . . 32
Figure 1.28. FSA Direct OL market penetration percentage, FY 2000–2003 . . . 33
Figure 1.29. FSA Direct FO market penetration percentage, FY 2000–2003 . . . 33
Figure 1.30. FSA Direct EM market penetration percentage, FY 2000–2003 . . . 34
Figure 1.31. FSA Direct SDA FO and OL combined market penetration percentage, FY 2000–2003 . . . 35
Figure 1.32. FSA Direct SDA OL market penetration percentage, FY 2000–2003 . . . 36
Figure 1.33. FSA Direct SDA FO market penetration percentage, FY 2000–2003 . . . 37
Figure 1.34. FSA Direct beginning farmer FO and OL combined market penetration percentage, FY 2000–2003 . . . . 39
Figure 1.35. FSA Direct beginning farmer OL market penetration percentage, FY 2000–2003 . . . 40
Figure 1.36. FSA Direct beginning farmer FO market penetration percentage, FY 2000–2003 . . . 40
Figure 1.37. Combined FSA Direct OL and FO loan allocations vs. obligations, as of September 30, FY 2000–2004 . 42 Figure 1.38. Change in percent eligible borrowers using debt-to-asset ratio as a creditworthiness standard, by loan type, FY 2000–2003 . . . 58
Figure 1.39. Change in percent eligible borrowers using debt-to-asset ratio as a creditworthiness standard, by beginning farmer status, FY 2000–2003 . . . 59
Figure 1.40. Change in percent eligible borrowers using debt-to-asset ratios as creditworthiness standard, by SDA group, FY 2000–2003 . . . 59
Figure 1.41. Change in percent eligible borrowers using repayment capacity as creditworthiness standard, by loan type, FY 2000–2003 . . . 60
Figure 1.42. Change in percent eligible borrowers using repayment capacity as creditworthiness standard, by beginning farmer status, FY 2000–2003 . . . 61
Figure 1.43. Change in percent eligible borrowers using repayment capacity as creditworthiness standard, by SDA group, FY 2000–2003 . . . 62
Figure 2.1. Total unique borrowers included as usable responses to the FSA borrower information survey of FY 1994–1996. . . 68
Figure 2.2. OL borrowers included as usable responses to the FSA borrower information survey of FY 1994–1996 originations . . . 68
Figure 2.3. FO borrowers included as usable responses to the FSA borrower information survey of FY 1994–1996 originations . . . 69
Figure 3.3. FSA percent principal and interest loss rates for FSA Direct loans, by type, FY 1994–2004 . . . 100
Figure 3.4. Estimated subsidy rates for FSA Direct loan programs, by type, FY 1992–2005. . . 103
List of Tables Table 1.1. New FSA Direct loans by type of loan, FY 2000–2003 . . . 9
Table 1.2. Counts of FSA loans, borrowers, and counties by loan cohorts FY 2000–2003 . . . 15
Table 1.3. Grouping of loans based on assistance type, FY 2000–2003 . . . 16
Table 1.4. Counts of loans by loan type for different loan cohorts FY 2000–2003 . . . 16
Table 1.5. Estimated number of FSA-eligible farms by race and gender. . . 38
Table 1.6. Calculated penetration percentages by cohort . . . 41
Table 1.7. Financial characteristics of FSA-eligible farms by debt type, 2000–2003 average. . . 44
Table 1.8. Financial characteristics of FSA-eligible farms by SDA status, 2000–2003 average . . . 48
Table 1.9. Financial characteristics of FSA-eligible farms by beginning farm status, 2000–2003 average . . . 50
Table 1.10. FSA borrower median financial ratios by assistance-type class, FY 2000–2003 . . . 54
Table 1.11. FSA borrower median financial ratios by demographic class, 2000–2003. . . 56
Table 2.1. Gender and race response rates by loan type for survey of FY 1994–1996 loan originations . . . 66
Table 2.2. Basic demographic description of sampled borrowers originating loans from FY 1994–1996 by loan assistance type . . . 71
Table 2.3. Means of farm operation descriptors and balance sheet variables of loan originators by loan assistance type . . . 72
Table 2.4. Means of financial characteristics of the FSA borrowers ' planned business year by loan assistance type . . 74
Table 2.5. FSA borrowers' credit history by loan assistance type . . . 75
Table 2.6. Termination percentages and mean loan length by loan type for FY 1994–1996 sample . . . 77
Table 2.7. Characteristics of loans paid in full at time of survey . . . 78
Table 2.8. Characteristics of terminated FSA loans experiencing losses . . . 80
Table 2.9. Type of exit by loan type for FY 1994–1996 borrowers exiting the FSA Farm Loan Program by November 30, 2004 . . . 81
Table 2.10. Logit model variable definitions . . . 86
Table 2.11. Estimated marginal probabilities for logit model of exit status . . . 88
Table 2.12. Loan activity and financial progress of FY 1994–1996 farm loan program borrowers . . . 93
Table 2.13. Regression explaining variability of annual change in net worth. . . 94
Table 2.14. Regression explaining variability of annual change in the current ratio . . . 95
Table 2.15. Regression explaining variability of annual change in the debt-to-asset ratio . . . 96
Table 3.1. Principal and interest losses for FSA Direct loans, by type, FY 1994–2004 (millions of dollars) . . . 99
Table 3.2. Ex-ante FSA Direct loan subsidies, FY 2000–2003. . . 103
Table 3.3. Incidental truncation model variable definitions. . . 106
Table 3.4. Weighted descriptive statistics of variables in incidental truncation model . . . 107
Table 3.5. Estimated loan loss selection equation by Probit model . . . 108
Final Report
Introduction
As is customary with government programs, there is a need for periodic assessment to determine whether stated goals are met and if changes would be useful to improve program effectiveness. The Office of Management and Budget’s (OMB)1 2005 Passback
for Farm Service Agency (FSA) requested an inde-pendent performance-focused review of the FSA Farm Loan Programs (FLPs) to guide management initiatives for the Direct Farm Loan Program and Fiscal Year (FY) 2006 budget requests. The goal of this study is to provide data and analysis to assist policymak-ers in determining how effectively FSA’s Direct Farm Loan Programs are meeting their stated objectives. The specific objectives of this study are: (1) to exam-ine how effectively the Direct Farm Loan Program is serving family farms in general as well as specifically targeted groups; (2) to evaluate the length of time borrowers remain in the program, to identify the out-comes for borrowers receiving loans in the past, and to identify changes in financial characteristics; and (3) to describe the extent of subsidy use by various cohorts and to determine what steps can be taken to lower these subsidy costs. The results of this study will aid policymakers in determining ways to improve overall program performance, provide FSA officials with information needed to sharpen self-review, and
help characterize the role of FSA Farm Loan Programs in the agricultural credit market.
Effectiveness is evaluated in the context of three objectives. In Objective 1, we examine the history of the FSA, the current trends in agricultural lending, the demographics and location of FSA loan recipi-ents, the targeting of socially disadvantaged and beginning farmers of FSA loans, the financial charac-teristics of FSA borrowers, and the implications of alternative creditworthiness standards.2 In Objective
2, we investigate loan and borrower duration in the FSA Direct Loan Programs and the financial progress of FSA loan recipients over time. In Objective 3, we measure subsidy rates and discuss ways of reducing subsidy rates.
1. Groups Being Served by
FSA Direct Farm Loan Programs
1.1. FSA Mission and History, and
Data Sources for Study
The Direct Farm Loan Programs administered by the Farm Service Agency (FSA) are designed to provide credit to family-sized farms3“unable to obtain credit
from conventional sources at reasonable rates and terms” despite having sufficient cash flow to repay and an ability to provide security for the loan (Dodson and Koenig, 2000, p.1). FSA is an agency of the United States Department of Agriculture
Effectiveness Study
John Nwoha, Bruce L. Ahrendsen, Bruce L. Dixon,
Eddie C. Chavez, Sandra J. Hamm, Daniel M. Settlage, and Diana Danforth
1Definitions of abbreviations used in this study are presented in appendix table 1.A. 2Definitions of targeted groups are provided in appendix table 1.B.
(USDA). FSA’s Direct Farm Loan Program provides short- to intermediate-term farm operating loans (OL) and long-term farm ownership (FO) loans as well as emergency (EM) loans. In addition to serving the general category of family-sized farms, federal legislation compels FSA’s FO and OL lending pro-grams to target specific subgroups falling under the family-farm umbrella. These groups are socially dis-advantaged applicants (SDA) and beginning farmer (BF) applicants.
The FSA defines a socially disadvantaged farmer or rancher as “one of a group whose members have been subjected to racial, ethnic, or gender prejudice because of their identity as members of the group without regard to their individual qualities. For pur-poses of FSA programs, socially disadvantaged groups are women, African Americans, American Indians, Alaskan Natives, Hispanics, and Asian Americans and Pacific Islanders (USDA/FSA, 2004 a). The definition of a BF varies by loan type. For OL purposes, a BF is a farmer who meets the general eli-gibility criteria for an OL loan and has ten or less years of farming experience. For FO purposes, a BF is a farmer who meets the general criteria for an FO loan, has three to ten years of farming experience, and owns acreage that does not exceed 30 percent of the county average farm size.4 If the applicant is an
entity, all members must be related by blood or mar-riage, and all stockholders in a corporation must be eligible beginning farmers (USDA/FSA, 2004 b).
1.1.1. Farm Service Agency Mission
The mission of the Farm Service Agency is: “To help ensure the well-being of American agriculture and the American public through efficient and equitable administration of farm commodity, farm loan, con-servation, environmental, emergency assistance, and domestic and international food assistance pro-grams” (USDA/FSA, 2005). One of the key, stated goals of FSA is to: “Assist eligible individuals and
families in becoming successful farmers and ranch-ers” through the use of the Farm Loan Program (FLP) (USDA/FSA, 2005, p.6). Strategies stated by FSA to achieve this goal are: “1) implement an aggressive supervised credit program, 2) identify and correct borrower performance problems promptly, 3) actively market and sell inventoried properties, 4) aggressively monitor and address processing prob-lems, 5) correct staffing deficiencies and streamline work processes, and 6) continue outreach efforts.” (USDA/FSA, 2005, pp. 7–8).
1.1.2. History of Federal Farm Credit Assistance
Government assistance in providing credit to farmers and ranchers in need began in the early 1900s and evolved into its present form. Several major agencies provided assistance in the twentieth century. These were the Resettlement Administration (1935–1937), Farm Security Administration (1937–1946), and Farmers Home Administration (1946–1994). Currently, the Farm Service Agency (1994–present) is responsible for administering the federal direct and guaranteed loan programs to farmers.
1.1.2.1. The Early Years
From 1918 through 1931, Congress provided Emergency Crop and Feed Loans to farmers who had suffered losses due to floods and droughts in desig-nated areas and were unable to obtain credit else-where (U.S. National Archives and Records Administration, 1995). In 1932, the Reconstruction Finance Corporation (RFC) organized twelve region-al offices cregion-alled the Regionregion-al Agriculturregion-al Credit Corporations (RACC). These offices offered operat-ing loans to farmers and ranchers unable to obtain commercial credit. The Farm Credit Act of 19335
established one Production Credit Association (PCA) in each of the twelve Federal Land Bank districts, and these PCAs assumed the functions of the RACC.
4Prior to 2004, the acreage limit was 25 percent of the county average farm size (U.S. 7 CFR 1943.4).
The Federal Emergency Relief Act of 19336resulted in
the formation of the Rural Rehabilitation Division in April 1934. Its responsibility was the formation of government loan programs in which the borrower would agree to operate the farm under new farming plans developed with the help of the Division’s coun-ty representative (USDA/FmHA, 1991). In 1935, Executive Order 7027 created the Resettlement Administration, which existed for two years. Short-term loans were made to low-income farm families based on a Farm and Home Plan that had been worked out by the borrowing family and the county representatives (USDA/FmHA, 1991). In 1937, the Farm Security Administration took over the respon-sibilities of the Rural Rehabilitation Division with a focus on supervised lending to farmers who could not obtain credit elsewhere.
1.1.2.2. Farmers Home Administration
Under the Farmers Home Administration Act of 1946 (P.L. 60-731), the Farm Security Administration and Emergency Crop and Feed loan programs were consolidated and administered by one new agency called the Farmers Home Administration. Farmers Home Administration was known as FHA until 1974 when the abbreviation was changed to FmHA.7 In
addition to maintaining a system of county offices, FmHA provided many different services to farmers over the years.
Responsibility for federal programs supporting rural growth was transferred to the USDA via the Rural Development Act of 1972 (P.L. 92-419). With this Act, FmHA continued to expand in the area of rural development and was authorized to guarantee loans made by commercial banks for farming, housing, and rural business development in cities with populations up to 50,000. Youth loans for income-producing enterprises managed through school organizations were also authorized in this Act.
The Agricultural Credit Act of 1978 (P.L. 95-334) expanded the eligibility of farm loans to family cor-porations, cooperatives, and partnerships (USDA/FmHA, 1991). The principal limits for FO loans were increased to $200,000 for direct loans and $300,000 for guaranteed loans. OL limits were increased to $100,000 and $200,000 for direct and guaranteed loans, respectively. Special interest rates on direct FO and OL loans (set below the cost of gov-ernment borrowing) were made available to farmers with limited resources (Dodson and Koenig, 1997). FmHA’s EM and OL programs changed with the Agricultural Programs Adjustment Act of 1984 (P.L. 98-258). The limits for new direct OL loans increased from $100,000 to $200,000 and from $200,000 to $400,000 for new guaranteed OL loans. For direct EM or OL loans that were rescheduled or consolidated, maximum repayment time “increased from seven to fifteen years from the date of the orig-inal note” (USDA/ERS, 1991). If a farmer’s county bordered a designated disaster county (for disasters occurring after May 30, 1983), then the farmer became eligible for emergency loans. Twenty percent of direct OL and FO funds was allotted for limited resource borrowers.
Under the Food Security Act of 1985 (P.L. 99-198), the FmHA was mandated to emphasize guaranteed lending instead of direct lending. FmHA could guar-antee up to 90 percent of the principal of the loan made by a qualifying lender (USDA/ERS, 1988). The Agricultural Credit Act of 1987 (P.L. 100-233) changed the way FmHA serviced farm loans. Delinquent loans could be written down if the bor-rower had a plan to continue farming and govern-ment recovery from the restructured loan would be greater than or equal to the amount recovered through foreclosure. The SDA group outreach pro-gram was established to assure that socially disadvan-taged applicants had opportunities to buy or lease
6United States Statutes At Large, 73rd Congress, 1933-1934 Vol. 48, Part 1, Public Laws, Ch. 30, 48 Stat. 55.
7This change was made to easily distinguish Farmers Home Administration from other agencies that have the same initials (USDA/FmHA 1991, p. 6).
inventory farm property (USDA/ERS, 1991). As a consequence of the increased emphasis on guaran-teed loans, direct loan obligations dropped below $1 billion in 1990 while guaranteed obligations increased to $1.3 billion (USDA/ERS, 1991).
Legislation from the Food, Agriculture, Conservation, and Trade Act of 1990 (P.L. 101-624) established a placement program for those borrowers who were eligible to graduate from direct loans to guaranteed loans and placed tighter restrictions on debt restructuring. The Agricultural Credit Improvement Act of 1992 (P.L. 102-554) authorized FmHA to focus on beginning farmers and ranchers and graduating direct loan borrowers to the guaran-teed lending program. To better serve BF applicants, a down payment loan program was established for the direct and guaranteed FO loan programs (USDA/ERS, 1993). To improve graduation rates, lifetime limits for FSA borrowers to receive assistance were established for OL loans. Borrowers became ineligible for insured OL assistance after receiving OL loans for 10 years, and ineligible for guaranteed assis-tance after 15 years (USDA/ERS, 1993).
1.1.2.3. Farm Service Agency
FmHA ceased to exist with the signing of the Federal Crop Insurance Reform and Department of Agriculture Reorganization Act of 1994 (P.L. 103-354). Under this reorganization of USDA agencies, FmHA’s farm credit programs were transferred to the newly formed Consolidated Farm Service Agency (USDA/ERS, 1995). The Consolidated Farm Service Agency was subsequently renamed the Farm Service Agency (FSA) in 1995 (Stam, Wallace, and Koenig, 1997). The policy push to have borrowers graduate from direct to guaranteed loans continued with the Federal Agriculture Improvement and Reform Act of 1996 (1996 Farm Act, P.L. 104-127). This Act nar-rowed the eligibility criteria for applicants. For direct FO loans, the applicant either had to have less than 10 years of FSA borrowing experience or be qualified as a beginning farmer. Direct OL loan applicants had to
have five years or less of farm operating experience or six years or less of direct OL borrowing experience. Direct FO loans could no longer be used to refinance existing indebtedness. For the EM loan program, the maximum total borrower indebtedness was capped at $500,000. Previously the cap only applied to a partic-ular disaster, allowing total EM indebtedness for a borrower to exceed $500,000 (Stam, Wallace, and Koenig, 1997).
The Omnibus Consolidated and Emergency Supplemental Appropriations Act of 1999 (P.L.105-277) raised the caps on borrower indebtedness for the guaranteed Farm Loan Programs. The caps are now adjusted annually as inflation rises. The cap increase is computed by the “Prices Paid by Farmers Index” and is calculated by the National Agricultural Statistics Service (USDA/NASS, 1999). If the index for the immediate fiscal year exceeds the index for the previous fiscal year, the caps are raised. The 1999 guaranteed FO and OL loan program limits were raised to $700,000, although the caps for the direct FO, OL, and EM Farm Loan Programs remained at $200,000, $200,000, and $500,000, respectively. Previously the guaranteed FO and OL loans were capped at $300,000 and $400,000. The maximum total indebtedness allowed for a borrower with guar-anteed loans from one or both programs was set at $700,000 (USDA/ERS, 1999). The current maximum total program indebtedness for guaranteed loans as adjusted for inflation is $813,000 (USDA/FSA, 2004 a). The Farm Security and Rural Investment Act of 2002 (2002 Farm Act, P.L. 107-171) enacted changes in FSA Direct Farm Loan Programs to make borrowing easier. The eligibility time limits for direct OL loans were waived to provide longer access to FSA-funded farm programs (USDA/FSA, 2004 b). Applicants became eligible for FO loans after participating in the operation of a farm for three years, instead of having to have operated a farm for three years. If borrowers had received debt forgiveness as a result of a major emergency or natural disaster declaration in the past,
they could now become eligible for new direct or guaranteed loans. The acreage ownership restrictions for beginning farmer and rancher FO loans changed from no more than 25 percent to no more than 30 percent of the county average farm size. More fund-ing was made available for the beginnfund-ing farmer guaranteed loan program and down payment loans increased from 10 to 15 years and from 30 to 40 per-cent of sale price (USDA/ERS, 2003).
1.1.3. Data Sources
In the sections that follow, we review several aspects of the Direct Farm Loan Program based on activity from fiscal years (FY) 2000–2003. The data examined in this study were obtained from various sources. FSA provided us data from their loan-making data-base, which we refer to as the New Loan Database (NL database) in the remainder of this report. FSA also provided data from its loan-servicing database and a database of Farm and Home Plans (FHP) used in certain sections of this report. Data were also obtained from various issues of FSA Farm Loan Programs Monthly Management Summaries (MMS) published by the USDA/FSA. Additional data were obtained from the 2002 Census of Agriculture con-ducted by the National Agricultural Statistics Services (NASS), and from the Agricultural Resources Management Survey (ARMS) jointly conducted by NASS and the Economic Research Service (ERS). In addition to these secondary data sources, data con-cerning FSA Direct Loan origination activities for FY 1994–1996 were obtained through a national survey of FSA county offices conducted primarily for this study.
FSA’s internal Farm Loan Program Making and Loan Servicing database for FY 2000 – 2003 (New Loan database) provides detailed information about every loan. The database contains information about the borrower (tax identification or social security num-ber, county and state of residence, race, ethnicity, and gender), and the loan (number, type, assistance type, amount, interest rate, origination date, and maturity
date). The database also contains any flags associated with servicing the loan. The database contains a total of 70,923 loans made to 54,984 borrowers dur-ing FY 2000–2003, which represents recent loans. This report focuses on these recent loans even though it would have been possible to consider loans made in earlier years. Our mission was to analyze the effec-tiveness of the current program and going back before 2000 would not be reflective of recent and cur-rent activity. Out of the 70,923 loans in the database, 9,747 were youth loans made to 9,062 youth borrow-ers. Since the focus of this report is not on youth pro-grams, the youth loans were excluded from the GIS maps and other analysis presented in this report. An additional 1,025 loans were removed from the data-base data-based on their assistance-type classification. The NL database used in this report has 60,151 loans and 45,016 borrowers.
In the process of applying for a direct loan, applicants must fill out a Farm and Home Plan (FHP). This plan contains a balance sheet, income statement, and demographic information about the applicant. As part of this study, FSA furnished 117,391 FHPs for some of the 45,016 borrowers who originated loans in FY 2000–2003. It was possible to match 19,153 or 42.5 percent of the borrowers with the most recent FHP they completed prior to obtaining an FSA loan. Financial information extracted from the FHPs of 19,153 borrowers is presented in this report as a gauge of FSA borrowers’ financial characteristics by loan type, assistance type, and demographic groupings.
FSA publishes a summary of the Agency’s loan-mak-ing activities in a yearly internal document titled “USDA Farm Service Agency: FSA Farm Loan Programs Monthly Management Summary.” This document, published every September by the National Office of Farm Loan Programs, contains data on FSA loan-making activity for the current year and also for previous years. This publication, called the Monthly Management Summary (MMS),
provid-ed most of the data usprovid-ed in discussing current FSA agricultural lending trends.
The ARMS is conducted annually by the USDA, which collects detailed information on farming prac-tices and farm financial conditions including credit sources. This survey samples only a small proportion of the overall U.S. farm population. For the analysis in this study using ARMS data from 2000–2003, the average annual sample size was 11,917. However, the sample database includes a set of complex replicate weights (expansion factors) that are designed to expand the sample so that estimates of the overall farm population can be obtained. Thus, by using ARMS data, it is possible to obtain state level expand-ed (estimatexpand-ed) counts of farms with various charac-teristics (e.g. race, gender, sales class, etc.).
The 2002 Census of Agriculture by NASS provides counts on the number of farms in a county as well as a number of characteristics about each farm and the farm operators. In particular, these data are used to identify the number of farms in a given county that would be considered eligible for an FSA Direct Loan. The farms are counted by gender, race, and beginning farmer status. These counts then provide the denom-inator for ratios that measure proportion of FSA-eli-gible farmers who have obtained at least one FSA Direct Loan in FY 2000–2003. While some census data are available in the public domain, a special tab-ulation was required to obtain information on the numbers of FSA-eligible farmers cross-classified by gender, race (ethnicity), and beginning farmer status. This tabulation was conducted at the NASS data lab-oratory in Washington D.C. by members of the study team.
In the preliminary report submitted on July 29, 2004, ARMS data for the three-year period 2000–2002 were used to estimate the number of farmers eligible for FSA direct assistance as well as the average balance sheets and income statements for various farmer groups. Part of this study is concerned with how
extensively FSA has penetrated the potential market for FSA Direct Loans. Because of deficiencies in both the Census and ARMS databases, two sets of estimat-ed counts of the number of eligible borrowers are produced in this study. One set comes from the four-year ARMS data (2000–2003) and the second set is from the 2002 Census of Agriculture. Both sets are presented in the discussions that follow, as called for by the various types of analyses.
Additional data for objectives 2 and 3 for this study were obtained through a national survey of FSA county offices. The instrument was designed by the research team at the University of Arkansas and administered electronically through the FSA secure intranet. The survey instrument contained 71 bor-rower and loan information questions. Two thou-sand, seven hundred and fifteen (2,715) usable responses were collected during the period of November 22, 2004 through December 17, 2004. The final data download was received by the University of Arkansas Division of Agriculture on December 21, 2004. A detailed discussion of the sur-vey instrument and the sursur-vey procedure is present-ed in section 2 of this study.
1.1.4. Current Agricultural Lending Trends
The current trend in the agricultural credit market is a continued shift away from FSA direct credit toward FSA guarantees and toward other sources of credit. Figure 1.1 displays the share of total farm business debt by originating lenders between 1960 and 2003. As shown in the figure, the share of FSA direct-lend-ing total farm business debt remained steady from the 1960s to the late 1970s. FSA’s direct lending share began increasing in the late 1970s and peaked in 1987 before a steady decline to the present. This decline is at least partially a result of the Food Security Act of 1985 (P.L. 99-198) mandate for FmHA (and later, FSA) to emphasize guaranteed loans over direct loans.
Figure 1.2 illustrates the volume of Direct Farm Loan Program principal outstanding as a proportion of total (direct plus guaranteed) FSA principal out-standing. Direct principal outstanding has declined from over 90 percent in 1984 to under 45 percent in 2002 of total FSA direct and guaranteed principal outstanding. Although guaranteed loans have sur-passed direct loans in both principal outstanding and dollars obligated per year since 1999 in dollar terms, FSA still made more direct loans than guaranteed loans for each of the four fiscal years 2000–2003.8
This is partially due to the Direct Farm Loan Program including youth loans, which have principal capped at $5000.
Figure 1.3 shows the average loan size for direct and guaranteed loans originated during FY 2000–2003 by region.9 Guaranteed loans are far larger in principal
than are direct loans. This is a result of the fact that more direct loans are made in any given year and
more dollars in principal are obligated in the guaran-teed program. Also, guaranguaran-teed loan caps are larger than direct loan caps. Moreover, the direct loans include youth loans. Even with the exclusion of youth loans, the average direct loan size is still smaller than that of the average guaranteed loan size.
1.2. Demographics, Location, and Volume of
FSA Direct Loans, FY 2000–2003
In this section, we discuss the numbers and volumes of FSA Direct Loans made to various cohorts. In par-ticular, we examine FSA Direct Loans to all borrow-ers, family farms, SDA borrowborrow-ers, and BF borrowers.
1.2.1. FSA Direct Loans to All Borrowers
Loan counts obtained from the New Loan database show that the agency made 60,151 direct loans to 45,016 borrowers from 2000 to 2003. A breakdown of the number of borrowers, loans, and counties cov-ered is presented in table 1.1. OL loans accounted for
Figure 1.1. Share of total farm business debt by originating lender, 1960–2003
8FSA Monthly Management Summaries, September 30 for years 2000-2004.
9The ten regions are defined using the previous ERS region designations. The regions are: Northeast (CT, DE, ME, MD, MA, NH, NJ, NY, PA, RI, VT), Lake States (MI, MN, WI), Corn Belt (IL, IN, IA, MO, OH), Northern Plains (KS, NE, ND, SD), Appalachian (KY, NC, TN, VA, WV), Southeast (AL, FL, GA, SC), Delta States (AR, LA, MS), Southern Plains (OK, TX), Mountain (AZ, CO, ID, MT, NV, NM, UT, WY), and Pacific (CA, OR, WA).
Figure 1.3. Average direct loan size vs. average guaranteed loan size, FY 2000–2003 four-year average
Figure 1.4. FSA Direct OL, FO, and EM borrowers, FY 2000–2003 TTaabbllee 11..11.. NNeeww FFSSAA DDiirreecctt llooaannss bbyy ttyyppee ooff llooaann,, FFYY 22000000––22000033
LLooaann ttyyppee LLooaann
ccoouunntt BBoorrrroowccoouunnttweerr CCoouunnttyyccoouunntt
All types 60,151 45,016* 2,592
Operating Loans (OL) 47,540 37,729** 2,486
Farm Ownership Loans (FO) 6,127 6,067 1,604
Emergency Loans (EM) 6,484 6,018 1,158
Source: Computed from FSA New Loan Database
*Loan recipients are counted as new borrowers for each of the years they appear in the new loan database. While there are 28,852 unique borrowers within the four-year period, borrowers are counted as new borrowers for each year they obtain a new loan. Therefore, a unique borrower can appear as frequently as four times in the count of new borrowers. ** A borrower who obtains multiple loans within a year is counted once for each type of loan within the year. Therefore, the number of borrowers from each type of loan exceeds the sum for all types of loan. A borrower who obtains loans in different years is counted once for each of the years.
Figure 1.5. FSA Direct OL borrowers, FY 2000–2003
79.03 percent of the loans in table 1.1 while FO and EM loans accounted for 10.19 percent and 10.78 per-cent, respectively.
The numbers and types of loans made to farmers dif-fer across counties. Figure 1.4 presents the number of borrowers for all the three types of loans, OL, FO, and EM combined. The figure shows a substantial geo-graphical dispersion in the intensity of FSA loan use. For example, out of the 3,078 counties reported in the 2002 Census of Agriculture, 484 (15.7 percent) had no borrowers while counties such as Franklin Parish in Louisiana, Lancaster County in Pennsylvania, and Aroostook County in Maine had 242, 259, and 263 borrowers, respectively.
Figure 1.5 presents a count of borrowers of OL loans. Given that OL loans account for about 79 percent of
all loans, it is not surprising to see the similarity between figure 1.5 (OL loan borrowers) and figure 1.4 (all loan borrowers combined).
Figure 1.6 shows the number of FO loan borrowers across the U.S. Unlike OL borrowers, FO borrowers are much fewer in number and located in fewer counties. Yet the intensity of use of FSA loans exhibits substantial geographical dispersion with number of borrowers ranging from 0 to 54 within counties. Surprisingly, three of the four counties with the high-est number of FO loan borrowers are located in Oklahoma while the counties in the Southeast farm production region (Alabama, Florida, Georgia, and South Carolina) have very few FO loan borrowers. Figure 1.7 presents the number of EM borrowers for FY 2000–2003. The figure shows a wide geographical
dispersion of borrowers across the U.S. However, unlike OL and FO loans, EM loans occur because of disasters. For example, Terry County in Texas had a total of 164 borrowers for all loans combined, but had 109 EM borrowers––the largest number of EM borrowers of any county in the four-year period. Terry County and the adjoining counties in the Southern High Plains were plagued with drought between 2000 and 2003. Hale, Swisher and Briscoe counties, all in Texas, were affected by the drought.10
The coastal plains of the Appalachians and the Northeast also show high numbers of EM borrowers, probably due to coastal storms. Inland, the delta states of Arkansas, Louisiana, and Mississippi show a large proportion of EM loan borrowers.
In summary, figures 1.4 – 1.7 show that the intensity
of use of FSA loans has substantial geographical dis-persion, and that the intensity varies by type of loan. Dodson and Koenig (2003) observed geographical variations in FSA lending activity for FSA loans made from 1995 to 1999. We continue to observe this trend for FSA loans made between FY 2000 and 2003. For OL and FO loans, the geographical dispersion is driv-en partly by the dispersion of eligible borrowers while the dispersion in EM loan use is driven by natural disasters.
1.2.2. FSA Direct Loans to Family Farm Borrowers
The intended clientele for FSA’s Direct Loan Programs are creditworthy family farming operations that are unable to obtain credit from conventional sources. The definition of a family-sized farm used by FSA is a farm that: “(a) is similar to other farm operations in
10Yates, J. Personal E-mail Communication, Extension Specialist, Risk Management, South Plains District 2, Route 3, Box 213AA, Lubbock, TX 79403. E-mail response to John Nwoha, Program Associate, University of Arkansas, Division of Agriculture. April 28, 2005.
the community, (b) has an operator of the farm who provides all day-to-day management and operational decisions of the farm business, (c) has an operator who contributes a substantial amount of full-time labor to the farming operation, and (d) has credit needs that are consistent with a family sized farming operation” (Dodson and Koenig, 2003 p. 193). Although a family farm is not precisely defined, total borrower indebtedness caps may help to ensure that family farms are the primary recipients of FSA Direct Loans. The indebtedness caps for the FO and OL programs are $200,000 each, while the cap is $500,000 for the EM program.11 As evident in figure
1.8, the origination amounts for the majority of direct loans are well under the program caps. As expected, average origination amounts are substan-tially larger for FO loans than for both OL and EM loans. EM loans average slightly larger amounts than OL loans. Nationwide, from FY 2000 to FY 2003, the average direct OL loan was $55,822, the average direct FO loan was $113,739, and the average EM loan was $60,177. Over the same time period, there were annual averages of 11,855 OL loans, 1,532 FO loans, and 1,621 EM loans made. Regional average princi-pal amounts ranged between $102,875 and $139,905 for FO loans, between $41,736 and $72,262 for OL loans, and between $43,106 and $99,836 for EM loans. The regional data show evidence of mild het-erogeneity in loan size. On average, the Pacific and Lake States regions have the largest FO loans, while the Corn Belt and Northern Plains have the smallest FO loans. For OL loans, the Pacific and the Southeast regions average the largest loan sizes. The Appalachian region has the smallest average OL loan size.
1.2.3. FSA Direct Loans to Small Family Farm Borrowers
According to the USDA farm typology definition, a ‘small’ family farm is a farm with sales less than $250,000 per year. This definition follows from a suggestion by the National Commission on Small Farms (USDA/ERS, 2004). Given the lending caps of FSA’s Direct Farm Loan Program, small family farms are more likely the primary beneficiaries of the direct loan program.
To estimate the proportion of direct loans made to small farms, it is necessary to use ARMS data. This is required because the New Loan database did not report sales levels for FSA Direct Loan borrowers. ARMS data for the four-year period from 2000 to 2003 were used to estimate the number of family farms in the U.S. and the number of those farms orig-inating direct loans in 2000–2003. The ARMS data estimate an average of 2,104,280 farms per year.12 Of
these farms, only 45,226 (2.15 percent) are estimated to have been FSA Direct Loan originators and the remaining 2,059,054 are non-FSA Direct Loan origi-nators.13
One indication of the extent of FSA loan activities among small farms is the percentage of FSA loans made to small farms. This percent is calculated as the four-year expanded total number of farms in ARMS surveys with sales less than $250,000 and reporting one or more of FSA-sourced loans originated during the calendar year of the survey divided by the four-year expanded total of all farms (regardless of sales) reporting one or more of FSA-sourced loans origi-nated during the calendar year of the survey. Nationwide, nearly 78 percent of FSA Direct Loans
11A borrower may have multiple loans of the same type (OL, FO, or EM) as long as the sum of the original principal on those loans is less than the indebtedness cap for the particular loan type.
12The four-year total before excluding an estimated 621 farms with more than one million dollars in a FSA direct loan is 8,417,740. The 621 farms are excluded because they are unlikely FSA farms since individual loan program caps are $500,000 or less. Thus the averages calculated here are based on a four-year total of 8,417,119 farms.
13We caution the reader here that there is a large distinction between FSA Direct Loan originators and farmers with at least one FSA Direct Loan. An operator originating no FSA Direct Loans during 2000-2003 but still having one or more active FSA Direct Loans originated prior to 2000 would not be counted. The reason for this distinction is to focus on more recent FSA loan originations.
went to small family farms, with 65 percent of the states devoting at least half of new direct loans to small farmers.14
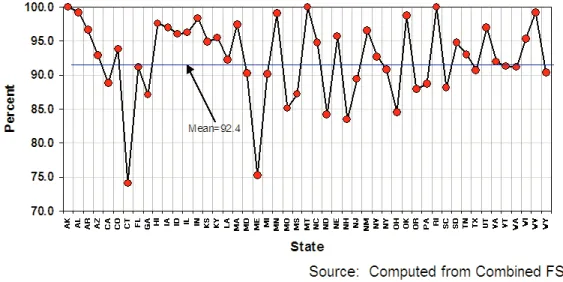
The ARMS data, however, do not give reasonable esti-mates of small farm counts by state, with nine states showing no FSA small farms at all. The FSA New Loan data set, on the other hand, cannot be used by itself because it does not have the sales variable to delineate the small farms. A better indication of the state-level loan servicing involvement of FSA in small farms is obtained by using the combined FSA New Loan and the Farm and Home Plan data sets. The Farm and Home Plan’s gross income variable (crop income plus livestock income plus other farm income) was used as a proxy for sales, thus enabling small farms in the New Loan data set to be counted. Results in figure 1.9 show that by state, the percent share of small farm borrowers to the total FSA bor-rowers who received new loans in FY 2000–2003 ranges from 74.1 percent (Connecticut) to 100 per-cent (Alaska, Montana, and Rhode Island). Overall, 92.4 percent (indicated by the horizontal line) of the
FSA borrowers were small farms. This compares favorably with the 88.2 percent proportion of small farms to the total FSA-eligible farm population esti-mated from the 2002 Census of Agriculture as dis-cussed later in section 1.3.
1.2.4. FSA Direct Loans to SDA Borrowers
Under the Agricultural Credit Act of 1987 (P.L. 100-233), FSA began officially targeting Socially Disadvantaged Applicants (SDAs) applying for direct FO loans. The Food, Agriculture, Conservation, and Trade Act of 1990 (P.L. 101-624) and the Agricultural Credit Act of 1992 (P.L. 102-554) expanded SDA tar-geting to include OL loans and women. Currently, the law requires FSA to “reserve or target a portion of its direct and guaranteed operating and farm owner-ship loan funds for use exclusively by socially disad-vantaged applicants. SDAs are classified in one or more of the following categories: women, African Americans, Native Americans, Alaskan Natives, Hispanics, Asians, and Pacific Islanders. In the farm ownership loan program, the percentage of loan funds targeted for SDAs is based upon the state per-centage of the total rural population made up of SDA
Figure 1.9. Percent share of small farms to total FSA borrowers, FY 2000–2003 14Of the remaining 22 percent of FSA direct loans, an estimated 13.7 percent went to farms with $250,000 to $499,999 of sales, 6 percent went to farms with $500,000 to $999,999 of sales, and only 2.4 percent went to farms with $1,000,000 or more in sales.