AIQ
Opening Bell
M o n t h l y
V
OL. 10 I
SSUE11 N
OVEMBER2001
I
N
T
HIS
I
SSUE
F e a t u r e
Does the Trading System Work? How Much Money Does It Make? ...1
S e c t i o n s
Data Maintenance ...5
S&P 500 Changes ...5
Strategy Update: 'Dogs of the OEX' ...6
Market Review ...8
The Opening Bell Monthly
is a publication of AIQ Systems
David Vomund, Chief Analyst P.O. Box 7530
Incline Village, Nevada 89452
PORTFOLIO SIMULATIONS
DAVID VOMUND
H
OW
M
UCH
M
ONEY
W
OULD
Y
OU
M
AKE
T
RADING
A
S
YSTEM
?
N
EW
S
IMULATOR
T
ELLS
Y
OU
!
By David Vomund
C
reating the Expert Design Studio (EDS) module was an important step for AIQ. In addition to the ability to run pre-built reports and follow Expert Ratings, EDS enabled users to create their own personal trading systems. Now with TradingExperts new Portfolio Simu-lator, EDS hasbecome an even more powerful tool.
After creat-ing a tradcreat-ing system, the most important
question is does the system
work? EDS answers that question by comparing the return on each stock trade to an equivalent trade in the market. If the average stock trade outperforms an equivalent trade in the market, then the system has value.
The next important question then becomes how much money would I have made trading this system?
Until the release of the new Portfolio Simulator,
TradingExpert couldnt answer this question. An EDS backtest simply looks at all qualifying stock trades and makes inferences based on the average return and holding period.
That doesnt represent real portfolio condi-tions, especially since it assumes every trade is acted on. In the Portfolio Man-ager module of TradingExperts 6.0 version, users can run Portfolio Simulations that include capitalization rules.
That is, users can specify how much money is placed in each stock trade and new positions cannot be purchased unless there is sufficient cash in the portfolio. A test using the new Portfolio Simulator closely reflects real trading conditions.
Users can run Portfolio
Simulations which include
capitalization rules A test
using the new Portfolio
Simulator closely reflects real
NOVEMBER 2001
PORTFOLIO SIMULATIONS continued . . .
P
LEASE
S
END
C
ORRESPONDENCE
T
O
:
Opening Bell Monthly G.R. Barbor, Editor P.O. Box 7530
Incline Village, NV 89452
AIQ Opening Bell Monthly does not intend to make trading recommendations, nor do we publish, keep or claim any track records. It is designed as a serious tool to aid investors in their trading decisions through the use of AIQ software and an increased familiarity with technical indicators and trading strategies. AIQ reserves the right to use or edit submissions.
For subscription information, phone 1-800-332-2999 or 1-775-831-2999. © 1992-2001, AIQ Systems
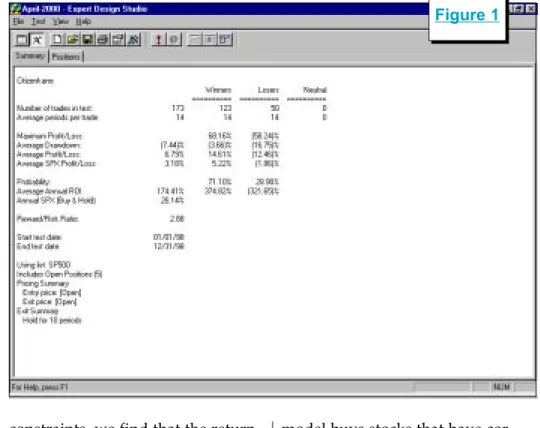
Figure 1
Backtesting a system by looking at an average of all trades can yield different results than backtesting a system using strict capitalization rules. Lets look at an extreme example using the Citizen Kane EDS model that we covered in the April 2000 Opening Bell.
In quick review, the Citizen Kane EDS model looks for stocks that have corrected by at least 30% sometime in the last 10 to 50 days. In addition, their Volume Accumu-lation Percent (VaPct) indicator must be above zero and trending higher.
In Figure 1 we see an EDS backtest of this system for the year 1998. The results are very impres-sive. With a 14-calendar day holding period, the average trade using an S&P 500 database made 6.79% compared to an equivalent trade of 3.18% for the S&P 500. The Average Annual ROI shows a 174% return!
Now let's look at the return of this model for the same time period computed with the new Portfolio Simulator. For our example, we will assume that the account starts with $100,000 and each stock purchase represents 10% of the entire portfolio. Under these
constraints, we find that the return is dramatically lower. In Figure 2
we see the $100,000 account grew to just $101,148, a return of only 1.15%. How can one backtest show a 174% return on invest-ment when another test shows a 1.1% return on invest-ment? The answer is
that the EDS backtest assumes all trades are acted on, whereas the Portfolio Simulator only buys stocks when the account has cash available.
Remember, in 1998 the market experienced a swift and sharp correction in the fall and then quickly rallied and didnt look back. That type of market activity works perfectly for our Citizen Kane trading model because the
model buys stocks that have rected 30%. As the market cor-rected many stocks passed the model. These trades turned very profitable when the market rallied.
In Figure 1 we saw there were 173 trades during 1998. Upon closer examina-tion of the trades we found that there were only 16 trades from January through July. When the market corrected in October, more stocks passed the screening. In the month of October alone there were 82 trades. Most of these trades were profitable because they came at the market low. Then again, at the market low even a dart throwing system would be extremely profit-able.
The problem with this test is
How can one backtest show a
174% return on investment when
another test shows 1.1%? The
answer is that the EDS backtest
assumes all trades are acted on,
whereas the Portfolio Simulator
only buys stocks when the
Figure 2
Portfolio Simulations continued on page 4 Figure 3
that you wouldnt be able to act on all the 82 stock trades in October. Eventually, the portfolio is fully invested. Thats why the Portfolio Simulator provides a more realistic representation of how a trading system would perform. Using the Portfolio Simulator, only 19 of the 82 trades in October were acted on.
I specifically chose this model and the time period tested to show an extreme situation. Most often, EDS and Portfolio Simulator backtests agree much more closely. Yet this example clearly demon-strates the differences between the two backtesting methods and it shows how the more realistic Portfolio Simulator approach better reflects the return one might see from a particular trading system.
In order to perform a Portfolio Simulation, you first need an EDS screening model. You can either create a model or download one of the models that weve featured in past Opening Bell issues from AIQs web page at www.aiqsystems.com.
Once you have decided on an EDS model, you are ready to set up
the backtest. Open TradingExperts Quick Launch Menu and select the
Portfolio Manager module. In Portfolio Manager, click the New Simulation icon (the fourth icon from the left). In the first box on the Portfolio Simulation screen, enter a name for the simulation test.
If you wish, use the Description and Comments boxes to enter additional information. Select a broker from the pull-down menu. Commission rates are determined by the broker you select.
Under the Strategy box click
New. The Strategy screen that appears is where you select the EDS file that contains the entry rules and any other statements that you will need to implement the strat-egy. In the Strategy Name box, input a name that identifies the strategy. The name should include a description of the strategy's stock entry criteria.
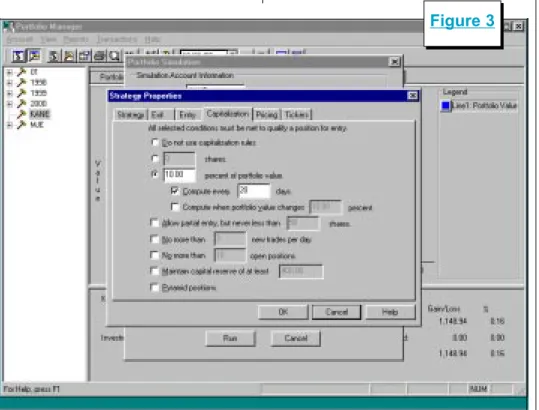
To select the EDS file that you want to use, click the button with three dots ( ). Then use the Open box to find and highlight the file name. Then click Open. When the Strategy box reappears, click Next. The next few screens are used to specify exit and entry rules and capitalization criteria. The capitali-zation screen is shown in Figure 3. For our test we stated that each stock position shall represent 10%
NOVEMBER 2001
PORTFOLIO SIMULATIONS continued . . .
Figure 4
of the portfolio value at the time of purchase. This implies that a fully invested portfolio contains 10 stocks. In addition, we specified that portfolio value is to be recom-puted every 20 days.
Users also have the ability to allow for partial entry, to specify a maximum number of trades per day, and to specify minimum reserves. We left these boxes unchecked.
After clicking Finish, the Portfo-lio Simulation Screen reappears. Enter the starting cash balance, the start date of the backtest, the end date of the backtest, and an index to compare results to. To run the simulation click Run.
Editors Note: a more detailed description of this process is found in TradingExperts User Reference Manual beginning on page 469. A detailed step-by-step procedure is found on page 480.
In our simulation there were many occasions where stocks passed our screening but could not be purchased because of
insufficient funds in the portfo-lio. For example, 10 stocks passed the screen but only two could be purchased. In such cases, the system picks which stocks are purchased. The default method is simply alphabetical order. Obviously there are better tie breaker systems.
For a more sophisticated tie breaker system, Portfolio Simulation allows you to create indicator based tie breaker rules through the use of User Defined Functions. A User Defined Func-tion is a rule created by the user that includes the is identifier. To use an indicator as part of a tie breaking process, simply insert a User Defined Function in the EDS model.
For example, if we wanted to
select which stocks were purchased based on the level of their Volume Accumulation Percent indicators, then the following User Defined Function would be inserted in the EDS model:
Rule1 is [Va pct].
If we wanted to use the 45-day slope of Volume Accumulation Percent as the tie breaker, then the EDS model would include the following function:
Rule2 is Slope([Va pct],45).
With the User Defined Func-tions created, we can modify our
Portfolio Simulation to include the new tie breaker rule. To modify our previous simulation, open the Portfolio Manager and on the left section of the screen double-click the strategy name. On the Portfolio
Simulation Screen click Edit. Click the Entry folder. The Entry Rule may already con-tain the EDS rule name that is associated with the buy strat-egy.
We enter our tie breaker rule under the next section, Ranking UDF (Figure 4). By clicking on the arrow, the User Defined Function rule name should appear. Click Ascending
if a low score is what you desire or click Descending if a high score is better.
Using a technical indicator to determine which stock to buy when there are insufficient funds to buy all stocks that pass a screening is obviously a better method than simply buying those stocks that appear near the top of the alphabet.
We ran the same backtest but in tie breaker situations we wanted
Using a technical indicator to
determine which stock to buy
when there are insufficient funds
to buy all stocks that pass a
screening is obviously a better
method than simply buying those
stocks that appear near the top of
the system to pick the stock with the highest slope of the Volume Accumulation Percent indicator. Therefore, in the Strategy Proper-ties screen we selected Rule2 listed above and clicked Descending. As a result, our overall return increased by 4%.
Our focus in this article has been on the use of the Portfolio Simulator but that doesnt imply that the backtesting functions in the Expert Design Studio should be ignored. Because it looks at the activity of every stock that passes the screening, the Expert Design Studio's backtesting function is often a better choice when creating a model.
Once a model is created, then it should be tested using the Portfolio Simulator. It will tell you how the model would have performed during the time period selected.
Be careful not to tweak models too much based on Portfolio Simu-lator results. Since the simuSimu-lator only buys stocks when cash is available, its test will have fewer trades than a test in the Expert Design Studio and it is easy to over-optimize a strategy, leading to poor future results. n
David Vomund publishes VIS Alert, a weekly investment newsletter. For a sample copy of the newsletter, call (775) 831-1544 or go to
www.visalert.com.
The following table shows stock splits and other changes:
Stock Ticker Split Approx. Date
Advance PCS ADVP 2:1 11/05/01 Amer Business Fin. ABFI 10% 11/06/01 Koss Corp KOSS 2:1 11/06/01 MEDTOX Sci. TOX 10% 11/12/01 Summit Financial Corp. SUMM 5% 11/12/01 Fuller (HB) Co. FULL 2:1 11/19/01 Brown & Brown BRO 2:1 11/22/02 Multi-Coor Corp. LABL 3:2 12/03/01
Trading Suspended:
Alliance Forest Prod. (PFA) Cheap Tickets Inc. (CTIX) CMI Corp. (CMI)
Euphonix Inc. (EUPH) Exodus Communic. (ETA) Galileo Intl (GLC)
IBP Inc. (IBP)
Picture Tel Corp (PCTL) Polaroid (PRD)
Prime Retail (PRT) Telescan (TSCN) Texaco Inc. (TX)
Name Changes:
Chevron Corp. (CHV) to Chevron Texaco Corp (CVX)
Kansas City Power & Light (KLT) to Great Plains Energy (GXP) Professional Detaining Inc. (PDII) to PDI Inc. (PDII)
Riddell Sports (RDL) to Varsity Brands (RDL) SciQuest.com Inc. (SQST) to SciQuest Inc. (SQST)
TECO Energy (TE) replaces Global Crossing (GX). TE is added to the Electric Companies (ELECTCOM) group.
Equity Office Properites (EOP) replaces Texaco Inc. (TX). EOP is added to the Real Estate Investment Trusts (REITRUST) group. Ecolab Inc. (ECL) moves from the Diversified Commercial Services (SERVICED) group to the Specialty Chemicals (CHEMICAS) group. Chevron (CHV) is changed to Chevron-Texaco (CVX).
Changes to the S&P 500 Index and Industry Groups:
S&P 500 Changes
Please Note
The information in this newsletter is believed to be reliable but accuracy cannot be guaranteed. Past performance does not guarantee future results.NOVEMBER 2001
STRATEGY UPDATE
Percentage Returns
Year Dogs S&P 500
1995 37.78 37.58 1996 16.23 22.96 1997 27.34 33.36 1998 4.77 28.58 1999 4.72 21.04 2000 9.35 -9.10 2001 8.67 -20.39 Average =15.55 16.29
I
n the mid 1990s, the Dogs of the Dow investing strategy gained great popularity. Mu-tual funds were formed that follow that specific strategy. Its popularity waned in the late 1990s as growth investing became the rage. The Dogs of the Dow strategy is a value strategy, and it underperformed badly at the height of the bubble.Just as investors gave up on the strategy, the technology bubble burst and value investing began to outperform growth investing. The Dogs of the Dow strategy began to outperform again.
To quickly review the Dogs of the Dow strategy, on the first trading day of each year, you buy the ten highest yielding Dow stocks and hold them for the rest of the year. The portfolio is rebalanced using the same strategy at the start of every year.
In the March 1998 Opening Bell, we took the concept of the Dogs of the Dow strategy and modified it to non-Dow stocks. Our concern was
that because too many people were following the Dogs of the Dow strategy it would stop working.
We also did not know the reason for the good historical results of this
strategy. Was its success due to the fact that only Dow stocks were purchased or was it because high yielding stocks were purchased? If the success was
due to the Dow stock limitation then we wouldnt be able to suc-cessfully change the strategy. We suspected that the important part of the strategy was that the stocks had
a high yield.
In fact, James OShaughnessy in
What Works on Wall Street found that buying high yielding large-cap stocks is an effective strategy. The
stocks dont necessarily have to be in the Dow, but they must have a large capitali-zation. Our goal was to apply this strategy to a set of large-cap stocks that werent neces-sarily Dow stocks. We decided to run a test of the stocks in the S&P 100 index, otherwise known as the OEX.
On January 2 of each year, we
T
HROUGH
S
EPTEMBER
, 2001
--D
OGS
OF
THE
OEX S
TOCKS
U
P
AN
A
VERAGE
OF
8.67%
By David Vomund
-25
-20
-15
-10
-5
0
5
10
15
20
25
30
35
40
S&P 500
Dogs
2001
2000
1999
1998
1997
1996
1995
Dogs vs. S&P 500
Percentage Annual Return
On January 2 of each year,
we purchased the 10 highest
yielding stocks in the OEX
and held them for an entire
year at which time a new
list of high yielding stocks
was purchased.
Figure 5
○ ○ ○ ○ ○
purchased the 10 highest yielding stocks in the OEX and held them for an entire year at which time a new list of high yielding stocks was purchased.
Table 1 and Figure 5 show the annual returns from this strategy compared to the S&P 500 index. Dividend yields are included in both return figures. We see that the average return from our Dogs of the OEX strategy is 15.55%, just slightly below the S&P 500s return.
The results of our test dont necessarily mean that the strategy is ineffective. This is a conservative strategy. It typically holds conser-vative stocks and the standard deviation of the portfolio is less than that of the market. Its return is about in line with the markets return but it has not had a losing year. The return is more conserva-tive (i.e., less volatile).
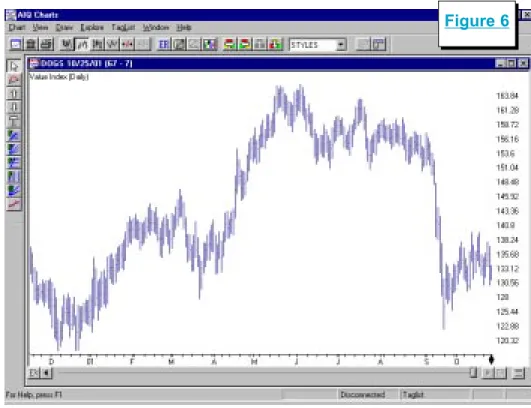
In 2001 through September 28, the Dogs of the OEX stocks are up an average of 8.67%. Figure 6 is a chart of an industry group contain-ing this years portfolio. The portfolio performed extremely well through much of the year until the
September terrorist attacks. Al-though results are still positive, most of the years gains were given back in September.
In order to follow this strategy, you have to create a list file of the S&P 100 stocks and then sort them based on their dividend yields. To
get a list of the S&P 100 stocks, go to Standard & Poors web site at
www.spglobal.com. You can also get a list of the S&P 500 stocks and their corresponding industry groups at this site.
For a listing of the yield for each S&P 100 (i.e., OEX) stock, we used The Wall Street Journal. But looking up each stock in the news-papers is not a fun process. An easier method is to use AIQ TradingExperts Fundamental Module at the start of each year to sort the S&P 100 stocks by their yields. It is important to do this at the start of the year because you cant get historical fundamental data with AIQ.
To use TradingExpert to down-load the yield data, choose the
Fundamental Module from the Quick Launch Menu. In the Fundamental Module, click Fundamentals and then Specify Strategy.
On the Specify Dial/Data Strategy screen, the left section shows the available field choices and the right side shows which
Strategy Update continued page 8 Figure 6
NOVEMBER 2001
STRATEGY UPDATE continued . . .
fields that you actually want to use. Since we are only interested in dividend yield data, move all the fields to the left section and then move DividendYield to the right section.
Next, we tell the model that we are interested in high yielding stocks. Under the Selected Fields section, click Dividend Yield and click Set Criteria For Selected Fields.
On the Criteria For Selected Fields screen, click Set Rank or Range For Field. Then check the Rank Field
MARKET REVIEW
Dividend Yield box and click De-scending. Click OK.
Under Source For Ranking, click User List and select your created S&P 100 list. The screen should now look like Figure 7.
With this done, go to
TradingExperts Communications. In the Update section of the Data Retrieval Options page, check the box next to Fundamentals, and download the fundamental data for the S&P 100 list. You can then go to the Fundamental Module and see a
list of all the stocks sorted by their dividend yields. The 10 highest yielding stocks are the ones that are purchased.
At the start of next year, well update this years performance and list the new set of Dogs of the OEX stocks that well follow throughout the year. n
O
ctober is typically the worst month for the market. This October, despite anthrax cases and fears of more terrorist attacks, the market rose. The S&P 500 in-creased a modest 1.8% but the Nasdaq rallied 12.8%. Despite the strong rally, the Nasdaq simply moved back to its early September level.With the strength of the Nasdaq we know that technology stocks led the advance. Within the technol-ogy sector, Semiconductors rose 35%, Computer Storage rose 32%, Application Software rose 28%, and Internet Software & Services rose 23%.
There were weak industry groups as well. Consumer Finance fell 30%, Photographic Products fell 21%, Insurance (Life/Health) fell 17%, and Retail (Drug Stores) fell 17%.
The AIQ timing model was on a buy signal at the start of October and it registered an additional 97 buy signal on October 10. On October 30 the system turned bearish, registering a confirmed 100 sell signal. In October the Nasdaq Composites weekly RSMD SPX indicator moved higher, favoring the Nasdaq over the S&P 500.
Sometimes it is good to stand
back and see the forest instead of the trees. In Figure 8 we see the Nasdaqs weekly chart instead of the more conventional daily chart. This chart puts Octobers rally in perspective. The rally was impres-sive but it wasnt strong enough to move the Nasdaq above its 28-week moving average. From a long-term perspective, the trend was still down.
Many chartists expect a retest of the lows. A move to the 28-week moving average followed by some
selling pressure is normal activity. It is important, however, that the market indexes remain above the lower AIQ band if/when it does retest. The retest most often comes several months after the first low.
We saw this type of activity at the end of the 1974 and 1990 bear markets. You cant count on a retest, however. In 1982, the market made a low and never looked back. n