Credit Risk Management and Its Impact on Performance of
Commercial Banks: In of Case Ethiopia
Tekalagn Getahun Lu Anwen Md.Shafiqul Bari
School of Economics and Management, Chongqing University of Posts and Telecommunications, School of Economics P. o. Box 400065 Chongqing, China
Abstract
Credit risk management in financial institutions has become more important not only because of the financial transactions performances but also protecting crisis that the industry is experiencing in the bust and somehow in the present. Moreover, it is also a means of or a crucial concept that determine commercial performance for the success, sustainable growth, and consistent profitability. The purpose of this paper is to investigate the relationship between credit risk management and its impact on performance of commercial banks in Ethiopia. This study is primarily based on secondary data. Secondary data were collected from nine (09) commercial banks in Ethiopia. The secondary data were obtained from various sources such as Annual Reports of the selected commercial banks, National bank of Ethiopia, relevant articles, books and magazines etc. The panel data of a six year period from 2009 to 2014 from the selected banks were used to examine the relationship between credit risk and performances. The data were analyzed using descriptive statistics and panel data regression model by using SPSS software version 22 and the Return on Assets (ROA) and Return on equity were used as performance variables and Capital Adequacy Ratio(CAR).Non-Performing Loans to Total Loans (NPLR), Loan provision to Total Loan Ratio(LPTLR), Loan Provision to Non-Performing Loans Ratio (LPNPLR), Loan Provision to Total Assets Ratio(LPTAR) and Non-Performing Loans to Total Loans (NPLTLR) were used as variables of credit risk management. The findings reveal that there is strong relationship between credit risk management and commercial bank performance in Ethiopia.
Keywords: Risk Management, Credit Risk, Credit Risk Management, Credit enhancement, CAR, NPLR, ROA, ROE.
Abbreviations
CRM = Credit risk management DC = Developing Countries ROA= Return on Asset ROE= Return on Equity CAR= Capital Adequacy Ratio
LPTLR= Loan provision to Total Loan Ratio NPLR= Non-performance Loan Ratio
LPNLR = Loan Provision to Non-Performing Loans Ratio LPTAR Loan Provision to Total Assets Ratio
Std. Dev= Standard deviation Std.Error. = Standard Error Coef. = Coefficient P-value= Probability Value R2= R-Square
1. Introduction
The financial transactions such as banking industry have achieved great prominence in the developed world than developing countries. Developing Countries (DC) such as the Ethiopian economic environment has promising situations for and a predominant role in granting credit facilities. Credit functions of banks, insurance, and other financial sectors enhance the ability for investors to exploit desired profitable venture. Credit creation is the main income generating activity of financial transactions, via banking systems. The DCs banking system has not given enough attentions in the past. Ethiopia banking system has not given enough attention before 2010 specially regarding to the development of modern system of assessing, controlling and managing risk in banking operation in line with the changing environment and global financial standard. Risk management guideline of 2010 paved the way for the latest development of Risk management practice in Ethiopian banking industry. However, after a decade there is a good revival and courage for local and foreign investments. Therefore, risk management guideline such as Ethiopia designed and implemented a dynamic risk management practice in its financial transactions (Abdulaziz& Omar, 2012; Andries et al., 2012).
Risk management including trade transactions and returns are important for the sustainable profitability of financial sectors. Such as risks in banking operation credit risk which is relating to the substantial amount of
income generating assets is found to be an important determinant of bank performance. The objective of risk management is to reduce the effects of different kinds of risks related to a pre-selected domain to the level accepted by society. It may refer to numerous types of threats caused by environment, technology, humans, organizations and politics.
Credit risk management in a financial institution starts with the establishment of sound lending principles and an efficient framework for managing the risk. Adequately managing credit risk in financial institutions is critical for the survival and growth of the financial Institution. In the case of banks, the issue of credit risk is greater concern because of the higher levels of risks resulting from some of the characteristics of clients and business conditions that they find themselves in. On the other hand it involves all means available for humans, or in particular, for a risk management entity. Credit risk management is very important to banks as it is an integral part of the loan process. It maximizes bank risk, adjusted risk rate of return by maintaining credit risk exposure with view to shielding the bank from the adverse effects of credit risk. The relationship between credit risk and commercial banks performance has been the concerns of various studies that prove the credit risk is among the major factors affecting profitability performance of commercial banks (Achou and Tenguh 2008;Hosna etal.,2009;Tefera 2011).Literatures on the context of Ethiopian banking sector documented that credit risk has been major challenges of bank performance in Ethiopia (Alemauhy,1991;Tekilebirhan,2010;Melkamu,2012;Getahun,2012). However, very few of local studies have leaned heavily towards the various tools and techniques of credit risk management (GirmaMekasha, 2011) and very few of local studies have towards the credit risk management (GirmaMekasha, 2011, Million Gizaw 2013).And there is no such enough research that could deeply conducted on credit risk management and its impact on performance of commercial banks in Ethiopia and also they found different result. Therefore, we have found the existence of research gap and would devote their effort to conduct a research on it.
2. Theoretical framework 2.1 Risks in banks
According to Koch and MacDonald (2009, 108), banks’ risks can be identified as six types: credit risk, liquidity risk, market risk, operational risk, reputation risk and legal risk. Each of these risks might generate harmfully influence the financial institution’s probability, market value, liabilities and shareholder’s equity. Among those risk credit risk becomes a key influential factor for bank’s performance. Van Gestel & Baesens mention that there can be many reasons for credit default. Mostly, the obligor is in a financial stressed situation and may be facing a bankruptcy. He can also refuse to comply with its obligation of debt service in the case of a fraud or legal dispute. Technical defaults are generated by the flaw in the information system (Van Gestel & Baesens, 2008, p.25). Credit risk can also be a risk of loss on credit derivative market. It can be credit migration such as a downgrade in credit rating (Choudhry, 2011). Or when the bank invests in debt to high-quality borrower whose risk profile has deteriorated (Choudhry, 2011). In the case of liquidation, the price at which the debt is sold is lower than the price at which the debt was bought by the bank, which induces a net loss of bank on the market (Van Gestel & Baesens, 2008). In a full default, the extent of loss can be observed immediately to be the full from the administrators which is known as “recovery value” (Choudhry, 2011).
Sources of Risks: Fig.1 Figure 1 Sources of risks in bank
2.2 Credit Risk
Credit risk is defined as the probability that some of a bank’s assets, especially its loans will decline in value and possibly become worthless. Because banks hold little owners capital relative to the aggregate value of their assets, only a small percentage of total loans need to go bad to push a bank to the brink of failure. Thus, management of credit risk is very important and central to the health of a bank and indeed the entire financial system. Credit risk arises from the potential that a borrower or counterparty will fail to perform on an obligation.
2.3 Credit risk measurement method
According to Allen and Powell there are a variety of available credit modeling techniques, the most prominent methods include:
2.3.1External ratings services
The most prominent of the ratings services are Standard & Poor’s (S&P), Moody’s & Fitch. The ratings provide a measure of the relative creditworthiness of the entity, taking into account a wide range of factors such as environmental conditions, competitive position, management quality, and the financial strength of the business. The evaluation is made by a credit rating agency of the debtor's ability to pay back the debt and the likelihood of default. Well-managed credit risk rating systems promote bank safety and soundness by facilitating informed decision making. Rating systems measure credit risk and differentiate individual credits and groups of credits by the risk they pose. This allows bank management and examiners to monitor changes and trends in risk levels. The process also allows bank management to manage risk to optimize returns.
2.3.2 Financial Statement Analysis Models
These models provide a rating based on the analysis of various financial statement items and ratios of individual borrowers. Examples include the Z score and Moody’s Risk Calc. Edward Altman (1968, 2000) developed the Z score which uses five ratios in the prediction of bankruptcy. The Altman Z-score is a combination of five weighted business ratios that is used to estimate the likelihood of financial distress. Dr. Edward Altman is a multivariate formula for measurement of the financial health of a company and a powerful diagnostic tool that forecast the probability of a company entering bankruptcy within a two year period with a proven accuracy of 75-80%.The ratios and their weightings are 0.012 (working capital / total assets), 0.014 (retained earnings / total assets), 0.033(earnings before interest and taxes / total assets), 0.006(market value equity / book value of total liabilities), and 0.999(sales / total assets ratio). Moody’s KMV Company (2003) Risk Calc model provides an Estimated Default Frequency (EDF) for private firms.
The Altman‘s credit scoring model takes the following form;
Z=1.2x1+1.4x2+3.3x3+0.6x4+1.0x5
Where, X1 = Working capital/ Total assets ratio X2 = Retained earnings/ Total assets ratio
X3 = Earnings before interest and taxes/ Total assets ratio X4 = Market value of equity/ Book value of long-term debt ratio X5 = Sales/ Total assets ratio.
The higher the value of Z, the lower the borrower‘s default risk classification. According to Alman‘s credit scoring model, any firm with a Z-Score less than 1.81 should be considered a high default risk, between 1.81-2.99 an indeterminate default risk, and greater than 1.81-2.99 a low default risk.
2.3.2 Structural Model
The model measures changes to default probabilities based on the distance to default (DD) of a firm which is a combination of asset values, debt, and the standard deviation of asset value fluctuations, from which Probabilities of Default (PD) can be calculated per equation 7. The point of default is considered to be where debt exceeds assets and the greater the volatility of the assets, the closer the entity moves to default. Equity and the market value of the firm’ assets are related as follows:
E =VN d(1) − e−fTFN d (2) [1]
Where E = market value of firms equity, F = face value of firm’s debt, r = risk free rate, N = cumulative standard normal distribution function
d1=ln(V/F)+(r+0.5σ2V)T [2]
σV√T
d2=d1-σv√T [3]
Volatility and equity are related under the Merton model as follows:
σE= (v/E)N(d1)σV [4]
KMV takes debt as the value of all current liabilities plus half the book value of all long term debt outstanding. T is commonly set at1 year. Per the approach outlined by KMV (Crosbie & Bohn, 2003) and Bharath & Shumway (2008), initial asset returns are estimated from historical equity data using the following formula:
σV = σE ( E/ E +F) [5]
Daily log equity returns and their standard deviations are calculated for each asset for the historical period. These asset returns derived above are applied to equation 1 to estimate the market value of assets every day.
The daily log asset return is calculated and new asset values estimated. Following KMV, this process is repeated until asset returns converge. These figures are used to calculate DD and PD:
DD= ln( V/F ) + (µ − 0.52 v) [6]
σv√T
Correlation can be calculated through producing a time series of returns for each firm and then calculating a correlation between each pair of assets. KMV have instead adopted a factor modeling approach to their correlation calculation. KMV produce country and industry returns from their database of publicly traded firms, and their correlation model uses these indices to create a composite factor index for each firm depending on the industry and country (D'Vari, Yalamanchili, & Bai, 2003; Kealhofer & Bohn, 1993).
Credit Metrics (Gupton, Finger, & Bhatia, 1997) incorporates a transition matrix showing the probability (ρ) of a borrower moving from one credit grade to another, based on historical data. For a BBB rated asset:
BBB ρAAA ρAA ρA ρBBB ρBB ρB ρCCC/C ρD
To capture all probability states, the sum of probabilities in each row must equal 1. Transition probability tables are provided by raters such as Moody’s and Standard & Poor’s. The CreditMetrics model obtains forward zero curves for each category (based on risk free rates) expected to exist in a year’s time. Using the zero curves, the model calculates the loan market value (V), including the coupon, at the one year risk horizon. Probabilities in the table are multiplied by V to obtain a weighted probability. Based on the revised table, VaR is obtained by calculating the probability weighted portfolio variance and standard deviation (σ),then calculating VaR using a normal distribution (for example 1.645σ for a 95% confidence level).
To calculate joint probabilities, Credit metrics (Gupton et al., 1997) requires that the mean values and standard deviations are calculated for each issue. Each 2 asset sub portfolio needs to be identified and the following equation (using a 3 asset example) applied
2.4 Credit Risk enhancement
Credit enhancement is the technique of risk-sharing and mitigation to facilitate commercial performances and operations in line with the institute’s objectives and goals. The fundamental tasks include customers or client development operations, credit-based financial transactions efficiency and effectiveness, transactions performance, innovations, transparency, and risk awareness and others (Ogilo, 2012). Client development is basic and integral part of the commercial success and profitability. It is a demand-driven operation that grounded into the financial institutes’ strategies and interests’ frameworks towards the economic developments (Robert & Stuart, 2000). Efficiency and effectiveness is a key to the commercial sectors in terms of their development and impacts it focusing on healthy and operable financial transactions and its comparative advantages (in consideration of their long-term and/or sovereign risk) while letting its financing clients focus on their comparative advantages (such as short-term, medium-term, and/or commercial risks). The process is integrating marketing or commercial operations, its flexibility and innovations, transparency and risk awareness. Furthermore, credit enhancement is the process of transactions functionality and accountability, credit administrations, innovation and knowledge management, credit-enhancing awareness and others. Therefore, the credit-enhancing technique is the process of a close consultation with financial operations and clients through their actuators. The transaction operation activity is the leading to structure and due diligence of the strategic benefits of their macro commercial goals and objectives. As the operational administrations, it refers to the process of commercial transactions in conjunction with financial industry aims, equity investment, or technical assistance of the strategies that need to be its further innovative performance. It is important in relation to knowledge management to maintain and update actuators instructions and guidelines for processing and implementing proper credit management and its transactions, which leads to its awareness and enhancement strategic developments. It is a systematic and tactical to involve mandated credit transaction managements and operations including, financial industries performances, ensure economic growth and technological innovations.
2.5 Credit Risk Management
Credit risk management in financial institutions has become crucial for the survival and growth of these institutions (Afriyie & Akotey, 2012). It is a structured approach of uncertainty management through risk assessment, development of strategies to manage it and mitigation of risk using managerial resources (Afriyie & Akotey, 2012).
The strategies of credit risk management involves transferring risk to other parties, avoiding risks, reducing the negative influence of risk and accepting some or all of the consequences of a particular risk (Afriyie & Akotey, 2012).
According to Van Gestel and Baesens, credit risk is managed in various ways. The most important method starts with appropriate selection of the counterparts and products (Gestel & Baesens, 2008). And good risk assessment model and qualified credit officers are key requirements for selection strategy (Gestel & Baesens, 2008). For counterparts with higher default risk, banks may need more collateral to reduce risk. And the pricing of product should be in line with the estimated risk. Secondly, limitation rule of credit risk management restricts the exposure of bank to a given counterpart (Gestel & Baesens, 2008). It avoids the situation that one loss or limited number of losses endangers the bank’s solvency (Gestel & Baesens, 2008). Bank’s determinants on how
much credit a counterpart with a given risk profile can take need to be limited. Thirdly, the allocation process of banks provides a good diversification of the risks across different borrowers of different types, industry, and geographies (Gestel & Baesens, 2008). As a result, diversification strategy spreads the credit risk thus avoids a concentration on credit risk problems. Last but not least, banks can also buy credit protection in forms of guarantees through credit derivative products (Gestel & Baesens, 2008). By the protection, the credit quality of guaranteed assets has been enhanced.
These techniques are translated in the daily organization by written procedures and policies which determine how counterparts are selected, risk profile loans are granted and above which level an expert evaluation is required (Gestel & Baesens, 2008, p.43).
2.6 The need of establish appropriate credit risk management
Credit risk is core components and parcel of financial intermediation. The CRM by financial intermediaries is critical to the institutional viability and sustained growth. Credit risk is vitally important to market segment when a large contributing factor to that perception may be a lack of adequate credit risk evaluation and management techniques. It means that the case with DCs commercial transaction weak performance to favor clients with establishing credit histories and significant collateral. As a result, a relatively small number of financial intermediaries have a presence in DCs markets, and an even smaller number have significant credit operations portfolios. This limited presence of financial intermediaries in DCs areas and the bias against financial transacting creates access and segmentation problems. Therefore, DCs CRM has insignificant economic and social consequences. Poor access to formal financial services and in particular credit, contributes to persistent poverty, lower economic growth rates, and high income and asset inequality (Büyükşalvarcı&Abdioğlu, 2011; Michel et al, 2000). The countries poverty rates in is high and vulnerable to weather change and political instabilities. Thus, more focus on CRM is essential to innovate to take proper commercial operations and performances that empower their economic growth too. Them CRM techniques and innovations is playing fundamental roles to credit expansion, which promote: (i) the greater use of credit scoring models in consumer finance; (ii) the wider use of securitization in mortgage lending;(iii) the greater use of statistical models based on market valuation and accounting information in corporate and small business lending; and (iv) the use of credit derivatives and swaps, which serve to lower transaction costs, improve liquidity, maintain asset quality, and transfer risk to third parties. These techniques may not be fully transferable to DCs financial transactional operations.
2.7 Credit worth and risk management evaluation techniques
The objective of financial institutions is to maximize shareholder value by mobilizing deposits and lending them to firms and clients with transactional operations (Irena et al., 2014). The financial sectors seek to generate a profit by having interest income, fees, and investment or trading income exceed the interest paid on deposits, borrowings, and all operating costs. Even if the institution is member-owned or has a philanthropic motivation, the principle of earning a profit still applies. Obtaining a positive net income is imperative for performances and sustainability. Therefore, proper interactions of credit risk measures and profitability performance of commercial operations vitally paramount, which provide a fundamental credit analysis flow as it showing in fig.2.
Figure.2 Credit analysis for risk management work-flow
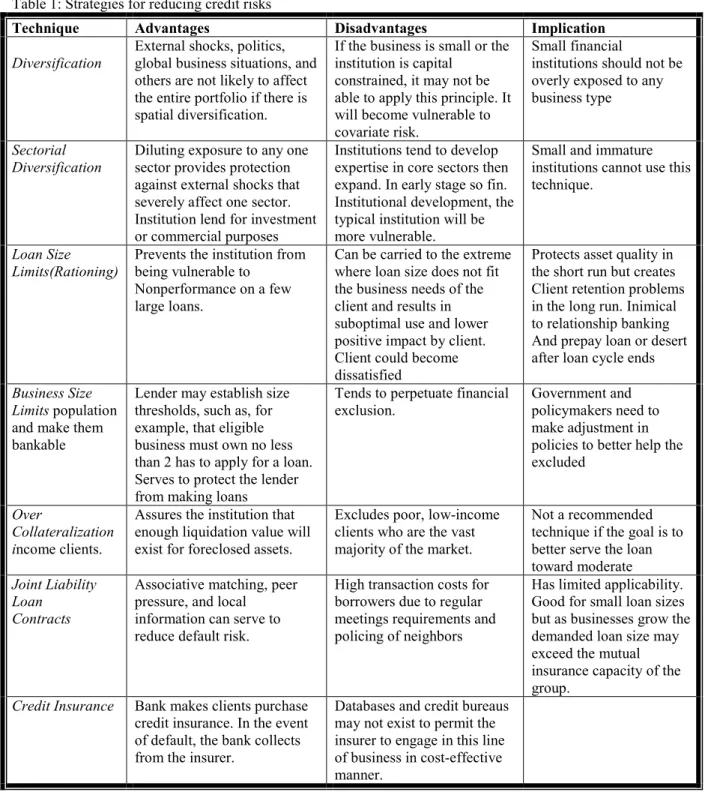
Besides clear discrimination of the credit analysis work-flow as showed fig.1 developing operable risk minimization techniques is paramount, which support to panoply of other strategies is paramount, which support lenders existing devices to reduce credit risk in the overall loan portfolio. The fundamental techniques are summarizing in Table.1. The table provides a list of the techniques used in financial markets. All are common except for credit risk insurance and portfolio securitization.
Table 1: Strategies for reducing credit risks
Technique Advantages Disadvantages Implication
Diversification
External shocks, politics, global business situations, and others are not likely to affect the entire portfolio if there is spatial diversification.
If the business is small or the institution is capital
constrained, it may not be able to apply this principle. It will become vulnerable to covariate risk.
Small financial
institutions should not be overly exposed to any business type
Sectorial Diversification
Diluting exposure to any one sector provides protection against external shocks that severely affect one sector. Institution lend for investment or commercial purposes
Institutions tend to develop expertise in core sectors then expand. In early stage so fin. Institutional development, the typical institution will be more vulnerable.
Small and immature institutions cannot use this technique.
Loan Size Limits(Rationing)
Prevents the institution from being vulnerable to
Nonperformance on a few large loans.
Can be carried to the extreme where loan size does not fit the business needs of the client and results in suboptimal use and lower positive impact by client. Client could become dissatisfied
Protects asset quality in the short run but creates Client retention problems in the long run. Inimical to relationship banking And prepay loan or desert after loan cycle ends Business Size
Limits population and make them bankable
Lender may establish size thresholds, such as, for example, that eligible business must own no less than 2 has to apply for a loan. Serves to protect the lender from making loans
Tends to perpetuate financial exclusion.
Government and policymakers need to make adjustment in policies to better help the excluded
Over
Collateralization income clients.
Assures the institution that enough liquidation value will exist for foreclosed assets.
Excludes poor, low-income clients who are the vast majority of the market.
Not a recommended technique if the goal is to better serve the loan toward moderate Joint Liability
Loan Contracts
Associative matching, peer pressure, and local
information can serve to reduce default risk.
High transaction costs for borrowers due to regular meetings requirements and policing of neighbors
Has limited applicability. Good for small loan sizes but as businesses grow the demanded loan size may exceed the mutual insurance capacity of the group. Credit Insurance Bank makes clients purchase
credit insurance. In the event of default, the bank collects from the insurer.
Databases and credit bureaus may not exist to permit the insurer to engage in this line of business in cost-effective manner.
3 Model based credit risk analysis
As the specific case study for this approach empirical analysis, secondary data was used to investigate the impact of credit risk management on performance of Commercial Banks in Ethiopia. Secondary data was gathered from nine (09) commercial banks commercial banks in Ethiopia. The secondary data were obtained from various sources such as Annual Financial Statements (balance sheet and income statement) of the selected commercial banks, Annual publications of National Bank of Ethiopia, relevant articles, books and magazines etc. The panel data of a six year period from 2009 to 2014 from the selected commercial banks were used to examine the relationship between credit risk management and performances. We adopt a panel data model (Ken & Peter, 2008), which provide a meaningful understanding and insights for credit risk management performances. The analysis explores based on the two most common factors of Return, Return on Asset (ROA) and Return on Equity (ROE) as the indicators of profitability in two different models. Capital Adequacy ,Loan provision to Total (LP/TL), Non-performance Loan to Total Loan(NPL/TL), Loan Provision to Non-Performing Loans
(LP/NPL), Loan Provision to Total Assets (LP/TA) and Loan provision to Total loan (LP/TL) were used as measure of credit risk . To account for unexplained change on profitability performance by credit risk measures used in the model error terms was included in the model, which defined model as follows:
Model 1: = β0+β1 +β2 + β3 LPNPL +β4LPTA +β5LPTL+e Model 2: = β0+β1 +β2 +
β3 LPNPL +β4LPTA + β5LPTL+e
Where;
β0= Constant parameter β1-β5= Coefficient of Independent variables
Return on assets (ROA) is the ratio of net income and total resource (asset) of the institute or company. It measures the efficiency of financial transactions management in generating profit out of its scarce resource. The more the amount of return on assets the better the efficiency of the transaction management, which is good for the domain. Return on equity (ROE) is the other variable used to measure profitability performance. It is a ratio of net income and total equity. It represents the rate of return generated by the Owners’ Equity. Nonperforming loan ratio (NPLR) is the major indicator of commercial banks credit risk. It is the ratio of Nonperforming Loan to Total Loan. It represents how much of the bank’s loans and advances are becoming nonperforming that measures the extent of credit default risk that the bank sustained. As the amount of this ratio increase, it will send a bad message for the management of the banks because it shows a high probability of none recovering the banks major asset. Capital adequacy ratio (CAR) refers to the amount of equity and other reserves which the bank holds its risky assets. The purpose of this reserve is to protect the depositor from any unexpected loss. The BASEL accord II requires banks to hold capital adequacy at least 8% of their risky assets.
3.1 Hypothesis
The following testable hypotheses are formulated in line with the objectives of the study and are therefore subjected to empirical investigation. These hypotheses are stated in the following context:
Hypothesis1:
Null hypothesis (Ho): There are no correlation between CAR, NPLR, LPTLR, LPNPLR and LPTAR and ROA of commercial banks of Ethiopia.
Alternative hypothesis (Ha): There are correlation between, NPLR, LPTLR, LPNPLR and LPTAR and ROA of commercial banks of Ethiopia.
Ho: β1 = β2= 0 Ha: Ho is not true
As we mentioned before, CAR, NPLR, LPTLR, LPNPLR and LPTAR are variables of credit risk management and ROA is one of the variables of profitability performance. This hypothesis is used to test whether the relationship between ROA (profitability performance variable) and CAR, NPLR, LPTLR, LPNPLR and LPTAR (credit risk management variables) of commercial banks exists.
Hypothesis2:
Null hypothesis: There are no correlation between CAR, NPLR, LPTLR, LPNPLR and LPTAR and ROE of commercial banks of Ethiopia.
Alternative hypothesis: There are correlation between CAR, NPLR, LPTLR, LPNPLR and LPTAR and ROE of commercial banks of Ethiopia.
The hypothesis has similar implication with hypothesis 1 but the difference is uses of ROE as the dependent variable, which is another variable of profitability performance.
NPLR = Non-Performing Loans
= Net income Total Asset
=Capital fund Risk weighted asset = Net Income
Shareholder's Equity LPNPL=Loan Provision
Non-Performing Loans LPTA= Loan Provision
Total Assets LPTL=Loan Provision
4 Analysis and interpretation
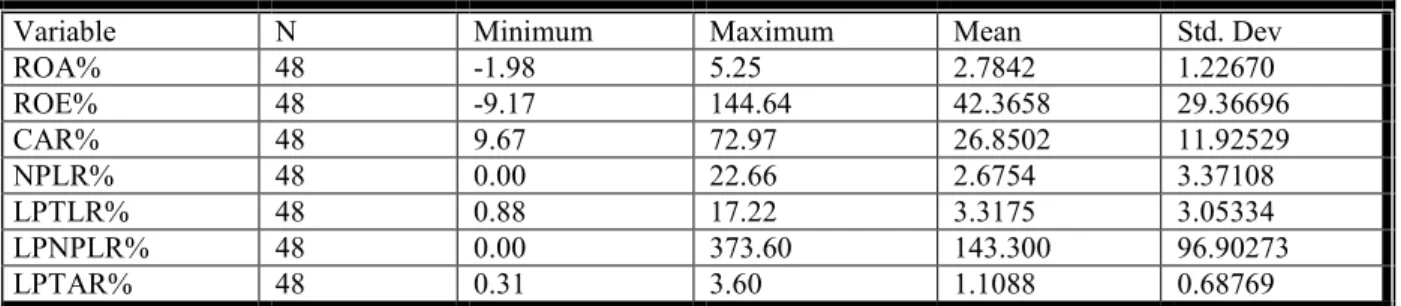
Table2: Descriptive statistics of the variables indicating profitability performance and credit risk management.
Variable N Minimum Maximum Mean Std. Dev
ROA% 48 -1.98 5.25 2.7842 1.22670 ROE% 48 -9.17 144.64 42.3658 29.36696 CAR% 48 9.67 72.97 26.8502 11.92529 NPLR% 48 0.00 22.66 2.6754 3.37108 LPTLR% 48 0.88 17.22 3.3175 3.05334 LPNPLR% 48 0.00 373.60 143.300 96.90273 LPTAR% 48 0.31 3.60 1.1088 0.68769
Source: Authors’ own computation.
In our study we have seven variables. ROA and ROE are measures of performance of banks’ profitability and CAR, NPLR LPTLR, LPNPLR and LPTAR represent the credit risk management. The number of observations for each variable is 48. From the above table 2 the highest standard deviation is LPNPLR which has value of 96.9. The difference between the highest and lowest value of LPNPLR ratio is 373.6.The largest ratio reaches to 373.6 percent and the smallest one is zero (0) percent with the mean and standard deviation of 143.3 and 96.9 respectively, which indicates that sample banks in our study have greater diversification on their LPNPLR ratio and there is also high volatility among the banks’ ability in management credit risk. It is likely that every commercial bank in Ethiopia follows strictly the regulations of National Bank of Ethiopia. However, high standard deviation of the credit risk indicators indicates the credit risk management quality differs among the banks.
The minimum capital adequacy ratio is 9.67 percent which is greater than 8 percent minimum regulatory requirement adopted by Basel Accords and maximum of 26.85 percent which is threefold as minimum capital requirement of Basel Accords.
4.1 Multicollinearity and Heteroscedasticity Test
Before presenting the regression analysis, we test our model to ensure the unbiased result. It is needed to look at the correlation coefficient of independent variables to see whether there is any Multicollinearity between two independent variables. If there is Multicollinearity between the independent variables, the result will be biased. In statistics, Multicollinearity (also collinearity) is a phenomenon in which two or more predictor variables in a multiple regression model are highly correlated, meaning that one can be linearly predicted from the others with a substantial degree of accuracy. In this situation the coefficient estimates of the multiple regressions may change erratically in response to small changes in the model or the data. Multicollinearity is a situation where the explanatory variables are nearly linear dependent (Jurczyk, 2011, p. 262). The following tables are the results for Multicollinearity test:
Table 3: Correlation Matrix for the regression Model1 (ROA)
Variable ROA CAR NPLR LPTLR LPNPR LPTAR
ROA 1 -0.104 -0.127 0.141 0.256 0.286 CAR -0.104 1 0.181 -0.003 -0.265 0.168 NPLR -0.127 0.181 1 0.535 -0.350 -0.107 LPTLR 0.141 -0.003 0.535 1 -0.080 0.396 LPNPR 0.256 -0.265 -0.350 -0.080 1 0.206 LPTAR 0.286 0.168 -0.107 0.396 0.206 1
Source: Authors’ own computation.
Table 4: Correlation Matrix for the regression Model 2 (ROE)
Variable ROE CAR NPLR LPTLR LPNPLR LPTAR
ROE 1 -0.578 -0.142 -0.028 0.394 -0.015 CAR -0.578 1 0.181 -0.003 -0.265 0.168 NPLR -0.142 0.181 1 0.535 -0.350 -0.107 LPTLR -0.028 -0.003 0.535 1 -0.080 0.396 LPNPLR 0.394 -0.265 -0.350 -0.080 1 0.206 LPTAR -0.015 0.168 -0.107 0.396 0.206 1
We can observe that the highest correlation among all the variables is 0.535 which is the correlation between NPLR and LPTLR. However, most researchers prefer that the independent variables are not highly correlated as their absolute values of correlation coefficient are less than 0.8. Considering this we can conclude that there is no problem of Multicollinearity among our variables.
Heteroscedasticity concerns if the variance of the residuals are homogenous or not. It is another requirement for conducting OLS regression. We also used a White test to test the problem of Heteroscedasticity. The results demonstrate a Chi value that is less than the critical value, meaning that we could not reject the hypothesis for Heteroscedasticity. So our observations have the no problem of Heteroscedasticity.
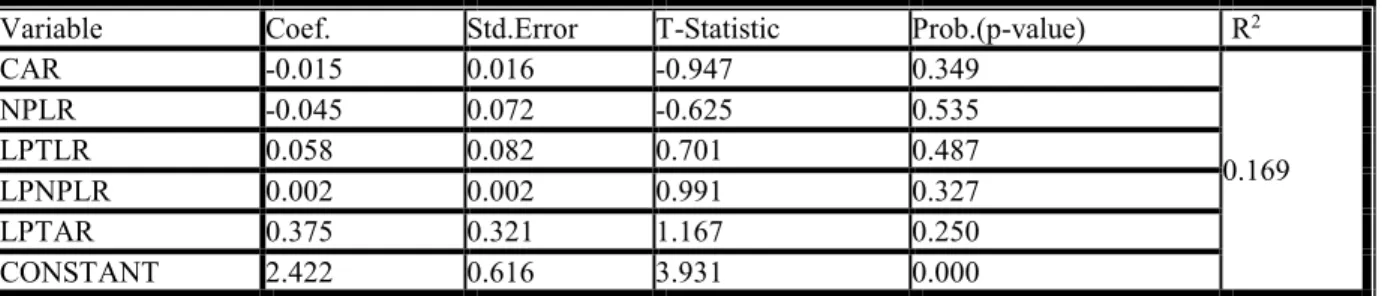
Table 5: Regression Results Model 1
Variable Coef. Std.Error T-Statistic Prob.(p-value) R2
CAR -0.015 0.016 -0.947 0.349 0.169 NPLR -0.045 0.072 -0.625 0.535 LPTLR 0.058 0.082 0.701 0.487 LPNPLR 0.002 0.002 0.991 0.327 LPTAR 0.375 0.321 1.167 0.250 CONSTANT 2.422 0.616 3.931 0.000
Source: Authors’ own computation.
R2 is the proportion of variance in the dependent variable that can be predicted from independent variables. R2 value above table 5 show 16.9 percent indicates the prediction power of dependent variable (ROA) by independent variables. Since R2 is adjusted to find out how much fitness probably happen just by luck: the difference is amount of fitness by chance. R2 is an overall measurement of the strength of association, and does not reflect how any independent variable is associated with the dependent variable.
The Probability value (P-value) is used to measure how reliably the independent variables can predict the dependent variable. It is compared to the significance level which is typically 0.05. If the P-value is greater than 0.05, it can be said that the independent variable does not show a statistically significant relationship with the dependent variable. The first regression analysis shows that the p-value for all independence variables is greater than 5 percent. Under the condition that the level of significance is 5 percent, a p-value less than the 5 percent should be required to reject null hypothesis. We can observe above table number 5, p-value of all independent variables is more 0.05. Therefore, the first part of null hypothesis 1 that “there is no correlation between CAR, NPLR, LPTLR, LPNPLR and LPTAR and ROA” should not be rejected. This means that we are unable to exclude the possibility that the effect we have observed between CAR, NPLR, LPTLR, LPNPLR and LPTAR and ROA is caused by chance. In other words, the results for regression analysis model 1 demonstrate that the relationship between CAR, NPLR, LPTLR, LPNPLR and LPTAR and ROA are insignificant. The regression results of the study suggest that CAR and NPLR of the banks are significantly negatively related with ROA. The parameter value shows that 1% increase in Capital Adequacy decreases ROA by 1.5% and 1% increase in Non-Performance Loans (NPL) decrease ROA by 4.5%.In addition to that 1% increase in LPTLR increase ROA by 5.8%. On the other hand the regression results show that LPNPLR and LPTAR of the banks is significantly positively related to ROA. The parameter value shows that 1% increase in LPNPLR increase ROA by 0.2% and 1% increase in LPTAL increase ROA by 37.5%.
Table 6: Regression Results Model 2
Variable Coef. Std.Err. T-Statistic P-value R2
CAR -1.325 0.327 -4.051 0.000 0.403 NPLR -0.911 1.457 -0.626 0.535 LPTLR 0.874 1.673 0.522 0.604 LPNPLR 0.081 0.041 1.987 0.054 LPTAR 2.904 6.526 0.445 0.659 CONSTANT 63.618 12.507 5.086 0.000
Source: Authors’ own computation.
The second regression analysis above table 6 shows that R2 value of 40.3percent indicates the prediction power of dependent variable (ROE) by independent variables (CAR, NPLR, LPTLR, LPNPLR and LPTAR). The second regression analysis shows that the p-value for CAR is 0.000. Under the condition that the level of significance is 5 percent, p-value less than 5 percent should be required to reject null hypothesis. Therefore, the first part of null hypothesis 2 that “there is no correlation between NPLR, LPTLR, LPNPLR and LPTAR and ROE” should not be rejected while the second part of null hypothesis 2 that “there is no Correlation between CAR and ROE” should be rejected. This means that we are unable to exclude that the effect between
NPLR, LPTLR, LPNPLR and LPTAR and ROE is caused by chance and we are able to exclude that the effect between CAR and ROE is caused by chance. In other words, the results for regression analysis 2 demonstrate relationship between NPLR, LPTLR, LPNPLR and LPTAR and ROE is insignificant while the relationship between CAR and ROE is significant. Model 2 regression results of our study suggest that CAR and NPLR of the banks are significantly negatively related with ROE. The coefficient value shows that 1% increase in Capital adequacy decreases 132.5 percent and 1% increase in NPLR decreases ROE by 91.1 percent. Besides that 1% increases in LPTLR, LPNPLR and LPTAR increases ROE by 87.4 percent, 8.1 percent and 290.4 percent respectively.
4.2 Implication of our results
In accordance with some of the previous researches, including the research conducted by Ara, Bakaeva and Sun (2009) in Sweden, the research conducted by Tibebu (2011) and Million Gizaw (2013) in Ethiopia and the research conducted by Samy and Magda (2009) in Egypt. All of these researches found a positive relationship between CAR and ROE or between CAR and ROA. But we found that CAR has negative relationship with both ROA and ROE. That is to say, the CAR could negatively affect the banks’ profitability performance. From theory point of view, the negative number could mean that keeping too much capital can be a matter of concern in terms of profitability and efficiency.
In theoretical view, Loan loss provision is contra profit account which leads to negative effective on profitability performance of bank, unfortunately we found positive correlation coefficient which implies that there is positive relation between bank profitability performances. However, the same result was found by Million and Matewos (2013) in Ethiopia and suggest that the managers clearly recognized the risk arising from lending business and strengthens their credit risk management capacity in addition to allowing high loan loss provisions and it could turn to high profit. In general the basic assumption behind Loan loss provision is that banks managers reflect their belief toward the bank’s asset quality.
5. Conclusion and future direction
The paper tries to identify the prevailing relationship between credit risk management and profitability performance as a specific case of commercial banks in Ethiopia. Previous studies in Ethiopia were very few, and studies, in general, were inconclusive. Motivated to fill this gap a descriptive statics and panel data we discussed in details for the importance of CRM towards the profitability performance. Therefore, the result revealed that credit risk profile for a financial transaction or commercial market has been improving in the last one decade. The ratio of the nonperforming loan is sharply declining in recent past. Moreover the capital adequacy ratio of commercial banks was higher than regulatory requirement at local and international level, this analysis indicated commercial transactions have hold excessive capital which leads negative effect on profitable of commercial market and also has adverse impact on the economic growth of the countries. Finally, the regression results of the study suggest that CAR and NPLR of the banks are significantly negatively related with ROA and ROE and LPTLR, LPNPLR and LPTR significantly positively related with ROA and ROE. Credit risk management in financial institutions is a broad, a dynamic and crosscutting issue. So that, credit risk detection, isolations, and categorizations are not included in this study, which can be researching in the future.
Acknowledgement
We want to thank and express our great gratitude to all those who helped with the completion of the thesis. First, we would like to thanks to God who help us in every situation. Also, our gratitude goes to our supervisor Pr. Lu Anwen for his encouragement and suggestions during the research and writing process of this paper. We are very thanks to the anonymous reviewers, and the works are supported by Chongqing University of Post and
Telecommunication postgraduate. Above all, we thanks to Almighty God for all your mercies.
References
[1] AbdulazizAlrashidi& Omar Baakeel (2012) the Impact of Operational Risk Management on the Financial, London, UK,
[2] AdamuIdama et al. (2014) Credit Risk Portfolio Management in Microfinance Banks: Conceptual and Practical Insights, Universal Journal of Applied Science 2(6): 111-119,
[3] Alfred Kesenwa et al (2014) Effects of Strategic Decision Making on Firm`s Performance: A Case Study of Safari.com Limited, Nairobi, Kenya, International Journal of Business and Social Science Vol. 4 No. 13, pp. 93-105,
[4] Allen F, Otchere I, Senbet LW (2011) African financial systems: A review. Rev. Dev. Finance doi:10.1016/j.rdf.Vol.3, pp. 3-15,
[5] Andre Scheerer (2000) Credit Derivatives: An Overview of Regulatory Initiatives in the United States and Europe, Fordham Journal of Corporate & Financial Law, Vol. 5, Issue 1, pp. 150-173,
[6] Andries Alin Marius et al. (2012) Determinants of bank performance in cee Countries, Vol.5, Issue 2, pp. 165-177,
[7] Angela MK (2010) Credit Risk Management and Profitability of Commercial Banks in Kenya,
[8] Angklomkliew S, George J, Packer F (2009). “Issues and developments in loan loss provisioning: the case of Asia”, BIS Q. Rev. pp.69-83,
[9] Asad Abbas1 et al. (2014) Credit Risk Exposure and Performance of Banking Sector of Pakistan, J. Basic. Appl. Sci. Res., 4(3)240-245,
[10] BakloutiIbtissem&AbdelfettahBouri (2013) Credit risk management in microfinance: the conceptual framework, ACRN Journal of Finance and Risk Perspectives Vol. 2, Issue 1, pp. 9 – 24,
[11] Boahene SH, Dasah J, Agyei SK (2012). “Credit risk and profitability of selected banks in Ghana” Research Journal of Finance and accounting.
[12] Büyükşalvarcı A, Abdioğlu H (2011). Determinants of capital adequacy ratio in Turkish Banks: A panel data analysis. Afr. J. Bus. Manage. 5(27):11199-11209.
[13] Charles K. Addo and Stephen B. Twum (2013) Sustainability of microfinance institutions in developing countries through sound credit risk management: evidence from business experience, purpose of loan, loan term, and profit maximization motive, Global Journal of Finance and Banking Issues Vol. 7. No.7. Pp. 9-18,
[14] Charles O, Kenneth UO (2013). The impact of Credit Risk Management and Capital Adequacy on the Financial Performance of Commercial banks in Nigeria. J. Emerging Issues Econ. Finance Bank. 2(3) [15] Chikolwa, Bwembya and Chan, Felix (2008) Determinants of commercial mortgage backed securities
credit ratings: Australian evidence. International Journal of Strategic Property Management,12(2). pp. 69-94,
[16] Fan Li and Yijun Zou “The Impact of Credit Risk Management on Profitability of Commercial Banks”A Study of Europe.
[17] Francis Oduya Amanda (2014) Credit Risk Management Practices of Commercial Banks in Kenya, European Journal of Business and Management, Vol.6, No.34, pp. 21-62,
[18] Idowu Abiola (2014) The impact of credit risk management on the commercial banks performance in Nigeria, International Journal of Management and Sustainability, 2014, 3(5): 295-306,
[19] Idowu Abiola, Awoyemi Samuel Olaus” The impact of credit risk management on the commercial banks performance in Nigeria “http://www.pakinsight.com/pdf-files/ijms-2014-3%285%29-295-306.pdf
[20] Indiael Kaaya “Credit Risk and Commercial Banks Performance in Tanzania:a Panel Data Analysis” https://www.google.com/webhp? source= search_app&gws_rd=sslq=Credit Risk and Commercial Banks Performance in Tanzania:a Panel Data Analysis
[21] Irena Mačerinskiene et al. (2014) The Financial Crisis Impact on Credit Risk Management in Commercial Banks, KSI transactions of knowledge society, Vol. 7, No.1, pp. 5-16,
[22] Ken Brown & Peter Moles (2008) Credit Risk Management, London, UK,
[23] Kolapo, T. Funso (Corresponding Author), Ayeni, R. Kolade (Ph.D), Oke, M. Ojo (Ph.D) “Credi trisk and
commercialbanks’performanceinNigeria:apanelmodelapproach ”http://ajbmr.com/articlepdf/aus_20_70i 2n2a4.pdf
[24] Khalil Elian Abdelrahim (2013) Effectiveness of Credit Risk Management of Saudi Banks in the Light of Global Financial Crisis: A Qualitative Study, Asian Transactions on Basic and Applied Sciences, Vol. 03, Issue 2, pp. 73-90,
[25] Martin Elinga&HatoSchmeiser (2010) Insurance and the Credit Crisis: Impact and Ten Consequences for Risk Management and Supervision, the International Association for the Study of Insurance Economics, 35, pp. 9 – 34,
[26] Michel Crouhy et al. (2000) A comparative analysis of current credit risk models, Elsevier, Journal of Banking & Finance 24 pp. 59-117,
[27] Million Gizaw ,Matewos Kebede and sujata “The impact of credit risk on profitability performance of commercialbanksinEthiopia”http://www.academicjournals.org/article/article1423224256_Gizaw%20et %20al.pdf
[28] Ravi Prakash Sharma Poudel (PhD ) (2012) “The impact of credit risk management on financial performanceofcommercialbanksinNepal”http://www.ijac.org.uk/images/frontImages/gallery/Vol._1_No ._5/2.pdf