4
Open Source Software Evaluation Models
To this point, we have shown the basic elements and highlighted their importance when considering new software acquisition. The OSS selection process in any
organization should at least consider gains, either in business strategy, IT strategy, or technical matters that support, improve or create a competitive advantage in the market. According to Navica (2012),“The Open Source Maturity Model is a vital tool for
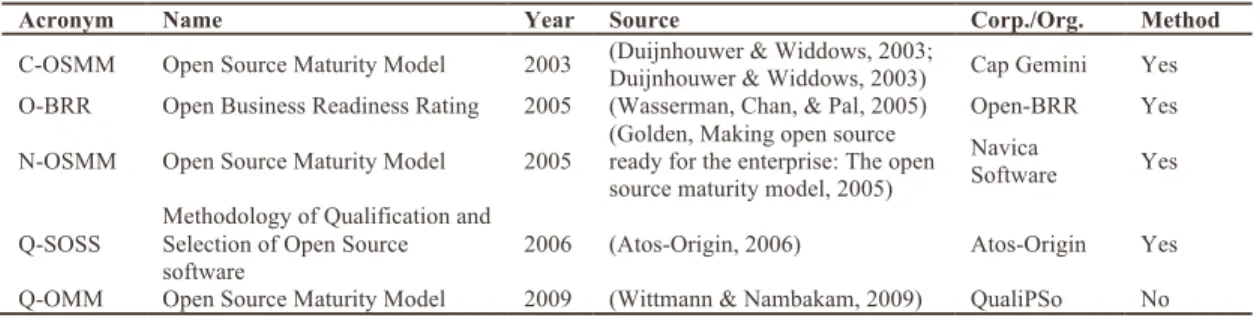
planning open source success”. Several assessments or models have been created over the years with the primary objective being to provide for the organization tools to evaluate the trustworthiness of OSS and to learn whether or not it is suitable for the organization. As well, these are evidence of the interest and the need of different organizations to systematically assess the quality of a specific OSS. These models can be adapted into a straightforward. Table 4 lists the identified OSS evaluation approaches in chronological order. The last column “Method” indicates whether or not a model has a well-defined method for describing the required activities, tasks, outputs and inputs.
Acronym Name Year Source Corp./Org. Method
C-OSMM Open Source Maturity Model 2003 (Duijnhouwer & Widdows, 2003; Duijnhouwer & Widdows, 2003) Cap Gemini Yes O-BRR Open Business Readiness Rating 2005 (Wasserman, Chan, & Pal, 2005) Open-BRR Yes N-OSMM Open Source Maturity Model 2005
(Golden, Making open source ready for the enterprise: The open source maturity model, 2005)
Navica
Software Yes Q-SOSS
Methodology of Qualification and Selection of Open Source software
2006 (Atos-Origin, 2006) Atos-Origin Yes Q-OMM Open Source Maturity Model 2009 (Wittmann & Nambakam, 2009) QualiPSo No
Four out of five models in the table have got well-defined methods. These were designed to evaluate extensively an OSS product, and many the same or similar criteria. However, difference does exist between them. The primary difference is that C-OSMM, N-OSMM and Q-SOSS are practical assessment models developed between 2003 and 2005. On the other hand, O-BRRM and Q-OMM were developed after 2007 and they are self-described as scientific assessment models. In the following sections, the most
relevant evaluation and selection models will be broadly described in order to provide background for our evaluation model.
4.1
CapGemini Open Source Maturity Model (C-OSMM)
CapGemini23 created its own model in 2003 in order to provide consultation services for its customers. This model is well known as a collaborative process between consultant and customer. The C-OSMM uses two main criteria, “product indicators”, to assess the maturity of OSS products, and “application Indicators”, to assess whether a product fulfills the user requirements and anticipated needs. Product indicators are the result of measuring a number of objective and measurable facts (Duijnhouwer &
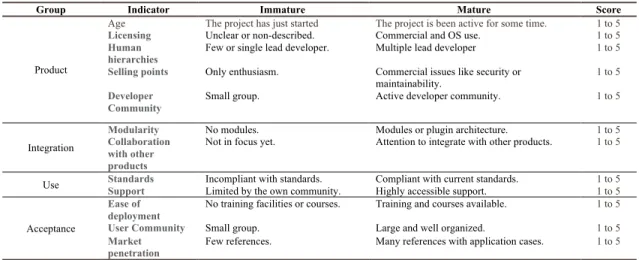
Widdows, 2003) related to OSS. These indicators can be divided in four groups: product, integration, use, and acceptance, which can give us a clear picture of which
characteristics each indicator measures.
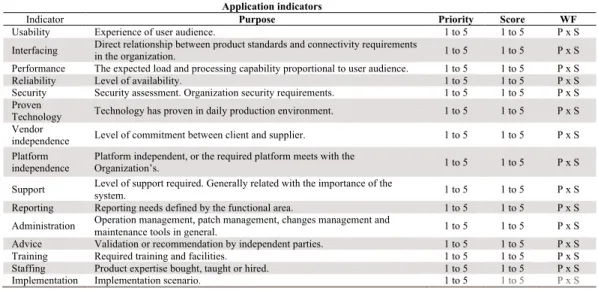
An Open Source product cannot be introduced into a working environment based solely on a measurement of it strengths and weaknesses (Duijnhouwer & Widdows, 2003). As mentioned earlier, “Application Indicators” form the second set of criteria included in the CapGemini model. This group of indicators is intended to take into count the current user ecosystem and future needs. Table 5 shows the importance of these indicators.
Group Indicator Immature Mature Score
Product
Age The project has just started The project is been active for some time. 1 to 5
Licensing Unclear or non-described. Commercial and OS use. 1 to 5
Human
hierarchies Few or single lead developer. Multiple lead developer 1 to 5 Selling points Only enthusiasm. Commercial issues like security or
maintainability. 1 to 5
Developer
Community Small group. Active developer community. 1 to 5
Integration
Modularity No modules. Modules or plugin architecture. 1 to 5
Collaboration with other products
Not in focus yet. Attention to integrate with other products. 1 to 5 Use Standards Support Incompliant with standards. Limited by the own community. Compliant with current standards. Highly accessible support. 1 to 5 1 to 5 Acceptance
Ease of deployment
No training facilities or courses. Training and courses available. 1 to 5
User Community Small group. Large and well organized. 1 to 5
Market
penetration Few references. Many references with application cases. 1 to 5
Table 5 Product Indicators of CapGemini Model.
“Application Indicators” assign a priority determined by the user requirements, in order conclude whether a product is suitable or not. Once the priorities have been fixed having a value from one to five, where one represents unimportant and five represents very important. The indicators get their final values, a weighting factor, by multiplying the priority by the score. For example, assuming that the indicator ‘usability’ has a priority of 5 (five) and the product scores 1 (one) the weight factor will be 5 (five).
Application indicators
Indicator Purpose Priority Score WF
Usability Experience of user audience. 1 to 5 1 to 5 P x S
Interfacing Direct relationship between product standards and connectivity requirements in the organization. 1 to 5 1 to 5 P x S Performance The expected load and processing capability proportional to user audience. 1 to 5 1 to 5 P x S
Reliability Level of availability. 1 to 5 1 to 5 P x S
Security Security assessment. Organization security requirements. 1 to 5 1 to 5 P x S Proven
Technology Technology has proven in daily production environment. 1 to 5 1 to 5 P x S Vendor
independence Level of commitment between client and supplier. 1 to 5 1 to 5 P x S Platform
independence Platform independent, or the required platform meets with the Organization’s. 1 to 5 1 to 5 P x S Support Level of support required. Generally related with the importance of the system. 1 to 5 1 to 5 P x S Reporting Reporting needs defined by the functional area. 1 to 5 1 to 5 P x S Administration Operation management, patch management, changes management and maintenance tools in general. 1 to 5 1 to 5 P x S Advice Validation or recommendation by independent parties. 1 to 5 1 to 5 P x S
Training Required training and facilities. 1 to 5 1 to 5 P x S
Staffing Product expertise bought, taught or hired. 1 to 5 1 to 5 P x S
Implementation Implementation scenario. 1 to 5 1 to 5 P x S
Table 6 Application indicators of CapGemini Model.
Therefore, the "CapGemini Open Source Maturity Model" is not necessarily dependent solely on the OSS’ maturity, but also assesses user needs.
4.2
Business Readiness Rating Model (O-BRRM)
The Business Readiness Rating Model (O-BRR) was developed by Spike Source, the Center for Open Source Investigation at Carnegie Mellon West, and Intel Corporation (Wasserman, Chan, & Pal, 2005). Unlike other models, BRR has five ranks from one (1) representing “Unacceptable”, to five (5) representing “Excellent”. Furthermore the O-BRR is comprised of four phases shown in Figure 4: quick assessment, target usage assessment, data collection and processing, and data translation.
Figure 4 The four phases of Business Readiness Rating Model.
In the Quick Assessment phase, the idea is to quickly eliminate products that are clearly unsuitable and to decide the target usage of the application: mission-Critical, regular, development, or experimental. Later one creates the list of viable candidates, identifying a list of components to be evaluated, in other words, to select a handful of viability indicators based on previously defined target usage (Wasserman, Chan, & Pal, 2005).
Whereas the model provides twelve assessment categories such as functionality, usability, quality, security, performance, scalability, architecture, support, documentation, adoption, community and professionalism, the model recommends using no more than seven (7) of these. It is important to emphasize that these categories are quite similar to the categories in Navica/Golden and CapGemini.
Once the categories have been selected, an average weighting factor must be set to know how much each category should contribute to the final result. The third phase is
Phase 1. • Quick Assessment Filter Phase 2. • Target Usage Assessment Phase 3. • Data Collection & Processing Phase 4.
• Data Translation Readiness Business Rating
by far the most time-consuming, because all measurement data need to be compared with a normalized scale in order to convert the measurement in something meaningful. For example, if we are looking at “total books published”, this phase should reveal whether three to five books is an “acceptable” level and is a good or bad indicator of maturity. However, this phase can include binary metrics (yes or no). For example, “Security: is the communication encrypted?” no, evaluates to one (1) and yes, evaluates to three (3). Finally, taking into account the previous normalized data, the data translation phase calculates the final score by computing the ratings and weighted factors.
4.3
The Navica-Golden Open Source Maturity Model (N-OSMM)
According to the Burton Group Report, Assessing OSS Projects (2005), the Open Source Maturity Model (OSMM) is by far the easiest to use and best documented. The Navica/Golden OSMM was created by Navica’s CEO, Bernard Golden. It was designed to enable organizations to evaluate open source products and understand whether a product can fulfill the organization’s requirements (Golden, Making open source ready for the enterprise: The open source maturity model, 2005).
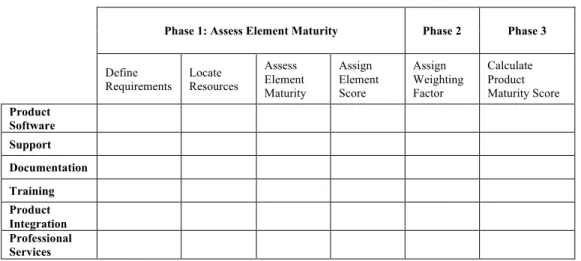
Basically, the OSMM evaluates a product’s maturity in three phases: assess vital product elements, define a weighting factor for each and calculate the product’s overall maturity score. In Figure 5, a graphical representation of the OSMM illustrates the process and gives an understanding of the dependency between phases.
Phase 1: Assess Element Maturity Phase 2 Phase 3 Define Requirements Locate Resources Assess Element Maturity Assign Element Score Assign Weighting Factor Calculate Product Maturity Score Product Software Support Documentation Training Product Integration Professional Services
Figure 5 A graphical Representation of OSMM.
Phase one assesses key elements like software, support, documentation, training, integrations and services, and each of one will obtain a maturity score. At the same time, every element needs to be assessed by the process called “A four-step Methodology”, which is composed of remarkably enough four steps:
1. Define the organization’s specific requirements.
2. Locate related resources, for example identifying whether exists a documentation site aka Wiki, or a community or forum to get support. 3. Assess maturity in order to determine how useful and valuable a product will
be to the organization.
4. Assign a maturity score between zero (0) and ten (10) to document the level of compliance a product element with the organization’s requirements.
In phase two each vital element has been assigned a score, a weight factor will be applied to indicate its importance to the overall maturity of the project.
In phase three, the weighted score for each element is summed to provide an overall maturity of the product where the highest possible maturity score is 100.
N-OSMM has relatively few evaluation criteria when compared to C-OSMM and O-BRR. Nevertheless it is well structured with three strong phases giving it a level of flexibility and ease of use.
4.4
Method for Qualification and Selection of OSS (Q-SOSS)
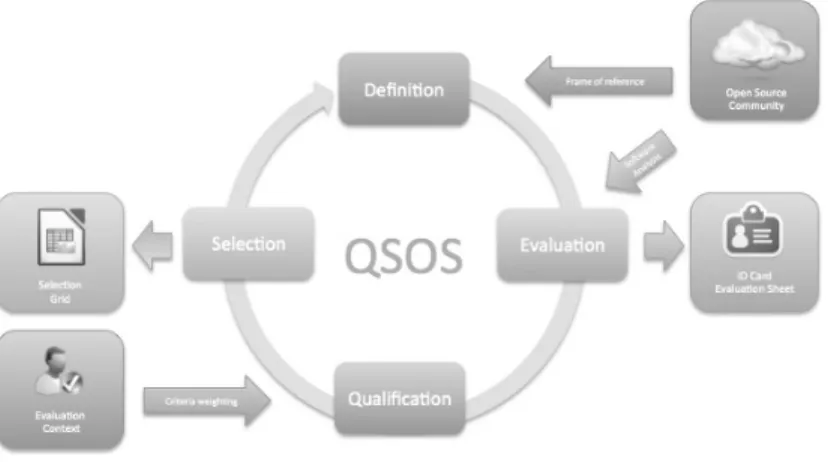
Atos Origin, a French multinational IT services and consulting corporation, headquartered in Bezons, France, created the Qualification and Selection of Open Source Software. This model was developed primarily to qualify and select Free and Open Source Software as a basis to its support and technological survey services (Atos-Origin, 2006). The general process of Q-SOSS consists of four main steps: Definition,
Evaluation, Qualification and Selection as shown in Figure 6.
In the Definition step covers the constitution and enrichment of frames of
reference, which are Software families, types of licenses and types of communities. In the first frame, a hierarchical classification of software will be applied related to its features.
Figure 6 QSOS four main steps.
The frame of reference “type of licenses” will list and classify the major licenses
taking into account the three main criteria: Ownership – defines whether a derived code
become proprietary or may remain free. Virality – specifies whether or not a module
linked to the source code will be affected by the original license. Inheritance – sets the
inevitability of preserving the license in the derived code (Atos-Origin, 2006). Table 5
lists a comparison of common licenses showing the aforementioned criteria.
License Ownership Virality Inheritance
GPL No Yes Yes
CeCILL No Yes Yes
LGPL No Partial Yes BSD Yes No No Artistic Yes No No MIT Yes No No Apache v1.1 Yes No No Apache v2.0 Yes No No MPL v1.1 No No Yes
Common Public License v1.1 No No No
Academic Free License v2.1 Yes No No
PHP License v3.0 Yes No No
Open Software License v.20 No No No
Zope Public License v2.0 Yes No No
Python SF License v2.0 Yes No No
Table 7 Non Comprehensive list of licenses24.
Finally, in the frame of reference “types of communities”, a classification of the OSS project community will occur considering its size. The types of communities included in the model are: Insulated developer, group of developers, organization of developers, legal entity, and commercial entity. Figure 7 shows a graphic representation of these types of communities assessing the number of contributors involved in the software’s lifecycle and support.
The second step involved in this method is Evaluation. It consists of collecting information from the Open Source Community (shown in Figure 7) in order to build the identity card of the software and the evaluation sheet, by scoring on three major axes: functional coverage, risks from the user’s perspective and risks from the service provider’s perspective (Atos-Origin, 2006).
Figure 7 A graphic representation of the types of communities, according to QSOS.
Moreover, the identity card will include the following main elements, each of which has sub-elements listed in Appendix A: General information, Existing services,
Commercial entity Legal entity Organization of developers Group of Developers Insulated developer
functional and technical aspects and synthesis. The evaluation sheet includes more detailed information than the identity card, such as scoring from zero (0) to two (2) the three axes of criteria. For instance, if the functionality is not covered at all, the score is zero (0); if it is completely covered, the score is two (2). The scoring criterion for risks from the user’s perspective includes five categories: intrinsic durability, industrialized solution, integration, technical adaptability and strategy. Each category is further divided as shown in table 8.
Category Criterion Sub-Criterion
In tri n si c d u ra b il it y Maturity Age Stability History, know problems Fork probability, source of forking
Adoption Popularity Development Leadership References Contributing community Books Leading team Management style Activity Developers identification Activity on bugs Activity on functionalities Activity on releases
Independence of developments Independence of developments
In d u st ri al ized S ol u ti on s
Services Training Support
Consulting
Documentation Documentation
Quality Assurance Quality Assurance Tools Source Packing Debian FreeBSD HP-UX MacOSX Mandriva NetBSD OpenBSD Redhat/Fedora Solaris SuSE Windows
Exploitability Administration/Monitoring Ease of ergonomics
Te ch n ic al Ad ap ta bi li ty Modularity Modularity
By-products Code modification Code extension
St
rat
egy
License Permissiveness
Protection against proprietary forks
Copyright owners Copyright owners
Modification of source code Modification of source code
Roadmap Roadmap
Sponsor Sponsor
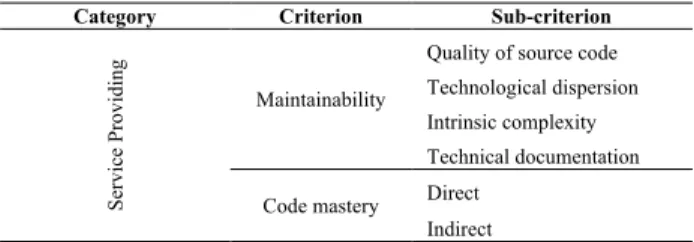
The final evaluation criterion “risk from the service provider’s perspective” estimates how much risk is encountered by a contractor offering services either for support only or for the software delivered in the Software as a Service (SaaS) business model. In certain evaluations this may not be present because a vendor is not necessarily a developer or contributor to an OSS project. This criterion has only one category, “service providing” and its criteria are shown in Table 9.
Category Criterion Sub-criterion
Se rvi ce Pr ovi di ng Maintainability
Quality of source code Technological dispersion Intrinsic complexity Technical documentation
Code mastery Direct
Indirect
Table 9 Risks from the service provider's perspective. Refer to appendix C for the scoring description.
The next step in the QOSS model is “Qualification” where the objective is to define filters that translate the needs and constraints related to a specific requirement. This is accomplished by filtering by identity card (first level) or filtering on a functional grid (second level) which includes all functional requirements the software must meet defined as: required, optional or not required.
Filtering on user and service provider risks relies on a relevance criterion having one of three values: irrelevant, relevant or critical. Both requirements and relevance criteria will be converted into a numerical weighted value at the final step. In that step, “Qualification”, weightings of functionalities and user and provider risks are set, based
on gathered data, in order to identify how close the software comes to meeting the
organization’s requirements relative to other OSS packages in a same family.
4.5
Other models
David A. Wheeler’s Open Source Evaluation Model bases the evaluation in four
steps: identify, read reviews, compare and analyze - IRCA. The author recommends for
the first step to review lists of "generally recognized as mature" (GRAM) or "generally
recognized as safe" (GRAS) OSS/FS programs (Wheeler, 2011) and looking for already
completed OSS assessments on the internet. Reading reviews from user’s communities is
among the most effective ways to learn about OSS strengths and weaknesses, the author
pointed out. The third step is putting together the key software attributes with user
requirements. These attributes are: functionality, cost, market share, support,
maintenance, reliability, performance, scalability, usability, security,
flexibility/customizability, interoperability and legal/license issues (Wheeler, 2011).
Lastly, an analysis of the top contenders must be conducted by trying them out on
representative workloads. This means being pragmatic when looking for a particular
functionality, aside from testing performance and scalability with a representative set of
The Open Source software evaluation model written by Karin van den Berg (Berg, 2005) consists of two steps. In the first step selection on the candidate list is performed, using four of the criteria: Functionality, Community, Release Activity and Longevity (Berg, 2005), in order to evaluate the candidates quickly. After filtering the results to generate a ‘short list’ of candidates, they are evaluated in-depth in the second step. Van den Berg gives a case study to test this model on real OSS applied to Course Management Systems.
4.6
Summary
The existing OSS evaluation models suggest selection guidelines with similar criteria. Thus they provide recommendations on how to conduct the analysis. Comparing N-OSMM to C-OSSM, the latter has the broader scope. None of the models presented thus far include Interoperability. That is one characteristic that both CSS and OSS must meet, to be considered enterprise ready.
Considered that O-BRR does not include IT management, administrative or interoperability in any explicit criteria, even though it is a model based on business readiness. Neither the Navica or the CapGemini maturity model takes into account this important element. In contrast, the QSOS model does contain three IT management indicators: training, consulting and support.
In order to provide a solution to the absence of IT management indicators and to enhance the evaluation criteria, we have designed a new OSS selection model that includes missing indicators and comprises mature practices of O-BRR, Q-SOS, N-OSMM and C-N-OSMM. These new criteria are TCO-centric and interoperability-related. Moreover, we are consolidating twelve useful indicators from other models that