Zoha, A., Saeed, A., Imran, A., Imran, M. A., and Abu-Dayya, A. (2014) A
SON Solution for Sleeping Cell Detection Using Low-Dimensional
Embedding of MDT Measurements. In: 2014 IEEE 25th Annual
International Symposium on Personal, Indoor, and Mobile Radio
Communication (PIMRC), Washington, DC, USA, 02-05 Sep 2014, pp.
1626-1630. ISBN 9781479949120 (doi:
10.1109/PIMRC.2014.7136428
)
This is the author’s final accepted version.
There may be differences between this version and the published version.
You are advised to consult the publisher’s version if you wish to cite from
it.
http://eprints.gla.ac.uk/136677/
Deposited on: 28 April 2017
Enlighten – Research publications by members of the University of Glasgow
http://eprints.gla.ac.uk33640
A SON Solution for Sleeping Cell Detection using
Low-Dimensional Embedding of MDT
Measurements
Ahmed Zoha
∗, Arsalan Saeed
†, Ali Imran
‡, Muhammad Ali Imran
†and Adnan Abu-Dayya
∗∗QMIC, Qatar Science and Technology Park, Doha, Qatar 210531 †CCSR, University of Surrey, Guildford, UK, GU2 9PL
‡University of Oklahoma,Tulsa, USA 71435
[email protected], [email protected], [email protected] Abstract—Automatic detection of cells which are in outage has
been identified as one of the key use cases for Self Organizing Networks (SON) for emerging and future generations of cellular systems. A special case of cell outage, referred to as Sleeping Cell (SC) remains particularly challenging to detect in state of the art SON because in this case cell goes into outage or may perform poorly without triggering an alarm for Operation and Maintenance (O&M) entity. Consequently, no SON compensation function can be launched unless SC situation is detected via drive tests or through complaints registered by the affected customers. In this paper, we present a novel solution to address this problem that makes use of minimization of drive test (MDT) measurements recently standardized by 3GPP and NGMN. To overcome the processing complexity challenge, the MDT measurements are projected to a low-dimensional space using multidimensional scaling method. Then we apply state of the artk-nearest neighbor and local outlier factor based anomaly detection models together with pre-processed MDT measurements to profile the network behaviour and to detect SC. Our numerical results show that our proposed solution can automate the SC detection process with 93% accuracy.
Keywords—Anomaly Detection, Cell Outages, Low-Dimensional Embedding, LTE, Self-Organizing Networks, Sleeping Cell
I. INTRODUCTION
The increased demands of high throughput, coverage and end user quality of service (QoS) requirements, driven by ever increasing mobile usage incur additional challenges for the network operators. One such challenge is the optimization and maintenance of network performance in a cost-efficient manner which can be addressed through high degree of au-tomation in cellular networks. Auau-tomation of the network management process through SON concepts [1] as specified in 3GPP Release 10 standards, is aimed at increasing the robustness and efficiency of LTE network, while minimizing the capital investment and operational expenditures (CAPEX and OPEX). One of the highly desirable functionality in SON is to automate the detection of cells in outage i.e., cells which are not providing normal service level either due to software (SW) or hardware (HW) failure. A special case of cell outage, referred to as Sleeping Cell [1], is particularly tricky to deal with even with SON because in this case cell goes into outage or may perform poorly without triggering an alarm for Operation and Maintenance (O&M) system, consequently no
SON compensation function can be launched. Thus a sleeping cell can remain undetected and uncompensated for hours or even days, unless site visit or drive tests are performed or complaints are received by affected customers.
To overcome this problem, in this paper we present novel solution to automatically detect SC using a machine learning approach. A special case of SC has been examined in which a cell becomes catatonic(i.e., no service is available) due to bidirectional antenna gain failure, which may occur due to the malfunctioning of transmitting and receiving modules in Evolved Universal Terrestrial Radio Access (E-UTRA) NodeB (eNB). The reported studies in literature that addressed the problem of cell outage detection are either based on quantita-tive models [2] which requires domain expert knowledge, or simply rely on performance deviation metrics for detection [3]. Just recently interest has emerged in applying methods from the machine learning domain such as clustering algorithms [4] as well as Bayesian Networks [5] to automate the detection of faulty cell behavior. Colucciaet al.[6] analyzed the variations in the traffic profiles for 3G cellular systems to detect real-world traffic anomalies. In particular, the problem of detecting catatonic sleeping cells has been addressed by leveraging the
Neighbor Cell List (NCL) reports [7] to construct a visibility graph, whose topology changes are used to detect cells that are experiencing outage.
Compared to aforementioned approaches, the solution pro-posed in this paper differs in various aspects. This study adopts a model-driven approach that makes use of mobile terminal as-sisted data gathering solution based on minimize drive testing (MDT) functionality [1] as specified by 3GPP. The main idea of MDT is that the network can request the user equipment to report the key performance indicators (KPIs) including radio specific measurements from the serving and neighboring cells along with the location information. Our proposed method first maps these KPIs to a low-dimensional embedding space and then further uses them in conjunction with global and local anomaly detection models to build a “normal” network profile. This is in contrast to state of the art techniques that analyze one or two KPIs to learn the threshold levels and use it as a reference for detecting network anomalies. The models once learned leverage the intrinsic characteristics of embedded network measurements to automatically recognize SC situation. Moreover, the geo-locations associated to the measurements are used to localize the position of SC, so that 978-1-4799-4912-0/14/$31.00 c2014 IEEE
UE Assisted Rep orting Measurement Profiling Detection Localization RRC Conn
ection O&M Connection
O&M
Fig. 1. An overview of Sleeping Cell Detection and Localization Framework
self-healing functionality can be triggered. To the best of our knowledge, no prior study examines the use of global and local anomaly detection methods from the machine learning domain and subsequently applies it for SC detection. Secondly, the framework provided paves a way towards implementing self-healing functionality in emerging (LTE) as well as future (5G) self organizing networks. Therefore, the proposed solution is validated with simulations that are setup in accordance with 3GPP LTE standard in order to construct MDT database for further analysis. The remainder of this paper is structured as follows: Section II presents the proposed framework for SC detection. It also includes a brief discussion on two state of the art anomaly detection models namely k-nearest neighbor and Local Outlier Factor based Anomaly detector. The details of our simulation setup and evaluation methodology are provided in Section III. Finally, Section IV and V report the results and the conclusion, respectively.
II. SLEEPINGCELLDETECTIONFRAMEWORK The main idea is to use the MDT reports acquired from a fault-free operating scenario to profile the behaviour of the network. The subsequent step is to use the learned profile to identify the SC situation. The proposed SC detection frame-work adopts a four step approach including measurements, profiling, detection and localization as shown in Figure (1). The steps involved are further elaborated in the following subsections.
A. Measurement
The MDT reporting schemes have been defined in LTE Release 10 during 2011 [1]. The release proposes to construct a data base of MDT reports from the network usingImmediate
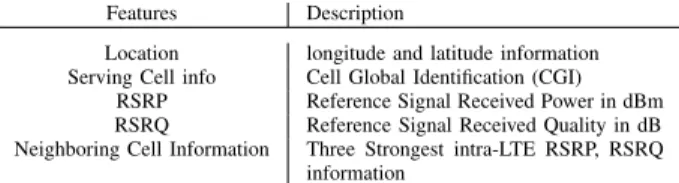
or Logged MDT reporting configuration. In this study, the UE’s are configured based on immediate MDT configuration to report the cell identification and radio-measurement data to eNB, as specified in Table I, periodically as well as whenever an A2 event (i.e., Serving cell becomes worst than athreshold) occurs. The eNB after retrieving these measurements fur-ther appends time and wide-band channel quality information (CQI) and forward it to the O&M system to construct the MDT database. The reports obtained from the reference scenario (i.e., fault-free) acts as a benchmark data and used by the target anomaly detection models to learn the network profile. After the completion of network profiling, the models compare the test measurements against the learned profile to detect possible coverage problems as discussed in the following subsection.
B. Profiling and Detection
In the profiling phase, initially data cleaning and normal-ization operations are performed to pre-process the collected
Features Description
Location longitude and latitude information Serving Cell info Cell Global Identification (CGI)
RSRP Reference Signal Received Power in dBm RSRQ Reference Signal Received Quality in dB Neighboring Cell Information Three Strongest intra-LTE RSRP, RSRQ
information
TABLE I. MDT REPORTED MEASUREMENTS
measurements within the database. The KPIs including refer-ence signal received power and quality of the serving as well as of the three strongest neighbouring cells along with the CQI are augmented into one feature vector as shown in Equation 1
V ={RSRPS, RSRPN1, RSRPN2, RSRPN3,
RSRQS, RSRQN1, RSRQN2, RSRQN3, CQI} (1)
where S and N stands for serving and neighboring cells, respectively. The 9-dimensional feature vector V corresponds to one measurement sample which is further embedded to only three dimensions in the Euclidean space using Multi-Dimensional Scaling (MDS) method [8]. MDS provides a low-dimensional embedding of the target KPI vectors V while preserving the pairwise distances amongst them. Given, at×t
dissimilarity matrix ∆X of the MDT dataset, MDS attempts to findtdata pointsψ1...ψtinmdimensions, such that∆Ψ is
similar to∆X. Classical MDS (CMDS) operates in Euclidean space and minimizes the following objective function
min ψ t X i=1 t X j=1 (δij(X)−δij(Ψ))2 (2) where δij(X) = kxi−xjk 2 and δij(Ψ) = kψi−ψj k 2 . Equation 2 can be reduced to a simplified form by representing ∆X in terms of a kernel matrix using Equation 3
XTX =−1 2H∆ XH (3) whereH=I−1 tee
T andeis a column vector of all 1’s. This
allows us to rewrite Equation 2 as min Ψ t X i=1 t X j=1 (xiTxj−ψiTψj)2 (4)
As shown in [8], that the Ψ can obtained by solving Ψ =
√
ΛVT, whereV andΛare the matrices of topmeigenvectors and their corresponding eigenvalues ofXTXrespectively. The m dimensional embedding of the data points are the rows of
√
ΛVT, whereas the value ofmis chosen to be3in our case. The embedding of KPI’s into a lower dimension has several advantages. First, it makes the framework generic allowing it to incorporate new KPI’s and network-centric features such as call drop ratios, data traffic etc without imposing higher com-putational requirements. Subsequently, the interrelationships of high-dimensional databases can be explored in a lower-dimension space. Second, given the growing complexity of the networks, particularly in case of SON, it is challenging to identify few KPIs that accurately capture the behavior of the system. Thus, the embedded representation of KPI’s not only addresses this challenge but also aids in the cell profiling process by increasing the separation amongst the dissimilar measurements and vice versa. Consequently, the target algorithms obtain a better estimation of data density and
can identify abnormal measurements as anomalies with higher accuracy, as discussed below.
The embedded KPI representation is then used together with state of the art anomaly detection algorithms to learn the ”normal” network profile. This involves defining a SC detection rule to differentiate between normal and abnormal MDT measurements by computing a threshold ’θ’ based on a dissimilarity measure ’D. Thus, the SC detection translates to a binary classification problem which can formally be expressed as follows: f(xi) = N ormal, ifD(xi, DM)≤θ SC, ifD(xi, DM)≥θ (5) where DM is an embedded MDT dataset that contains 70%
samples from the reference scenario. The rest of the samples in the dataset are obtained from the SC scenario to optimize the θ of two state-of-the-art algorithms: k-Nearest Neighbor based anomaly detector (k-NNAD) and Local Outlier Factor based anomaly detector (LOFAD). On the other hand, xi is
the observation obtained from the test dataset Dtest. The k
-NNAD and LOFAD calculate a global and local dissimilarity measure to rank the observed measurements which is used to categorize them as belonging to the normal or a SC scenario, as briefly summarized in the following discussion.
1) k-Nearest Neighbor based Anomaly Detector (k-NNAD):
Let xi be the test instance, and k be thekth neighbor in the DM. To labelxias normal or abnormal, thek-NNADcomputes
aDk−N N AD based on Equation 6 Dk−N N AD(xi,k, DM) = 1 Ntr Ntr X i=1 I(dt≤di) (6)
The Ntr =|DM |, and dt is the distance of xi from its kth
nearest neighbor and di is the distance between iand its kth
nearest training object in DM, whereas I(.) is an indicator
function. Equation 6 represents a global density-based anomaly detection score as proposed in [9]. The test measurement is marked as anomalous if it receives a score greater than the θ
value.
2) Local Outlier Factor based Anomaly Detector (LOFAD):
The LOFAD [10] tries to compare the local density ρ of the object to that of its k neighbors. It constructs a local neighborhood of an instancexi and defines its distance tokth
nearest neighborN N(xi, k):
db(xi, k) =d(xi, N N(xi, k)) (7)
Thedb(xi, k)is used to construct a neighborhoodN(xi, k)by
including all those points which fulfills the following criteria:
d(xi, xj) ≤ db(xi, k). Formally, reachability distance dr is
defined to estimate the ρ(xi, k)as follows:
dr(xi, k) = max{db(xj, k), d(xj, xi)} (8)
andρcan be defined as
ρ(xi, k) =
| N(xi, k)| P
xj∈N(xi,k)dr(xi, xj, k)
(9) The dr(xi, xj, k) ensures that instances that lie farther away
from xi have lesser impact onρ(xi, k). Finally the Dcan be
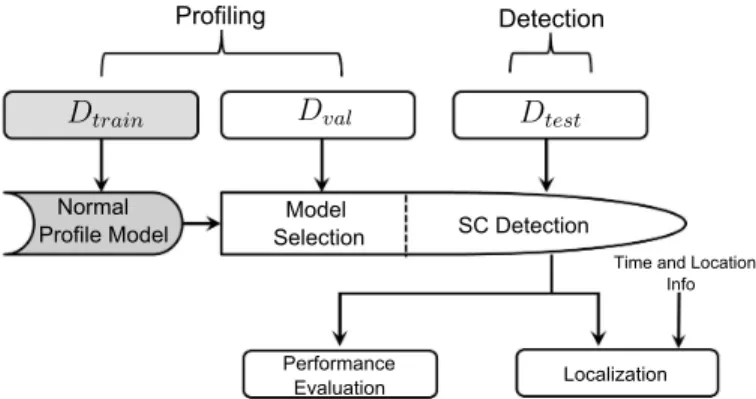
Normal Profile Model Model Selection SC Detection Performance Evaluation Localization
Time and Location Info
Profiling Detection
Fig. 2. An overview of Profiling and SC Detection Framework
calculated by comparing the ρofxi to itsN(xi, k), formally
defined as: DLOF AD(xi, k, DM) = P xj∈N(xi,k) ρ(xj,k) ρ(xi,k) | N(xi, k)| (10)
DLOF AD represents a local density-estimation score whereas
value close to 1 mean xi has same density relative to its
neighbours. On the other hand, a significantly highDLOF AD score is an indication of anomaly.
The parameter selection for k-NNAD and LOFAD is performed using cross-validation (CV) method as listed in Algorithm 1. The DM is divided into training Dtrain and
validation dataset Dval using K-folds approach, whereas the
value of K is chosen to be 10 in our framework. To select the optimal model, each target detector is trained for different values of k and the model achieving the average highest detection score is selected. The detection performance of the selected models are then compared by evaluating them against
Dtest as shown in Figure 2.
Algorithm 1 Model Selection using CV Method 1: Split the target dataset DM into K chunks.
2: forl = 1,2, . . . , K: do
3: SetDvalto be the lthchunk of data
4: SetDtrain to be the other K−1chunks.
5: Fit each model toDtrain and evaluate its performance
onDval.
6: end for
7: Model Selection: Select the model with a average highest detection score
8: Performance Estimation: Evaluate the performance of the selected model onDtest
C. Localization of SC
During the profiling phase, the location information in the MDT measurements is used to estimate the coverage area of the best serving cell which we refer to as dominance area of the eNB. As soon as the SC situation triggers in the network, the malfunctioning eNB becomes no longer available. Conse-quently, the dominance area of the neighboring cells increases to serve the affected area. Therefore, if only CGI information is utilized to localize SC, the anomalous MDT reports within the target area, would erroneously be associated to its neighboring cells. However, the location of SC can be established by
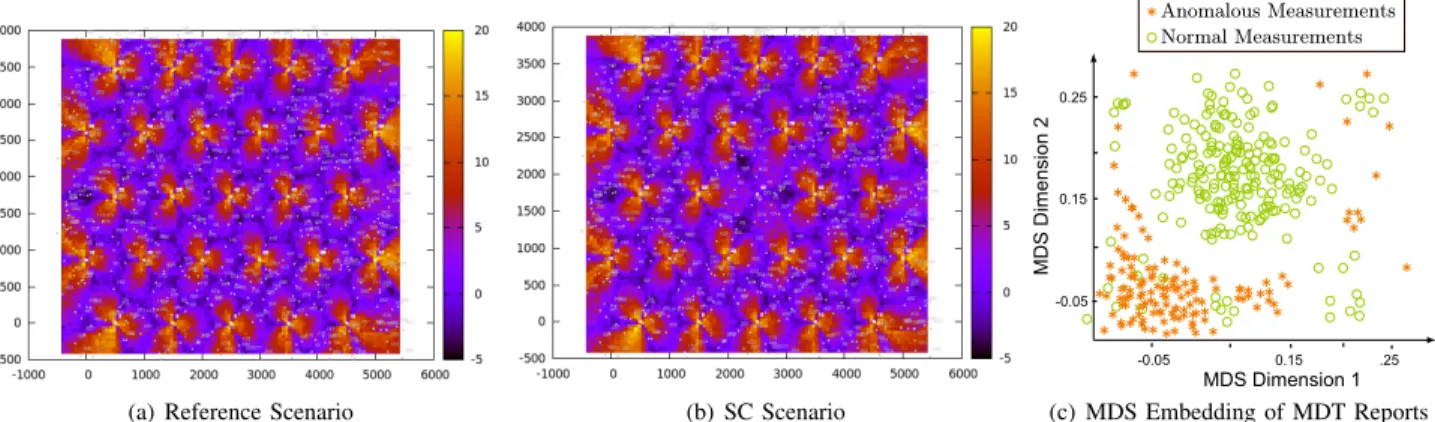
(a) Reference Scenario (b) SC Scenario MDS Dimension 1 MDS Di mensio n 2 Anomalous Measurements Normal Measurements -0.05 0.15 .25 -0.05 0.15 0.25 (c) MDS Embedding of MDT Reports
Fig. 3. (a) SINR plot of reference scenario (b) SINR plot of SC scenario where antenna gain of cell 11 is attenuated to -50 dBi (c) MDT measurements in the embedded space classified into normal and anomalous categories byk-NNAD
Parameter Values
Cellular Layout 27Macrocell sites Sectors 3 Sectors per cell
User Distribution Uniform Random Distribution Path Loss L[dB] = 128.1 + 37.6log10(R)
Antenna Gain (Normal Scenario) 15dBi Antenna Gain (SC Scenario) −50dBi
Slow Fading Std 8 dB
Simulation Length 420s (1 time step = 1ms/1TTI)
BS Tx Power 46 dBm
Network Synchronization Asynchronous
HARQ Asynchronous,8 SAW channels, Maxi-mum Retransmission =3
Cell Selection Criteria Strongest RSRP defines the target cell
Load 20users/cell
MDT Reporting Interval 240 ms Traffic Model Infinite Buffer
HO Margin 3dB
TABLE II. SIMULATIONPARAMETERS
correlating the geo-location of the measurements labelled as anomalous with the dominance areas estimated during the profiling stage. To establish such a correlation, we calculate a standardz-score for each eNB corresponding to its estimated dominance area. The z-score is calculated as zb =
|nb−µn|
σn
wherenb is the number of MDT reports labeled as anomalies
for the eNB b, and variables µn and σn are the mean and
standard deviation scores of the neighbouring cells. The change in the z-score for each eNB in the SC scenario compared to reference scenario is used to localize the position of SC.
III. SIMULATIONSETUP ANDEVALUATIONMETRIC
A. Simulation Setup
A full dynamic system tool is employed to simulate the LTE network based on 3GPP specifications. The simulation run time was 7 minutes for each scenario with parameter configurations as listed in Table II. A reference scenario is used to profile the normal network operating behaviour by collecting the UE reported MDT measurements. In the SC scenario, the antenna gain of cell 11 is attenuated to −50 dBi for a duration of three minutes. The SINR plots of the reference and SC scenario obtained during the simulation has been shown in Figure 3. The collected measurements are used by the global and local anomaly detection models to profile the network which allows them to detect anomalous situations as discussed in Section II.
B. Detection Performance
The Receiver Operating Characteristic (ROC) curves [11] plots the true positive rate or also detection rate (DR) (i.e., a percentage of anomalous measurements correctly classified as anomalies) against the false positive rates (FPR) (i.e., a per-centage of normal cell measurements classified as anomalies). In this study, a standard performance metric named as Area under ROC curve (AUC) is used to access the performance of the target algorithms for detecting anomalous measurements from the SC scenario. The ROC curves are generated by plotting the DR against FPR by varying the θfor each model until a DR value reaches 100%. To select the optimal model for each anomaly detector a parameter search (i.e. k= 1,2, ...30) is performed using Algorithm 1. The final values are found to be 20and8 for fork-NNAD and LOFAD, respectively.
IV. RESULTS ANDDISCUSSION
The employed anomaly detection algorithms profile the network behaviour using local and global approaches. The target models are then used to classify test measurements into normal or anomalous categories. It has been observed that the most of the KPIs from the reference scenario, grouped themselves into a large cluster when projected to an embedded space. Conversely, the measurements belonging to SC lie far from the samples that conforms to normal operations as depicted in Figure 3(c). MDS tries to maximize the variance between the data points and consequently dissimilar points are projected far from each other allowing the models to compute a robust dissimilarity measure for anomaly detection.k-NNAD based global profiling technique that relies on global density estimation procedure outperformed local density estimation method LOFAD, since the anomalous measurements obtained from the outage scenario largely act as global anomalies. Moreover, some of the normal measurement also form small micro clusters. This is due to exceptionally good RSRP values reported by the mobile terminals while they were in close proximity to the serving eNB. However, LOFAD treats them as local anomalies. Additionally, the measurements obtained from the cell edges show similarity with data samples that corresponds to outage scenario. Hence, in the embedded space they are projected close to the samples that corresponds to abnormal measurements. From a classification perspective, the target models wrongly classify such measurements as belonging to a SC scenario. But from a SON perspective,
0 0.2 0.4 0.6 0.8 1 0 0.1 0.2 0.3 0.4 0.5 0.6 0.7 0.8 0.9 1 DetectionnRaten(TPR) FPR RANDOMnCLASSIFIER _
-n-Fig. 4. ROC Curve ofk-NNAD based profiling technique
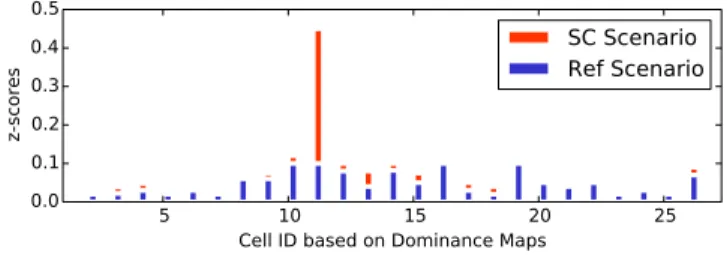
5 10 15 20 25
Cell ID based on Dominance Maps 0.0 0.1 0.2 0.3 0.4 0.5 z-scores
SC Scenario
Ref Scenario
Fig. 5. Cell Dominance areas versusz-scores for Localization of SC
identification of such abnormality indicates a weak coverage problem and can be used to trigger automated actions for coverage optimization. Similarly, some of the UE generated measurements, as a result of radio link failure are also treated as anomalies. Figure 4 shows that k-NNAD achieved a 93% detection rate which is 5% higher than LOFAD at a false alarm rate of 10%. As shown in Table III, the AUC value achieved byk-NNAD and LOFAD are 0.91 and 0.85, respectively, that shows the superiority of global anomaly detection methods over local approaches for profiling the network behaviour.
We use k-NNAD as our target model to calculate the z -score for each eNB separately for reference and SC scenarios as shown in Figure 5. It can be seen that even the cells which are not in outage receives a z-score, since a fraction of the UE reported measurements belonging to their dominance areas are identified as anomalies due to several reasons as already discussed above. Therefore, to classify a cell as a SC, each eNB must collect a minimum number of anomalous reports (i.e.,nb) to achieve a significantly higher z-score compared to
rest of the cells. In our case, we found out that a minimum number of 4800 MDT measurements are required to observe a significant change in the z-score. The value of nb further
determines the detection delay since the measurement count is dependent on the number of active users in the eNB dominance area. For example, in our case 20uniformly distributed UE’s are sending reports with a periodicity of 240 ms, and therefore the system would take approximately one minute to detect an outage situation. Likewise, the delay value can increase or decrease depending on the user density in the target cell.
V. CONCLUSION
This paper has presented a machine learning framework for automating the sleeping cell detection process in an LTE
Model Approach AUC score
k-NNAD Global 0.91
LOFAD Local 0.85
TABLE III. PERFORMANCE OF TARGET ANOMALY DETECTION MODELS FORSC DETECTION
network using minimization of drive testing functionality. The proposed approach builds a normal profile of the network behaviour in a low-dimensional embedding space. The mea-surements are labeled as anomalous if they deviate from the learned profile. For this purpose, multi-dimensional scaling method in conjunction with global and local anomaly detection models were examined. It was found thatk-NNAD, a a global anomaly detection model achieved a higher detection accuracy compared to LOFAD which adopts a local approach for classifying abnormal measurements. Finally the UE reported coordinate information is employed to establish the dominance areas of target cells which are subsequently used to localize the position of sleeping cell. The proposed SC detection framework can act as a foundation for next generation network monitoring tool, since it allow easy inclusion of other key performance indicators from the network and can be extended to detect other issues including coverage holes, weak coverage as well as performance degradation problems.
ACKNOWLEDGMENT
This work was made possible by NPRP grant No. 5-1047-2437 from the Qatar National Research Fund (a member of The Qatar Foundation).
REFERENCES
[1] S. H¨am¨al¨ainen, H. Sanneck, C. Sartori et al., LTE Self-Organising Networks (SON): Network Management Automation for Operational Efficiency. John Wiley & Sons, 2012.
[2] R. Barco, V. Wille, and L. D´ıez, “System for automated diagnosis in cellular networks based on performance indicators,”European Trans-actions on Telecommunications, vol. 16, no. 5, pp. 399–409, 2005. [3] B. Cheung, S. G. Fishkin, G. N. Kumar, and S. A. Rao, “Method of
monitoring wireless network performance,” Sep. 21 2004, uS Patent App. 10/946,255.
[4] Y. Ma, M. Peng, W. Xue, and X. Ji, “A dynamic affinity propagation clustering algorithm for cell outage detection in self-healing networks,” in Proceedings of IEEE Wireless Communications and Networking Conference (WCNC). IEEE, 2013, pp. 2266–2270.
[5] R. M. Khanafer, B. Solana, J. Triola, R. Barco, L. Moltsen, Z. Alt-man, and P. Lazaro, “Automated diagnosis for umts networks using bayesian network approach,”IEEE Transactions on Vehicular Technol-ogy, vol. 57, no. 4, pp. 2451–2461, 2008.
[6] A. Coluccia, A. DAlconzo, and F. Ricciato, “Distribution-based anomaly detection via generalized likelihood ratio test: A general maximum entropy approach,”Computer Networks, vol. 57, no. 17, pp. 3446–3462, 2013.
[7] C. M. Mueller, M. Kaschub, C. Blankenhorn, and S. Wanke, “A cell outage detection algorithm using neighbor cell list reports,” in Self-Organizing Systems. Springer, 2008, pp. 218–229.
[8] T. F. Cox and M. A. Cox,Multidimensional scaling. CRC Press, 2010. [9] M. Zhao and V. Saligrama, “Outlier detection via localized p-value estimation,” inIn Proceedings of 47th Annual Allerton Conference on Communication, Control, and Computing, 2009. IEEE, 2009, pp. 1482–1489.
[10] M. M. Breunig, H.-P. Kriegel, R. T. Ng, and J. Sander, “Lof: identifying density-based local outliers,” inACM Sigmod Record, vol. 29, no. 2. ACM, 2000, pp. 93–104.
[11] A. P. Bradley, “The use of the area under the roc curve in the evaluation of machine learning algorithms,”Pattern recognition, vol. 30, no. 7, pp. 1145–1159, 1997.