University of Kentucky University of Kentucky
UKnowledge
UKnowledge
Theses and Dissertations--Plant and SoilSciences Plant and Soil Sciences
2015
Breeding for Nitrogen Use Efficiency in Soft Red Winter Wheat
Breeding for Nitrogen Use Efficiency in Soft Red Winter Wheat
Katlyn Hitz
University of Kentucky, [email protected]
Right click to open a feedback form in a new tab to let us know how this document benefits you. Right click to open a feedback form in a new tab to let us know how this document benefits you.
Recommended Citation Recommended Citation
Hitz, Katlyn, "Breeding for Nitrogen Use Efficiency in Soft Red Winter Wheat" (2015). Theses and Dissertations--Plant and Soil Sciences. 62.
https://uknowledge.uky.edu/pss_etds/62
This Master's Thesis is brought to you for free and open access by the Plant and Soil Sciences at UKnowledge. It has been accepted for inclusion in Theses and Dissertations--Plant and Soil Sciences by an authorized administrator of UKnowledge. For more information, please contact [email protected].
STUDENT AGREEMENT: STUDENT AGREEMENT:
I represent that my thesis or dissertation and abstract are my original work. Proper attribution has been given to all outside sources. I understand that I am solely responsible for obtaining any needed copyright permissions. I have obtained needed written permission statement(s) from the owner(s) of each third-party copyrighted matter to be included in my work, allowing electronic distribution (if such use is not permitted by the fair use doctrine) which will be submitted to UKnowledge as Additional File.
I hereby grant to The University of Kentucky and its agents the irrevocable, non-exclusive, and royalty-free license to archive and make accessible my work in whole or in part in all forms of media, now or hereafter known. I agree that the document mentioned above may be made available immediately for worldwide access unless an embargo applies.
I retain all other ownership rights to the copyright of my work. I also retain the right to use in future works (such as articles or books) all or part of my work. I understand that I am free to register the copyright to my work.
REVIEW, APPROVAL AND ACCEPTANCE REVIEW, APPROVAL AND ACCEPTANCE
The document mentioned above has been reviewed and accepted by the student’s advisor, on behalf of the advisory committee, and by the Director of Graduate Studies (DGS), on behalf of the program; we verify that this is the final, approved version of the student’s thesis including all changes required by the advisory committee. The undersigned agree to abide by the statements above.
Katlyn Hitz, Student Dr. David Van Sanford, Major Professor Dr. Mark S. Coyne, Director of Graduate Studies
BREEDING FOR NITROGEN USE EFFICIENCY IN SOFT RED WINTER WHEAT
THESIS
A thesis submitted in partial fulfillment of the requirements for the degree of Master of Science in the
College of Agriculture, Food, and Environment at the University of Kentucky
By
Katlyn Hitz
Lexington, KY
Director: Dr. David Van Sanford, Professor of Crop Science Lexington, Kentucky
2015
ABSTRACT OF THESIS
BREEDING FOR NITROGEN USE EFFICIENCY IN SOFT RED WINTER WHEAT
Nitrogen use efficient (NUE) wheat varieties have potential to reduce input costs for growers, limit N runoff into water ways, and increase wheat adaptability to warmer environments. Previous studies have done little to explain the genetic basis for NUE and components, nitrogen uptake efficiency (NUpE) and nitrogen utilization efficiency (NUtE). Four studies were conducted to 1) determine genotypic stability of NUE under high and low N regimes and under warming 2) determine effect of warming on NUE 3) indentify QTL associated with NUE components 4) assess the utility of canopy spectral reflectance (CSR) as a high-throughput phenotyping device for NUE. Genotypic response to N stress or warming varied. Uptake efficiency was found to be more important than utilization efficiency to genotypic performance under high and low N environments and under warming. Selection under low N for NUpE and under high N for NUtE most efficiently identified NUE varieties. Uptake and utilization were lower under warming due to quickened development. No strong correlations between the CSR indices and NUE existed. No QTL were found to be significantly associated with NUE components. Further research into the mechanisms controlling NUE and to reveal plant response to N stress and under warming is necessary.
KEYWORDS: Winter wheat, nitrogen use efficiency, nitrogen uptake efficiency, nitrogen utilization efficiency, warming
Katlyn Hitz
BREEDING FOR NITROGEN USE EFFICIENCY IN SOFT RED WINTER WHEAT
By
Katlyn Hitz
David Van Sanford Director of Thesis
Mark S. Coyne Director of Graduate Studies
iii
ACKNOWLEDGEMENTS
I would like to thank the many people who have helped me through the
completion of my thesis. First and foremost, I give my appreciation to my major advisor, Dr. David Van Sanford for his guidance, encouragement, and constant support
throughout my entire thesis project. Through his leadership, I have grown in confidence and feel prepared to take on the many future opportunities that await me. For that I will be forever grateful. I would also like to thank the members of my committee, Dr. John Grove and Dr. Carrie Knott, for their contributions.
I would like to say a special thank you to past and present Wheat Breeding Program members for their invaluable assistance throughout this research. This project would not have been able to come to completion without their hard work. I would also like to express thanks to fellow graduate student Katie Russell and Dr. Anthony Clark for their help in both field and lab work, along with Sandy Swanson and John Connelly. I would also like to express gratitude to the Triticeae Coordinated Agricultural Project for funding my project and making this research possible.
I would also like to thank my wonderful family and friends for their support throughout this entire process.
iv
TABLE OF CONTENTS
ACKNOWLEDGEMENTS... iii
LIST OF TABLES... vii
LIST OF FIGURES... xiii
Summary………... 1
Chapter 1 ... 4
Introduction ... 4
Chapter 2 ... 6
Literature Review ... 6
Importance of Nitrogen Use Efficiency (NUE)... 6
Traits Related to NUE Under Adverse Field Conditions... 8
Canopy Spectral Reflectance to Identify NUE Wheat Genotypes... 9
Effects of Warming from Climate Change on Wheat Production... 10
Effect of Warming on Wheat Physiology... 11
Effects of Rising Night-Time Temperatures on Wheat…………... 13
Effect of Warming on Plant NUE... 14
Chapter 3... 16
Using High-throughput Phenotyping through Canopy Spectral Reflectance to Estimate Nitrogen Use Efficiency in the Soft Red Winter Wheat Elite Mapping Panel... 16
Introduction... 16
Materials and Methods ... 18
Site Description and Experimental Design... 18
Field Sampling and Data Collection... 19
Canopy Spectral Reflectance………... 19
Agronomic Traits... 19
Statistical Analysis... 20
Association Mapping in TASSEL... 20
Results and Discussion... 21
Description of Climate Conditions in 2012-2013………. 21
Agronomic Traits and N Traits…………... 21
Utility of Canopy Spectral Reflectance Devices for High-Throughput Phenotyping of NUE...….. 23
Association Mapping of Agronomic and N Traits………... 24
Chapter 4………...… 32
Effects of Warming on Nitrogen Use Efficiency at Different N Rates in Soft Red Winter Wheat………...……. 32
Introduction………...……...…… 32
Material and Methods………...… 34
Site Description and Experimental Design………...… 34
Field Sampling and Data Collection………... 34
Pre-N Soil Sampling………...….. 34
Resin Bag Sampling………... 35
Agronomic Traits………...…... 35
Data Processing and Analysis………...… 36
v
Measuring N Traits………...……… 37
Root Traits………...……. 37
Statistical Analysis………...…. 37
Results and Discussion………... 38
Developmental Differences of Winter Wheat Between Planting Date and N Environment... 38
Effects of N Environment and Planting Date Measured Traits……….... 39
Post-Anthesis N Uptake………... 42
Root Biomass………...…. 43
Plant N Availability from Resin Bag Data………...… 44
Genotypic Performance under Multiple N Environments and Warming. 44 Chapter 5………... 65
Selecting for Nitrogen-Use Efficient Soft Red Winter Wheat Lines Under High and Low Nitrogen Environments………... 65
Introduction………... 65
Material and Methods………...… 67
Site Description and Experimental Design………...… 67
Field Sampling and Data Collection………. 68
Soil Sampling………...…. 68
Agronomic Traits and N Sampling………...… 68
Data Processing and Analysis………...… 69
Soil N Analysis………... 69
Measuring N Traits………...… 70
Statistical Analysis………...……. 71
TASSEL……….…...…… 72
Results and Discussion………...….. 72
Agronomic Traits………...………... 72
N Traits………...….. 74
Post-Anthesis N Uptake………...………...…….. 77
Canopy Spectral Reflectance………...….…… 78
Implications for Breeding………....…. 79
Chapter 6………...….... 98
Breeding for Nitrogen Use Efficiency to Combat Heat Stress Caused by Climate Change………...……... 98
Introduction………...………... 98
Material and Methods………...…….. 100
Site Description and Experimental Design………...……….. 100
Field Sampling and Data Collection………...…… 101
Soil Sampling……….. 101
Agronomic Traits and N Sampling……….………...…. 102
Data Processing and Analysis………... 103
Soil N Analysis...………...……. 103
Measuring N Traits………...….. 104
Statistical Analysis………...…... 104
Association Mapping in TASSEL………... 105
vi
Results and Discussion………...… 106
Effect of Warming on Agronomic and N Traits………...…….. 106
Traits Associated with NUE………...… 107
Data Structure Observed from Principal Components………..…. 108
Genotypic Performance Under Warming and Implications for Breeding……….. 109
APPENDIX……….... 124
REFERENCES………...…… 136
vii
LIST OF TABLES
Table 3.1: LSMEANS for agronomic traits measured for 280 genotypes being tested (tests) and the check, genotype Branson replicated, generated from the ANOVA Lexington, KY elite TCAP mapping panel 2012... 26
Table 3.2: LSMEANS for agronomic traits measured for 280 genotypes being tested (tests) and the check, genotype Branson replicated, generated from the ANOVA Lexington, KY elite TCAP mapping panel 2013... 26
Table 3.3: LSMEANS for agronomic traits measured for 280 genotypes being tested (tests) and the check, genotype Branson replicated, generated from the ANOVA Lexington, KY elite TCAP mapping panel 2012-2013... 27
Table 3.4: LSMEANS for N traits measured for 280 genotypes being tested (tests) and the check, genotype Branson replicated, generated from the ANOVA Lexington, KY elite TCAP mapping panel 2012………... 27
Table 3.5: LSMEANS for N traits measured for 280 genotypes being tested (tests) and the check, genotype Branson replicated, generated from the ANOVA Lexington, KY elite TCAP mapping panel 2013... 28
Table 3.6: LSMEANS for N traits measured for 280 genotypes being tested (tests) and the check, genotype Branson replicated, generated from the ANOVA Lexington, KY elite TCAP mapping panel 2012-2013... 28
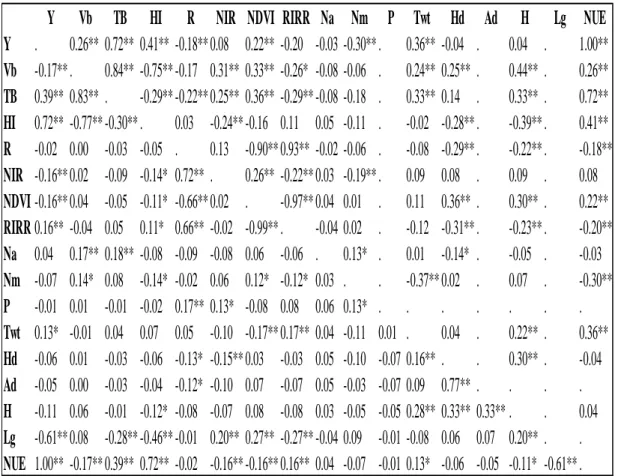
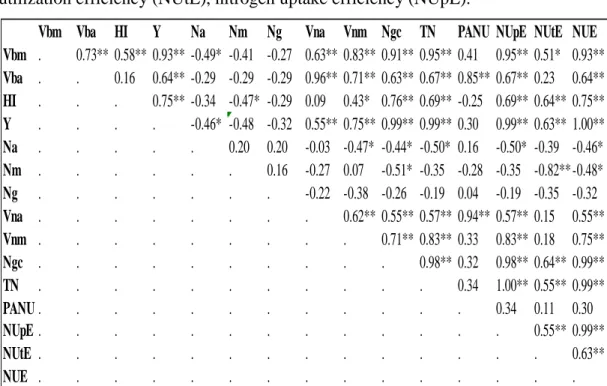
Table 3.7: Pearson correlation coefficients for agronomic and N traits measured from the 56 soft red winter wheat lines grown each year in the elite TCAP mapping panel 2012-2013 Lexington, KY... 29
Table 3.8: Association mapping of measured traits and markers using the Mixed Linear Model in TASSEL of the soft red winter elite mapping panel 2012 Lexington, KY... 30
Table 3.9: Association mapping of measured traits and markers using the Mixed Linear Model in TASSEL of the soft red winter elite mapping panel 2013 Lexington, KY. Bonferroni test correction was used to identify significant markers... 31
Table 4.1: Average leaf appearance based from phyllochron data over accumulated growing degree days (GDD) for soft red winter wheat genotypes Truman (T) and Pembroke (P) planted September (S), October (O), and November (N) grown under three N environments: 0 kg N ha-1 (L), 101 kg N ha-1 (M), 168 kg N ha-1 (H) from the hill plot study Lexington, KY 2013…... 46
viii
Table 4.2: LSMEANS agronomic trait and N trait averages for each N environment (N Env) and planting date (PD) (September (S), October (O), November (N)) from the hill plot study Lexington, KY, 0 (L), 101 (M), and 168 (H) kg N ha-1 treatments. Level of significance from ANOVA is shown for each trait……….….……… 47
Table 4.3: LSMEANS agronomic trait and N trait averages for each N environment (Env) under the September planting date from the hill plot study Lexington, KY, 0 (L), 101 (M), and 168 (H) kg N ha–1 environments. Level of significance from ANOVA is shown for each trait………...…… 48 Table 4.4 LSMEANS agronomic trait and N trait averages for each N environment (Env) under the October planting date from the hill plot study Lexington, KY 0 (L), 101 (M), and 168 (H) kg N ha-1 environments. Level of significance from ANOVA is shown for each trait……….…...… 49 Table 4.5: LSMEANS agronomic trait and N trait averages for each N environment (Env) under the November planting date from the hill plot study Lexington, KY 0 (L), 101 (M), and 168 (H) kg N ha -1 environments. Level of significance from ANOVA is shown for each trait...……..… 50
Table 4.6: Heading date (HD) and anthesis date (AD) LSMEANS for soft red winter lines Pembroke and Truman planted September (S), October (O), and November (N) under 0 kg N ha-1 (L), 101 kg N ha-1 (M), 168 kg N ha-1 (H) from the hill plot study Lexington, KY 2013...….. 50
Table 4.7: Pearson correlation coefficients of measured traits and average maximum temperature (Tmax), average minimum temperature (Tmin), average temperature (Tavg) for the period between anthesis and harvest maturity for winter wheat planted September 27 (S), October 25 (O), and November (N) 29, 2012………..…………...….. 51
Table 4.8: LSMEANS agronomic trait and N trait averages for each planting date (PD) (September (S), October (O), November (N)) from the hill plot study Lexington, KY 0 kg N ha-1 environment. Level of significance from ANOVA is shown for each trait….…. 51
Table 4.9: LSMEANS agronomic trait and N trait averages for each planting date (PD) (September (S), October (O), November (N)) from the hill plot study Lexington, KY 101 kg N ha-1 environment. Level of significance from ANOVA is shown for each trait…. 52
Table 4.10: LSMEANS agronomic trait and N trait averages for each planting date (PD) (September (S), October (O), November (N)) from the hill plot study Lexington, KY 168 kg N ha-1 environment. Level of significance from ANOVA is shown for each trait.… 53
ix
Table 4.11: Pearson correlation coefficients for agronomic and N traits measured from the 8 soft red winter wheat lines grown under 0 kg N ha-1 and 101 kg N ha-1 environments, hill plot study 2013 September planting…………...……… 54
Table 4.12: Pearson correlation coefficients for agronomic and N traits measured from the 8 soft red winter wheat lines planted September and October hill plot study 2013 168
kg N ha-1 environment………...………... 55
Table 4.13: Pearson correlation coefficients for agronomic and N traits measured from the 8 soft red winter wheat lines grown under 0 kg N ha-1 and 101 kg N ha-1 environments. Hill plot study 2013 October planting………...……… 56
Table 4.14: Pearson correlation coefficients for agronomic and N traits measured from the 8 soft red winter wheat lines grown under 0 kg N ha-1 and 101 kg N ha-1 environments. Hill plot study 2013 November planting………...………… 57
Table 4.15: Pearson correlation coefficients for agronomic and N traits measured from the 8 soft red winter wheat lines grown under 168 kg N ha-1 environments. Hill plot study 2013 November planting………...………..……… 58 Table 4.16: LSMEANS root biomass (g m-2) for genotypes Pembroke and Truman for each N environment (E) and planting date (PD)(September (S), October (O), November (N)) from the hill plot study Lexington, KY 0 (L), 101 (M), and 168 (H) kg N ha-1 environments. Level of significance from ANOVA is shown for each trait…...……… 59
Table 4.17: Pearson correlation coefficients between root biomass (Rb), N environment (E), planting date (PD), and measured traits………..……...……… 59 Table 4.18: LSMEANS for resin bag data (ppm) for genotypes Pembroke and Truman for each N environment (E) and planting date (PD) (September (S), October (O), November (N)) from the hill plot study Lexington, KY 0 (L), 101 (M), and 168 (H) kg N ha-1 treatments. Level of significance from ANOVA is shown for each trait.…...……. 60
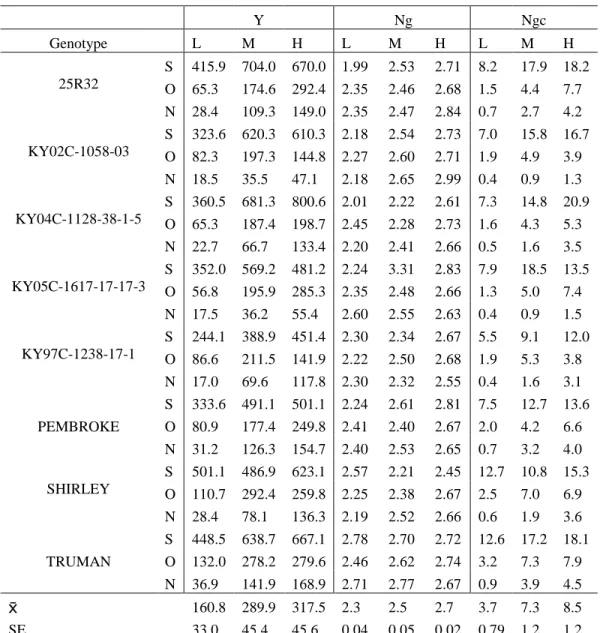
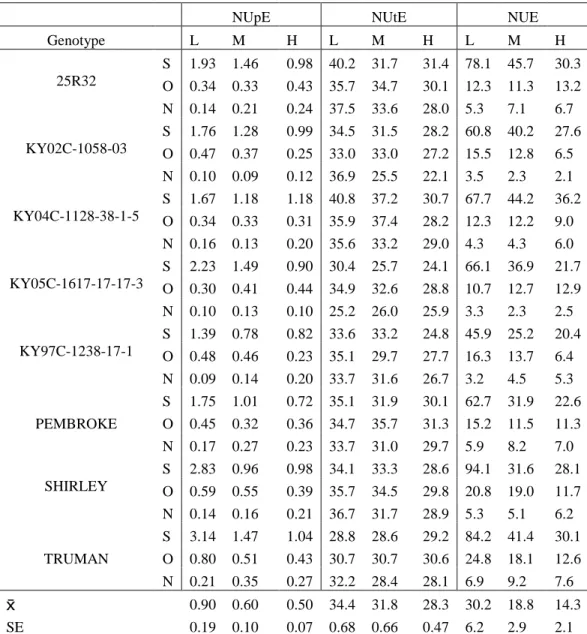
Table 4.19: Yield (Y) (g m-2), % grain N (Ng), and N grain content (Ngc) (g m-2) LSMEANS for 8 soft red winter lines planted September (S), October (O), and November (N) under 0 kg N ha-1 (L), 101 kg N ha-1 (M), 168 kg N ha-1 (H) from the hill plot study Lexington, KY 2013………...….… 61 Table 4.20: N uptake efficiency (NUpE), N utilization efficiency (NUtE) (g yield g-1 plant N), and N use efficiency (NUE). LSMEANS for 8 soft red winter lines planted September (S), October (O), and November (N) under 0 kg N ha-1 (L), 101 kg N ha-1 (M), 168 kg N ha-1 (H) from the hill plot study Lexington, KY 2013…………..….…...…… 62
x
Table 5.1: LSMEANS for agronomic traits in each N environment from the N study Lexington (LEX) and Princeton (PRN), KY 0 (LN) and 112 (HN) kg N ha-1 environment. Level of significance from ANOVA is shown for each trait……….…...…… 81
Table 5.2: LSMEANS for agronomic traits in each N environment from the N study Lexington (LEX) and Princeton (PRN), KY 0 kg N ha-1 environment. Level of significance from ANOVA is shown for each trait……..………...……….……… 82
Table 5.3: LSMEANS for agronomic traits in each environment from the N study Lexington (LEX) and Princeton (PRN), KY 112 kg N ha-1 environment. Level of significance from ANOVA is shown for each trait……….……….… 83
Table 5.4: Yield rankings across locations of the most stable lines grown in the 2014 N study Lexington (LEX) and Princeton (PRN), KY under 0 kg N ha-1 (L) and 112 kg N ha
-1
(H) environment……….………...… 84
Table 5.5: LSMEANS for N traits in each N environment from the N study Lexington (LEX) and Princeton (PRN), KY 0 (L) and 112 (H) kg N ha-1 environment. Level of significance from ANOVA is shown for each trait……….……….…… 85
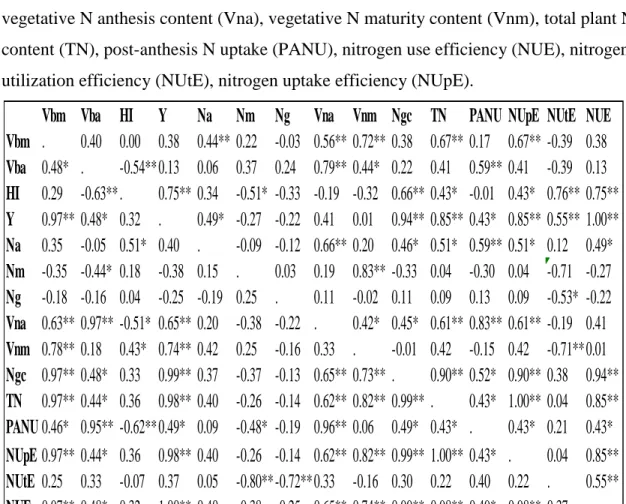
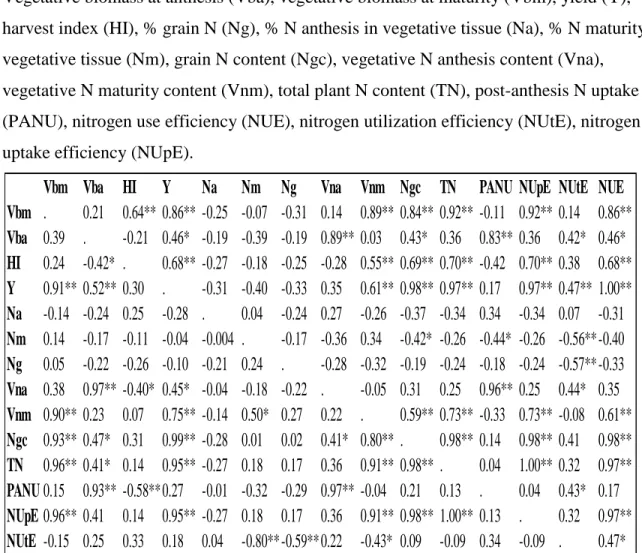
Table 5.6: Pearson correlation coefficients for agronomic and N traits measured from the 56 soft red winter wheat lines grown in each N environment. N study 2014 Lexington, KY location………... 86 Table 5.7: Pearson correlation coefficients for agronomic and N traits measured from the 56 soft red winter wheat lines grown in each N environment. N study 2014 Princeton, KY location………...………... 87 Table 5.8: LSMEANS for N traits in each environment from the N study Lexington (LEX) and Princeton (PRN), KY 0 (LN) kg N ha-1 environment. Level of significance from ANOVA is shown for each trait………..….… 88
Table 5.9: LSMEANS for N traits each N environment from the N study Lexington (LEX) and Princeton (PRN), KY 112 (H) kg N ha-1 environment. Level of significance from ANOVA is shown for each trait………...……… 89 Table 5.10: Yield, % grain moisture, and test weight (Twt) LSMEANS for the 56 soft red winter lines grown at Princeton (PRN) and Lexington (LEX), KY under 0 kg N ha-1
(L) and 112 kg N ha-1 (H)...………..………..… 90
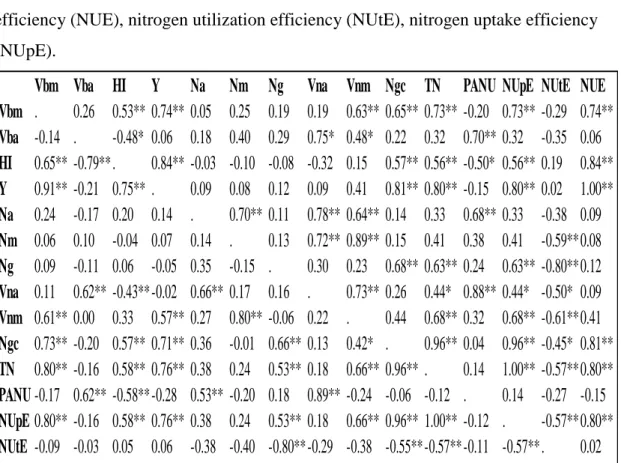
Table 5.11: N in vegetative content at maturity (Nvm), Grain N content (Ngc), Total plant N content (TN), and nitrogen harvest index (NHI) LSMEANS for 56 soft red winter lines grown at Princeton (PRN) and Lexington (LEX), KY under 0 kg N ha-1 (L) and 112 kg N ha-1 (H)... 91
xi
Table 5.12: Association mapping of measured traits and markers using the Mixed Linear Model in TASSEL from the 2014 Lexington, KY 0 kg N ha-1 environment……..……. 92
Table 5.13: Association mapping of measured traits and markers using the Mixed Linear Model in TASSEL from the 2014 Lexington, KY 112 kg N ha-1 environment... 93 Table 5.14: Association mapping of measured traits and markers using the Mixed Linear Model in TASSEL from the 2014 Princeton, KY 0 kg N ha-1 environment…... 94
Table 5.15: Association mapping of measured traits and markers using the Mixed Linear Model in TASSEL from the 2014 Princeton, KY 112 kg N ha-1 environment... 95
Table 5.16: Broad sense heritability (h2) and 90% confidence interval (upper limit (UL), and lower limit (LL)) for N traits across N environments and locations calculated from means squares from ANOVA………...………..……….. 96 Table 5.17: N use efficiency (NUE), N utilization efficiency (NUtE), and N uptake efficiency (NUpE) LSMEANS for 56 soft red winter lines grown at Princeton (PRN) and Lexington (LEX), KY under 0 kg N ha-1 (L) and 112 kg N ha-1 (H)….…..……...…….. 97 Table 6.1: LSMEANS of controlled and warmed environments (E) for agronomic traits in a warming study of 40 soft red winter wheat genotypes from the warming study 2014 Lexington, KY calculated from the ANOVA……….……… 111
Table 6.2: Averages calculated from LSMEANS for controlled and warmed environments (E) differences for nitrogen traits for the 40 soft red winter wheat genotypes calculated from the ANOVA for the warming study 2014 Lexington, KY.. 112
Table 6.3: Average monthly percent soil moisture measured from soil moisture probes placed at a depth of 10 cm, two reps per treatment. Soil moisture was measured daily every hour from March to June from each probe. ANOVA was performed to determine significant differences between monthly averages………..………...… 113
Table 6.4: Association mapping of agronomic traits and markers using the Mixed Linear Model in TASSEL of each N environment (E) from the warming study 2014 Lexington, KY………... 114
Table 6.5: Pearson correlations between N traits and agronomic traits for warming study 2014 Lexington, KY………..………. 115 Table 6.6: Broad sense heritability (h2) and 90% confidence interval (upper limit (UL), and lower limit (LL)) for N traits across N environments and locations calculated from means squares from ANOVA………..……….…...… 116
xii
Table 6.7: Correlation matrix between eigenvectors and N traits calculated from principal component analysis in the control treatment of the warming study 2014 at Lexington, KY………... 117
Table 6.8: Correlation matrix between eigenvectors and N traits calculated from principal component analysis in the warmed treatment of the warming study 2014 at Lexington, KY………....117
Table 6.9: LSMEANS of agronomic traits measured for each of the 40 soft red winter wheat genotypes for the control treatment from the warming study Lexington, KY 2014……….… 118 Table 6.10: LSMEANS of nitrogen traits measured in 40 soft red winter wheat genotypes for the control treatment from the warming study Lexington, KY 2014……… 119
Table 6.11: LSMEANS of agronomic traits measured in 40 soft red winter wheat genotypes for the warmed treatment from the warming study Lexington, KY 2014…. 120
Table 6.12: LSMEANS of nitrogen traits measured for each of the 40 soft red winter wheat genotypes for the warmed treatment from the warming study Lexington, KY 2014………... 121
xiii
LIST OF FIGURES
Figure 4.1: Estimated average plant available N (ppm) from resin bag sampling under the 0 kg ha-1 environment analyzed for each planting date (September (LS), October (LO), and November (LN)) from the hill plot study Lexington, KY 2013…………..… 63
Figure 4.2: Estimated average plant available N (ppm) from resin bag sampling under the 101 kg ha-1 environment analyzed for each planting date (September (MS), October (MO), and November (MN)) from the hill plot study Lexington, KY 2013…….……... 63
Figure 4.3: Estimated average plant available N (ppm) from resin bag sampling under the 168 kg ha-1 environment analyzed for each planting date (September (HS), October (HO), and November (HN)) from the hill plot study Lexington, KY 2013………..…… 64
Figure 6.1: Average monthly soil temperature in warmed and control treatments from temperature probes placed at a depth of 10 cm below the ground…….……….… 122
Figure 6.2: Average monthly air temperature in warmed and control treatments from temperature probes placed at a depth of 10 cm below the ground.……...………..…… 123
1 Summary
Nitrogen-use efficient crop varieties may ensure sustainability in agricultural systems and meet future consumer demands, especially when faced with changing environments caused by climate change. Nitrogen-use efficient varieties may decrease environmental and economic costs associated with excess fertilizer N. Wheat varieties that take up and utilize nitrogen more efficiently may be more adaptable to warmer environments since grain filling can continue under stress conditions when
photosynthesis is compromised. This thesis reports on four studies: Ch. 3: Using High-Throughput Phenotyping through Canopy Spectral Reflectance to Estimate Nitrogen Use Efficiency in the Soft Red Winter Wheat Elite Mapping Panel; Ch. 4 Effects of Warming on Nitrogen Use Efficiency at Different N Rates in Soft Red Winter Wheat; Ch. 5
Selecting for Nitrogen-Use Efficient Soft Red Winter Wheat Lines Under High and Low Nitrogen Environments; Ch. 6 Breeding for Nitrogen Use Efficiency to Combat Heat Stress Caused by Climate Change.
Results from these studies demonstrate genotypic variation in the two components of N use efficiency, N uptake efficiency and N utilization efficiency. Response to N stress or warming varied among the genotypes. In the active warming study (Ch. 6), principal component analysis showed that uptake and utilization efficiency accounted for most of the variation observed within the data. Across the four studies uptake efficiency was found to be more important than utilization efficiency to genotypic performance in terms of yield, N use efficiency, and N grain content under high and low N environments and under warming. Genetic variation for the low N environments from the hill plot study 2013 (Ch. 4) and N plot study 2014 (Ch. 5) was found to be greater than under the high N environments for traits such as yield, N use efficiency, and N grain content. Thus, selection for high yielding, high quality lines may be more accurate under N limiting environments because the true genotypic performance is masked under N sufficient environments. Under low N, genetic variation was higher for uptake efficiency, while variation in utilization efficiency was higher with high N. Therefore, selection in low N environments for the former and under high N environments for the latter should be
2
implemented to identify varieties that have high uptake efficiency and that have high utilization efficiency that results in increased yield and NUE. Post-anthesis N uptake (PANU) had significant positive correlations to yield, grain N content, and uptake efficiency across N environments and locations in chapters 4 and 5 in high N environments.
Nitrogen use efficiency was also found to be affected by increased temperatures (Ch. 4 and 6); both uptake and utilization were lower under increased temperatures. In wthe warmed environment, development was quickened. Accelerated development may have reduced the length of time allowed for N remobilization to the grain, causing more N to be left in the biomass, thus causing a reduction in yield and grain N content.
Increases in yield ranking and stability under warming were largely related to increases in uptake efficiency. However, there were a few genotypes that increased performance due to increases in utilization efficiency or both utilization and uptake efficiency under warming. Results from the warming study (Ch. 6) suggest that uptake efficiency may be more important in producing yield and grain N content under warming in our region. Selecting for uptake efficiency and related traits may be a good strategy to increase overall NUE, yield, and grain N content. Lines with higher uptake efficiency may be able to maintain yield and quality under warmer environments and can be incorporated into breeding programs developing genotypes adapted to future climates.
While non-destructive techniques like canopy spectral reflectance (CSR) offer promising ways to phenotype traits such as N use efficiency (Ch. 3 and 5), in my studies, there were not strong correlations between the CSR indices, NDVI and RIRR, and yield and N traits. Nitrogen use efficiency is a complex trait that is influenced by the
environment and was shown to have low heritability; thus, being able to find markers linked to it would be very beneficial to breeding programs. However, the association analysis performed in TASSEL to find markers related to the N traits was not fruitful. Some markers showed association to N traits, but these associations were not significant according to the Bonferroni test correction. The lack of significant markers was likely due to the small number of genotypes used to perform the analysis. To gain further insight into the mechanisms controlling NUE under adverse environmental conditions and to reveal plant response to N stress and warming, other tools such as
3
ecophysiological models and crop models could be incorporated. Using a larger population to identify QTL for N use efficiency and its components using molecular methods and association mapping could improve development of N use efficiency. Further research is needed integrating genetics and physiology to discover the location of QTL linked to N uptake and N utilization efficiencies to better understand the way in which alleles associated with QTL may influence differences in N use efficiency in winter wheat.
4
Chapter 1
Introduction
Wheat (Triticuum aestivum L.) is an important component of the national and global food supply. Soft red winter wheat is the 4th major crop grown in Kentucky. Earth’s changing climate has the potential to adversely affect this important crop due to increasing temperature. Rising levels of greenhouse gases are causing Earth’s
temperature to increase. CO2 concentrations in Earth’s atmosphere have risen since 1800,
increasing from 280 to 390 mmol CO2 per mol of atmosphere and climate models
indicate these values will only rise in the future (Bloom et al., 2010). Historic data indicate that from the 1970’s to present day each decade has been warmer than the past 100 years (IPCC, 2007). Projections show that temperatures will rise in the future, 1.4-4.8⁰C by 2050 (IPCC, 2001 and 2007). In wheat, temperatures greater than 30⁰C can cause the plant to experience heat stress and cause reductions in grain number or grain filling period, resulting in yield losses. The yield component that is affected depends on the developmental stage at which the increased temperature event occurs. Elevated temperatures before anthesis result in decreased grain number. If the temperature event occurs after anthesis, grain filling duration is shortened (Ferris et al., 1998).
Agricultural crops, including wheat, are inefficient at uptaking and utilizing fertilizer nitrogen. As a result, the nitrogen is lost through processes such as leaching or dentrification which can reduce the health of the surrounding environment. Loss of nitrogen through leaching can reduce water quality and health of freshwater and marine ecosystems through eutrophication (Sieling and Kage, 2008). Nitrogen fertilizer can also be lost to the atmosphere as nitrous oxide, a potent green house gas. In the U.S.,
agriculture is estimated to contribute 8.6% of green house gas emissions, 80% being from nitrous oxide. Worldwide, agriculture represents 13.5% of anthropogenic green house emissions (Karl et al., 2009).
In the U.S., wheat yield gains have slowed since the 1990’s (Muurinen et al., 2007). As human population growth continues, worldwide demand for wheat will continue to increase (Ludwig and Asseng, 2006; Parry and Hawkesford, 2012). Thus,
5
providing food for future populations while assuring sustainability of agricultural systems is becoming an increasing dilemma. To achieve this goal in agricultural production, other obstacles such as climate change must be oversome. Nitrogen-use efficient crop varieties may be a good option to ensure sustainability in agricultural systems and meet future consumer demands, especially when faced with changing environments caused by climate change. Nitrogen-use efficient crop varieties have the potential to decrease environmental and economic costs associated with adding additional nitrogen to the soil. In wheat and in other crops, lines that utilize nitrogen more efficiently may have the ability to withstand the adverse affects from increased temperature caused by climate change since theses plants are able to take up more soil nitrogen and continue grain filling under stress conditions when photosynthesis is compromised. Therefore, a series of studies was conducted to determine: 1) nitrogen use efficiency of soft red winter wheat varieties grown in Kentucky under adverse field conditions (N limiting/temperature stress), 2) how this trait was affected under these conditions, and 3) which traits may be associated with nitrogen-use efficiency.
6
Chapter 2
Literature Review
Importance of Nitrogen Use Efficiency (NUE)
Nitrogen (N) is a critical nutrient for canopy growth, and canopy photosynthesis drives grain yield and grain quality (Hawkesford, 2012). Excess nitrogen has been shown to have adverse environmental impacts, such as eutrophication of freshwater and marine ecosystems that occurs when high quantities of N fertilizer are added to soil and then washed into the stream through runoff (Sieling et al, 2009). However, reduction in fertilizer use could also decrease crop yield and quality if the plant experiences N deficiency (Cassman et al., 2003). Therefore, great interest has been focused on crop varieties with high nitrogen use-efficiency because these plants would be expected to minimize environmental and production costs associated with addition of excess N to agricultural systems. Increasing NUE can also reduce the amount of greenhouse gases emitted by the crop, associated with the production of grain yield (Gaju et al., 2011). Global use of nitrogen fertilizer has steadily increased, along with agricultural emissions to the environment, predominantly as nitrous oxide (Raun et al., 2001; Tilman et al., 2001; Muurinen et al., 2007; Hatfield et al., 2012). However, even though worldwide fertilizer use has increased, NUE and yield have not risen in cereal crops such as wheat (Hatfield and Prueger, 2004; Muurinen et al., 2007). In wheat production, 70% of N fertilizer accounts for increased greenhouse gases as nitrous oxide (Mortimer et al., 2004). Some climate models have shown that NUE crops could decrease nitrous oxide gas release, thus reducing green house gas emissions from addition of N fertilizer. As a result, selecting and developing NUE crops has gained momentum among breeders (IPCC, 2010). However, breeding NUE crops can be complicated especially since NUE can be described in a variety of ways.
Some researchers have measured or calculated traits, such as nitrate uptake, grain protein content, harvest index (HI), or nitrogen harvest index (NHI)to characterize NUE and select for N efficient genotypes (Berry et al., 2010; Cregan and Van Berkum, 1984; Schulte auf’m Erley et al., 2011; Nyikako et al., 2014). Others have described varieties
7
that are N-use efficient as being able to produce higher than average yields in low N environments (Nyikako et al., 2014). Nitrogen use efficient varieties have also been characterized as genotypes that are able to generate higher yields when additional N was provided. Several authors have suggested that nutrient stress response should be
accounted for when estimating NUE (Lobell and Ortiz-Monasterio, 2007).Additionally, NUE has been defined as the amount of biomass produced divided by the amount of soil N supply (Soil N + fertilizer N applied) (Good et al., 2004; Hawkesford, 2012; Nyikako
et al., 2014). The most practical definition of NUE for breeding describes NUE as the grain yield divided by the soil N supply (soil N and fertilizer N) (Moll et al. 1982). This definition incorporates the two components of NUE, N uptake efficiency (NUpE) (ability of the plant to take up soil N) and N utilization efficiency (NUtE) (ability of the plant to generate yield from N accumulated in vegetative tissue) (Moll et al., 1982; Nyikako et al., 2014). Nitrogen uptake efficiency can be calculated by dividing total plant N by the soil N supply and NUtE can be measured by dividing yield by the total plant N. Total plant N is the amount of N in the aboveground material at maturity (grain N content (yield * % N grain) + N content in straw (biomass * % N straw) (Moll et al., 1982).
Genetic gains in NUE are dependent upon the two components of NUE, NUpE and NUtE. For instance, Ortiz-Monstarerio (1997) found that increases in NUE were attributed to NUpE under low N conditions in Mexico. Researchers in Finland observed similar trends under low N environments (Muurinen et al. 2006). However, studies conducted in other parts of Europe found that NUtE had greater influence over NUE in low N environments (Foulkes et al. 1998; Brancourt-Hulmel et al., 2003). In high N environments, in areas such as UK, Mexico, and Finland, researchers found that both NUtE and NUpE had an equal affect on NUE increases in wheat (Ortiz-Monstarerio et al.
1997, Foulkes et al. 1998, Muurinen et al. 2006). Other studies have shown that NUpE caused greater genetic variation of NUE under low N than high N conditions (LeGouis et al., 2000). However, a study done in California using 12 spring wheat lines observed that NUpE was the strongest factor in determining NUE at both low and high N supply (Dhugga and Waines, 1989). An experiment using 5 different N rates found that wheat genotypic differences in NUE were associated with NUpE at the highest N rates and NUtE explained more of the differences in grain yield than NUpE across all 5 N rates
8
(Barraclough et al., 2010). Overall, the main effects observed from these studies were the interaction of N supply and genotype on yield and NUE. Also, under low N
environments yield and NUE could be influenced by NUpE or NUtE depending on the site, unlike high N environments where yield and NUE were almost always more closely related to NUtE (Gaju et al., 2011). These studies used 12-24 genotypes; therefore, using a wider range of wheat genotypes may be more useful for selection of high yield and quality wheat lines under different N environments at multiple locations.
Traits Related to NUE Under Adverse Field Conditions
Around the world, most wheat varieties are tested under high N environments. This means plant breeders select varieties that perform well under these conditions. However, genotypes selected for high yield in these environments may not produce high yields under low N environments, since studies have shown an interaction between genotype and N supply (Ortiz-Monstarerio et al. 1997, Foulkes et al. 1998, Muurinen et al. 2006). Therefore, breeding and selection in low N environments may be needed to appropriately identify varieties with superior yield and NUE (Brancourt-Hulmel et al., 2005). A knowledge of which traits are important for NUE under these N conditions and warming is necessary to identify efficient cultivars. For instance, some studies have shown a relation between final grain N and NUpE. Root morphology, nitrate reductase activity, root hair development, and presence of arbuscular mycorrhizae likely affect NUpE (Baresel et al., 2008). Therefore, root growth may influence overall NUE. Development of new roots is necessary for the plant to make use of resources in
unexplored soil and the path of root formation may vary among genotypes, and thus root traits are likely important in determining crop NUpE and overall NUE (Baresel et al., 2008).
During development, N source-sink-relationships change, the critical point being anthesis. After anthesis, N taken up by the roots and stored in the vegetative tissue is remobilized to the grain, making the grain the primary sink (Simpson et al. 1983; Baresel
et al., 2008). Therefore, N partitioning can be defined as uptake before anthesis, post-anthesis N uptake, and remobilization processes (Wetselaar and Farquhar 1980). Genetic variability among root traits and source-sink-relationships has been documented
9
(Barbottin et al. 2005; Kichey et al. 2007; Baresel et al., 2008). These traits may be used to improve adaptation to adverse environmental conditions, such as warming or N
limiting environments.
Wheat N partitioning during vegetative growth, anthesis, grain filling, and maturity can be valuable. Measuring total N uptake during vegetative growth can be indicative of early plant development, tillering, and root formation(Sylvester-Bradley et al., 2009; Swain et al., 2014).At anthesis, measuring total N uptake can give insight into growth of yield generating leaves, floret fertility, and amount of stem reserves. Nitrogen accumulation at this developmental stage is reliant on the extent of the rooting system and N availability. At the end of anthesis, biomass partitioning can indicate preferred strategies in N storage and translocation (Cox et al. 1986;Swain et al., 2014).Measuring total N uptake at maturity provides information on the translocation efficiency of N from the biomass to the grain. Wheat genotypes that have superior N uptake, N storage, and N translocation capabilities will allow for further gains in NUE. Other research has
suggested that high NUE genotypes are those that possess the “stay green” trait which hinders senescence and allows for a longer grain filling period through the continuation of N uptake and translocation (Bogard et al. 2011; Swain et al., 2014).
Canopy Spectral Reflectance to Identify Nitrogen Use Efficient Wheat Genotypes More rapid and efficient selection for high yielding and stress tolerant plants may be possible through high throughput phenotyping. There have been great advances in genotyping technologies over the years (Winterhaltera et al., 2010). However,
deficiencies in phenotyping abilities reduce the capacity to accurately assess the genetics governing quantitative traits (Winterhaltera et al., 2010; Montes et al., 2011). Using high throughput phenotyping techniques can possibly connect the genotype and phenotype. Canopy spectral reflectance (CSR) devices can be utilized to implement high throughput phenotyping for complex traits, such as nitrogen concentration, associated with NUE (Li
et al., 2014). Canopy spectral reflectance devices measure the amount of light
reflected/absorbed by the plant’s canopy surface. Genotypic variation and environmental stress can affect the amount of light reflected. Thus, the use of CSR in selection for NUE may be a rapid and inexpensive option (Raun et al., 2001).
10
Nitrogen use efficiency can be estimated through traditional soil sampling and plant tissue testing. However, traditional monitoring and evaluation of crop nitrogen can be very destructive to plant samples, involve a rigorous work load, and compromise the accuracy of data results. Therefore, CSR techniques can be used as an alternative for nondestructive and real-time monitoring of crop N status. Studies have shown that a variety of CSR indices, such as the normalized difference vegetative index (NDVI) or red infrared ratio (RIRR), have high correlations with wheat grain yield, biomass and N concentration (Ma et al., 1996; Raun et al., 2001; Crain et al., 2012). These indices are already being utilized to manage N in the field. For instance, in China, researchers are using CSR indices to estimate N uptake of winter wheat to better manage N fertilizer application (Li et al., 2012). The CSR estimates of biomass and N content can be used to estimate NUpE and NUtE. The relationship of CSR with biomass is of great interest, since biomass is an essential element related to NUE and yield (Crain et al., 2012). Measuring N content through CSR techniques could also give insight into the plant’s physiology and may indicate other traits to investigate that may benefit NUE, such as root structure and N partitioning. For instance, it is reasonable to infer that wheat with good NUE may have a more vast root structure that allows the plants to extract more N from the soil to be utilized in the plant (Li et al., 2012; Li et al., 2014).
Effects of Warming from Climate Change on Wheat Production
Winter wheat is an important crop at both the regional and global scale.
Increasing temperatures from climate change may have an adverse affect on winter wheat production. Climate change is caused by increases in CO2 concentration which can cause
increase in plant production by increasing photosynthesis and water use efficiency. However, increased CO2 levels can negatively affect plant production. Elevated CO2
levels result in decreased grain quality by reducing plant nutrient concentrations (Rogers
et al., 1996; Kimball et al., 2001; Ludwig and Asseng, 2006). Further release of CO2
and other greenhouse gases into earth’s atmosphere can increase temperatures, causing climates to change in the future [Intergovernmental Panel on Climate Change (IPCC), 2007]. Elevated temperatures can cause plants to experience heat stress, decreasing plant productivity (Van Herwaarden et al., 1998; Ludwig and Asseng, 2006). However, the
11
onset of heat stress is dependent on how quickly and to what degree temperature increases occur, along with the length of time the plant is exposed to elevated temperatures (Farooq et al., 2011).
Future climate models project that the earth’s temperature will increase between 1.4 and 5.8⁰C by 2050 [Intergovernmental Panel on Climate Change (IPCC), 2001 and 2007](Keating et al., 2010). Future environments will also be subjected to increased temperature variability and greater number of hot days (Farooq et al., 2011). A study using a crop model linked to field data showed that for every 1⁰C increase in global mean temperature wheat production would decrease 6 %, resulting in a 42 Mt loss of wheat with each degree temperature increase (Nelson et al., 2009; Nelson et al., 2014; Van Ittersum et al., 2003; Asseng et al., 2014). Overall, grain yields are predicted to decline in most regions worldwide and temperature impacts may be greater and begin sooner than thought before (Asseng et al., 2014; Challinor et al., 2014). In order to create new genotypes adapted to future climates, greater understanding of how crops act in response to elevated temperatures and how heat stress tolerance can be enhanced is a necessity (Farooq et al., 2011).
Effect of Warming on Wheat Physiology
The physiological effects that occur to the wheat plant under heat stress conditions has been well documented. Plants can respond to temperature changes through differences in metabolic activity, membrane moisture content, configuration of proteins, and cytoskeleton assembly (Ruelland and Zachowski, 2010;Farooq et al., 2011). These internal responses to temperature changes can trigger adaptive processes such as production of heat shock proteins. However, heat stress or temperatures exceeding optimum growth can result in injury or permanent damage (Wahid et al., 2007).
In winter wheat, temperatures greater than 14⁰C have been shown to cause photosynthesis rates to decrease. Prasad et al. (2008) found that wheat grain yield decreased as temperatures rose from 14⁰C to 23⁰C. During anthesis, heat stress can increase flower abortion (Wardlaw and Wrigley, 1994). During the reproductive stage, heat stress can lead to pollen sterility, moisture reduction in plant tissues, decreased CO2
12
assimilation and increased photorespiration. High temperatures can accelerate growth (Fischer, 1980; Kase and Catsky, 1984) but in doing so reduce the phenological time from one growth stage to another (Wardlaw and Moncur, 1995;Zahedi and Jenner, 2003; Farooq et al., 2011). Consequently, higher temperatures between anthesis and grain maturity cause grain yield to decrease because there is less time to attain resources. Both components of yield, grain number and grain weight, are susceptible to increased
temperature (Ferris et al., 1998). The developmental stage at which elevated temperatures occur will determine which component of grain yield will be affected. For example, during anthesis, temperatures above 20⁰C may considerably decrease grain number per spike (Saini and Aspinall, 1982). Heat stress accelerates development of the spike, reducing spikelet number, resulting in fewer grains per spike (Saini and Aspinall, 1982; Porter and Gawith, 1999; Farooq et al., 2011). The most sensitive stage during
reproductive growth is between the double ridge (appearance of double ridges on apex of shoot) and flag leaf stage. During this stage, florets are produced in the spikelets that form in the spike. Elevated temperatures shorten this period of time, causing spikelet number per spike and grain number per spikelet to decline (McMaster, 1997). Grain number can also be reduced during floral initiation. For instance, Fischer found that grain number per spike decreased by 4% for every 1⁰C increase in the 30 days preceding anthesis (1985). Because insufficient assimilates can cause the floret number to decline, assimilate availability can influence floret development and thus, grain number (Abbate
et al., 1995;Demotes-Mainard and Jeuffroy, 2004).
Grain filling occurs between anthesis and maturity. Thus, higher temperatures shorten the length of this period, causing grain size to decrease along with yield (Warrington et al., 1977; Shpiler and Blum, 1986). During grain filling, grain size can decline by about 1.5 mg/day for every 1⁰C greater than 15–20⁰C (Streck, 2005). Heat stress tolerance in terms of effects on wheat grain number and size varies among genotypes (Farooq et al., 2011). For example, one experiment studying the influence of grain characteristics in spring wheat genotypes found that 14 varieties exhibited smaller grain size despite duration and timing of the elevated temperature event (Castro et al.,
2007). Higher temperatures can also cause changes in the aleurone layer and endosperm cells, resulting in grain size reduction. When heat stress is not present, the aleurone layer
13
of a wheat grain has large cells bordering the starchy endosperm.When experiencing heat stress, the endosperm cellular structure changes and becomes denser because starch granules accumulate and become embedded in the protein matrix (Pyler, 1988).
Effects of Rising Night-Time Temperatures on Wheat
Overall, rising temperatures reduce spikelet fertility, grains per spike, grain size, and quality. Reductions in yield and quality will cost growers. Most wheat growing regions of the world have been subjected to increases in both daytime and nighttime temperatures. Night time temperatures have been shown to be increasing three times more than daytime temperatures (Karl et al., 1993; Easterling et al., 1997). The extreme differential changes in temperature increments during day and night could play a pivotal role in wheat production (Lobell and Ortiz-Monasterio, 2007; Prasad et al., 2008; Zhang
et al., 2013). However, most research on crop development and grain yield response to climate change has been founded on mean daytime air temperature. Therefore,
understanding effects of elevated night-time temperature on winter wheat development and yield is essential for generating techniques to manage potential impacts of warming on agricultural systems worldwide (Zhang et al., 2013). Many studies have found that yield and biomass production of cereal crops, such as rice and wheat, were affected by increased night-time temperatures associated with climate change. These studies found yield decreases in rice and wheat as night-time temperature increased (Cheng et al., 2009; Mohammed and Tarpley, 2009, Lobell and Ortiz-Monasterio, 2007). For instance, winter wheat yields exhibited a 27% yield decrease when night-time temperature was increased by 2.58⁰C because high night-time temperature decreased tiller fertility, reducing the number of spikelets and grains per spike (Fang et al. 2010). Alternatively, some
experiments have revealed that increased night-time temperatures had no affect on winter wheat yields (Fang et al., 2012). In other instances, nocturnal warming was shown to have a positive effect on winter wheat yields. For example, one study observed a significant increase in winter wheat yields because night-time warming reduced tiller infertility. The differing results of wheat performance under elevated temperatures conveys the need for controlled daytime and nighttime warming experiments to assess the
14
warming response of winter wheat genotypes in different wheat growing regions to develop breeding strategies for future climates appropriate to each production area.
Effect of Warming on Plant NUE
Breeding for nitrogen-use efficiency is thought to be a possible strategy to develop wheat lines adapted to warmer environments. This is because these genotypes are able to take up more N and store it in their stem reserves. When the photosynthetic capacity of the plant is compromised due to elevated temperatures, the plant can utilize post-anthesis N stored stem reserves to continue grain filling and produce yield (Farooq
et al., 2011). Adaptation to heat stress has been shown to be related to the plants ability to accumulate stem reserves prior to anthesis (Blum et al., 1994; Farooq et al., 2011). There is evidence of genotypic variation for assimilate contribution to grain filling under heat stress (Yang et al., 2002; Farooq et al, 2011). Variation in NUE in wheat has been documented and is likely to vary under elevated temperatures as well.
However, little has been explained in the literature on the effect warming has on NUE and plant N and how these traits are related to plant performance under warming (Ortiz-Monstarerio et al., 1997; Foulkes et al. 1998; Brancourt-Hulmel et al., 2003; Muurinen et al., 2007; Barraclough et al., 2010; Gaju et al, 2011). Warming does possibly enhance nitrogen (N) mineralization in the soil, increasing soil mineral N and resulting in increased N losses through leaching if N release is not synchronized with plant growth (Patil et al, 2012). These changes in soil N could cause changes in N uptake by plant roots, causing N uptake to decrease due to early maturation under warming (Sardans et al. 2008; Patil et al. 2010; Patil et al., 2012). However, varieties with vast root systems may be more adapted to warmed environments. For example, studies on grass species have shown that root morphology impacts NUE by affecting NUpE
(Louahlia et al., 2000; Maire et al., 2009; Miller et al., 2007). Also, N utilization in above ground vegetative material and subsequent grain filling period would likely be affected by changed physiological processes resulting from rising temperature (Wolfe-Bellin et al.
2006; Prieto et al. 2009). Consequently, these physiological changes would have a profound impact on plant production (Li et al. 2011).
15
Several studies have examined the effects of increased temperature on N uptake and allocation in some crop species (Jonassona et al. 2004; An et al. 2005; Yang et al.
2011). For example, a night-time warming field experiment using reflective curtains showed that N accumulation in winter wheat during anthesis was 17-43% higher in the warmed than the unwarmed treatment. However, N utilization efficiency was decreased in the warmed treatment causing reduced N allocation towards yield during grain filling, resulting in a 6-25% yield decrease (Zhang et al. 2013). Total plant N content at anthesis and maturity, along with grain N content has been shown to decrease under dryer
conditions due to a lower NUpE and subsequent NUtE, especially at higher N levels (Giuliani et al., 2011). Therefore, researchers and breeders must continue to develop a better understanding of the fundamental mechanisms and traits associated with nitrogen uptake and utilization efficiency under warmed environments.
16 Chapter 3
Using High-throughput Phenotyping through Canopy Spectral Reflectance to Estimate Nitrogen Use Efficiency in the Soft Red Winter Wheat Elite Mapping Panel
Introduction
Nitrogen (N) is a critical nutrient for canopy growth, and canopy photosynthesis drives grain yield and grain quality (Hawkesford, 2012). However, crops do not utilize fertilizer N very efficiently. On average fertilizer N efficiency is less than 50% because the fertilizer N can be lost through leaching, dentrification, or volitization (Ladha et al., 2005). Loss of N can have both economic and environmental costs to growers. For example, global fertilizer NUE for cereal production is around 33%, thus the N that was lost costs $15.9 billion (USD) (Raun et al., 2001).Excess N has been shown to have adverse environmental impacts, such as eutrophication of freshwater and marine ecosystems that occurs when high quantities of N fertilizer are added to soil and then washed into the stream through runoff (Sieling et al, 2009). Therefore, great interest has been focused on crop varieties with high nitrogen use-efficiency (NUE) because these plants would be expected to minimize environmental and production costs associated with addition of excess N to agricultural systems. Increasing NUE can also reduce greenhouse gases emitted by the crop, associated with the production of grain yield (Gaju
et al., 2011). In wheat production, 70% of N fertilizer accounts for increased greenhouse gases mostly in the form of nitrous oxide (Mortimer et al., 2004). Nitrous oxide is a powerful greenhouse gas that is released into the atmosphere after N fertilizer application (Bouwman et al., 2002).According to the Intergovernmental Panel on Climate Change report, developing crops with better NUE can shrink N2O emissions and ultimately
decrease green house gas emissions from N fertilizer products (IPCC, 2001). As a result, selecting and developing N use efficient crops has gained momentum among breeders.
Nitrogen use efficiency is defined as grain yield divided by the soil N supply (soil and fertilizer N) (Moll et al. 1982). In wheat, evidence has shown that yield gains have slowed since the 1990s (Muurinen et al., 2007). Triticuum aestivum (winter wheat) is an important component of the national and global food supply. As human population
17
growth continues, worldwide demand for wheat will continue to increase (Ludwig and Asseng, 2006; Parry, 2012). Providing food for future populations while assuring sustainability of agricultural systems is a growing dilemma. To achieve this goal in agricultural production, breeders must overcome other obstacles such as climate change. Nitrogen-use efficient crop varieties may be a good option to ensure sustainability in agricultural systems and meet future consumer demands, especially when faced with a changing climate. However, NUE is a complex trait and requires labor intensive
sampling to identify NUE superior lines (Ma et al., 1996; Raun et al., 2001; Crain et al., 2012).
More rapid and efficient selection for high yielding and nitrogen use efficient plants may be possible through high throughput phenotyping. There have been great advances in genotyping technologies over the years (Winterhaltera et al., 2010). However, deficiencies in phenotyping abilities reduce the capacity to accurately assess the genetics governing quantitative traits (Winterhaltera et al., 2010; Montes et al., 2011). Using high throughput phenotyping techniques can connect the genotype and phenotype. Canopy spectral reflectance (CSR) devices can be utilized to implement high throughput phenotyping for complex traits, such as nitrogen concentration, associated with NUE (Li et al, 2014). Canopy spectral refelctance devices measure the amount of light
reflected/absorbed by the plant’s canopy surface. Genotypic variation and environmental stress can affect the amount of light reflected. Thus, the use of CSR in selection for NUE may be a rapid and inexpensive option (Raun et al., 2001).
Nitrogen use efficiency can be estimated through traditional soil sampling and plant tissue testing. However, traditional monitoring and evaluation of crop nitrogen is very destructive to plant samples, involve a rigorous work load, and compromise the accuracy of data results. Therefore, CSR techniques could be used for nondestructive and real-time monitoring of crop N status. Canopy sprectral reflectance indices, such as the normalized difference vegetative index (NDVI) or red infrared ratio (RIRR), have been shown to have high correlations with wheat grain yield, biomass and N
concentration (Ma et al., 1996; Raun et al., 2001; Crain et al., 2012). These indices are already being utilized to manage N in the field. For instance, in China, researchers are using CSR indices to estimate N uptake of winter wheat to better manage N fertilizer
18
application (Li et al., 2012). The CSR estimates of biomass and N content can be used to estimate uptake and utilization efficiency. The relationship of CSR with biomass is of great interest, since biomass is an essential element related to NUE and yield (Crain et al., 2012). Measuring N content through CSR techniques could also give insight into the plant’s physiology and may indicate other traits to investigate that may benefit NUE, such as root physiology activity and N partitioning. For instance, it is reasonable to infer that plants with good NUE may have superior root structure that allows these plants to extract more N from the soil to be utilized in the plant (Li et al., 2012; Li et al., 2014). Therefore, 280 soft red winter wheat lines were grown in an augmented randomized complete block design in Lexington, KY to determine the utility of the CSR indices to identify N efficient winter wheat cultivars compared to traditional N sampling and identify traits associated with NUE through association mapping.
Materials and Methods
Site Description and Experimental Design
The 320 entry NAM soft winter wheat panel was grown for two years (2012 and 2013) in five 8x8 blocks as an unreplicated randomized augmented block design at University of Kentucky Spindletop Research Farm in Lexington, KY (38⁰7’37.81’’N, 84⁰29 44.85’’ W). Two-hundred and eighty soft red winter wheat genotypes were tested; the cultivar Branson was used as a check, eight replicates per block. Planting dates were 10 October 2011 and 18 October 2012. The experimental unit each year was a single 6-row yield plot 3.3 m in length, 1.2 m wide. The site was characterized by Maury silt loam [fine, mixed, semiactive, mesic Typic Paleudalfs] soil. 101 kg N ha-1 was applied in a 34 kg N ha-1 and 67 kg N ha-1 split on 22 February and 9 March 2012. 101 kg N ha-1 was applied in a 34 kg N ha-1 and 67 kg N ha-1 split, 14 March 2014 and 4 April 2013
respectively. A weather station was placed at the site to measure temperature data throughout the duration of the study.
19 Field Sampling and Data Collection
Canopy Spectral Reflectance
At Feekes 10 (booting stage), N status of the plant was measured using the JAZ instrument, a canopy spectral reflectance device (CSR). Canopy sprectral reflectance measurements taken at Feekes 10 have been shown to be highly correlated with CSR N indices (Pinter et al., 1981; Raun et al., 2001). JAZ values for each plot were generated by using the continuous scanning method, in which the instrument is scanned along the center of the plot by holding the fibers level and moving the fibers over the plot center in a slow circular motion. This allows the entire plot to be integrated into one reading, as well as reducing noise seen at higher wavelengths. The scanning method gives repeatable results and has been shown to have a very strong r-square value of 0.99 between the different scans of the plots. The indices normalized differential vegetative index (NDVI) (780nm- 680nm/(780nm+680nm) and red infrared ratio (RIRR) (680nm/780nm) were calculated for each of the entries in each block from the JAZ data. Wavelength 780 nm represents spectral reflectance measurement from the near infrared spectrum.
Wavelength 680 nm represents spectral reflectance measurement from the visible spectrum (red).
Agronomic Traits
For each plot, heading date was recorded when 50% of the spikes in a plot had emerged from the leaf sheath. Anthesis date was recorded in 2013 only when 50% of the spikes were flowering. Plot length and height of each plot were recorded at the soft dough stage. Percent of plants lodging in a plot were also recorded at the soft dough stage, but only for the 2013 field season; there was no lodging in 2012. The soft dough stage is equivalent to physiological maturity, which is when maximum dry matter accumulation has occurred and the kernel turns a buff color. At anthesis and harvest maturity (when the kernel was hard and could not be split by thumbnail), 10 non-damaged flag leaves were collected randomly down the length of each plot and air dried in the greenhouse. Leaves were ground to a fine powder using a UDY cyclone mill and ground samples were dried in an oven at 55⁰C overnight. Twenty to 25 mg of ground sample was
20
weighed out for combustion analysis using a Flash EA1112 elemental analyzer to measure N concentration.
Field plots were combine harvested and grain was measured for yield. Grain test weight and moisture content were estimated using the GAC instrument. After harvest, cut straw was raked on the appropriate plot and biomass was measured in the field using a Hege forage harvester for both years. A 50g subsample of grain was collected from each plot to measure whole grain protein content by Near Infrared Reflectance (NIR) in 2013 only.
Statistical Analysis
Analysis of variance (ANOVA) was performed using the General Linear Models procedure (Proc GLM; SAS 2002) to determine effects of both years at Lexington, KY. The model used for the augmented randomized complete block design was:
Yij = μ + Bj + Ti + Eij
Where: Yij = the observation in the ith genotype in the jth block, μ = the overall mean, Ti
= Ci + Xi (Ci) = the ith genotype effect (the effect of the ith check and effect of the ith
genotype nested within the ith check), Eij = the residual error (Scott and Milliken, 1993). LSMEANS were computed to measure treatment differences among genotypes and years.
PROC CORR (SAS 2002) was used to analyze the relationship among traits on an entry mean basis.
Association Mapping in TASSEL
All entries in the mapping panel were genotyped with the 9K Illumina SNP chip to identify single nucleotide polymorphisms (SNP) associated with the traits measured during the course of the study. TASSEL (http://www.maizegenetics.net) software was used to carry out association mapping. The Q+K method was implemented as a mixed linear model to determine association of the N traits and agronomic traits measured with QTL markers. The statistical model used was described as:
21
where y is the vector of observations; b is an unknown vector containing fixed effects including genetic marker and population structure (Q); u is an unknown vector of random additive genetic effects from multiple background QTL for individuals or lines; X and Z are the known design matrices; and e is the unobserved vector of random residuals (Bradbury et al. 2007).
Results and Discussion
Description of Climate Conditions in 2012-2013
In 2012, there were unusually warm temperatures in March through May, which accelerated growth and reproductive development in the wheat crop. Average
temperature during this time period was 16.1⁰C, average minimum was 10⁰C, and average maximum was 21.7⁰C, which was on average 6 degrees above the 30-year normal. The 2012 wheat crop in Kentucky headed about three to four weeks earlier than normal and was harvested approximately three weeks earlier than normal. Low
temperatures in April caused freeze damage throughout the state of Kentucky in 2012. Total precipitation between March and May was 20.4 cm which fell considerably below the 30-year normal by 12 cm (http://wwwagwx.ca.uky.edu/). In 2013, temperatures between March and May were much lower than in 2012. Average temperature in 2013 was 12.2⁰C, average minimum temperature was 7.2⁰C, and average maximum
temperature was 17.2⁰C. Total precipitation between March and May was 40.3 cm, which was 8 cm above the 30-year normal (http://wwwagwx.ca.uky.edu/). In 2013, there was residual N left over from the previous corn crop which on average caused 47% lodging among test plots, resulting in yield losses.
Agronomic Traits and N Traits
From the ANOVA, the variable C tests the hypothesis that the check means and experimental means are equal. The X(C) variable tests the hypothesis that all the means of the experiment are equal (Scott and Milliken, 1993). In 2012, all traits other than percent soil moisture were significantly different between checks and genotypes being tested and among genotypes being tested (p<0.01). In 2012, the test genotypes had