Major Winter Storms in the Midwest
during Winter 2006-2007
Stanley A. Changnon and Kenneth E. Kunkel
Illinois State Water Survey • Data/Case Study 2007-04
MAJOR WINTER STORMS IN THE MIDWEST
DURING WINTER 2006-2007
Stanley A. Changnon and Kenneth E. Kunkel
Illinois State Water Survey
Illinois Department of Natural Resources and University of Illinois at Urbana-Champaign
2204 Griffith Drive
Champaign, Illinois 61820-7495 October 2007
iii
CONTENTS
Page
Chapter One: Introduction . . . 1
Chapter Two: The Storm of November 30-December 1, 2006 . . . 4
Chapter Three: The Storm of February 12-15, 2007 . . . 15
Chapter Four: The Storm of February 22-26, 2007 . . . 23
Chapter Five: Summary . . . 30
iv
ACkNOWlEDGMENTS
Several persons in the private sector and business associations provided information on losses and costs, and we deeply appreciate their contributions. Gary Kerney, Property Claims Institute, provided valuable data on insured losses, and we thank him and others for their infor-mation. We appreciate the photographs by Troy Semple and Steve Smedley provided by the
Pantagraph newspaper in Bloomington, Illinois. Sam Shea, Midwestern Regional Climate Center,
provided much of the snow and ice data. Sara Nunnery prepared several excellent illustrations and Eva Kingston provided an excellent review. We also thank Jim Angel and Steve Hilberg for their helpful scientific reviews.
CHApTER ONE: INTRODUCTION
Winter 2006-2007 brought many major winter storms across the United States. An early season, damaging winter storm struck Buffalo, New York, in October (Freedman, 2007). The first large storm in the Midwest occurred on November 30-December 1, marking the start of climato-logical winter, and caused more than $0.9 billion in losses and costs.
In the ensuing 3½ months, 12 more major storms occurred and, amazingly, most parts of the nation experienced at least one storm. Colorado had two storms in late December; the Deep South had a major ice storm and Arizona had a record snowstorm in January. Parts of the Midwest, High Plains, and Northeast had record high snowfalls from two February storms.
Six of the 14 storms of 2006-2007 occurred in the Midwest, including three very large and very damaging storms (Figure 1-1). February storms produced 21 inches of snow in Chicago, the highest monthly total since 1929. Many of the nation’s winter storm damages in 2006-2007 were concentrated in the Midwest.
The goal of this study was to provide detailed descriptions of the three extremely damaging Midwestern storms and to examine their impacts. Updated impact information allows wise plan-ning for future storms. This study also sought to identify physical and societal conditions leading to these major snowstorms and their extreme storm damages.
The nation’s 29th largest snowstorm on record (areal extent of snow) came on February 12-15. Named the Valentine Day’s Blizzard (AP, 2007), this storm brought heavy snowfalls, thick icing, and extremely high winds from Missouri east to Maine. Power outages and damages to tele-phone systems amounted to losses and repair costs of $175 million, and total property damages of $0.55 billion. The 19th largest storm in the nation since records began in 1950 occurred later in the month on February 22-26.
2
The season’s last storm in the Midwest on April 10-14 was the nation’s 14th winter storm. The nation’s 2006-2007 winter storms are listed below.
• October 12-14–New York state • November 30-December 1–Midwest • December 16-22–Pacific Northwest
• December 21-22–Colorado and High Plains
• December 29-30–Colorado and High Plains
• January 13-15–Arizona and southwest
• January 12-17–Texas, High Plains, and East Coast
• Late January–New York lake-effect storms
• February 3-5–Midwest and East Coast
• February 12-15–Midwest to New England
• February 22-26–High Plains, Midwest, and Northeast
• March 1-2–Midwest and High Plains
• March 16-17–Northeast
• April 10-14–Upper Midwest and Northeast
The three extremely damaging storms in the Midwest occurred on November 30-December 1, February 12-15, and February 22-26. Ensuing discussions cover dimensions of each storm, atmo-spheric conditions causing each storm, and storm impacts. The report summary compares and evaluates impacts of the three storms and assesses climatological factors that helped create these storms.
Comprehensive assessments of impacts resulting from weather conditions are complex and difficult to perform. Severe winter storms produce a wide variety of damages to the environment, human health and well being, and the economy. It is important to recognize that some impacts can be losses for some sectors and benefits for others. For example, badly damaged property is a loss to owners, but rebuilding provides economic benefits for the construction industry. Cold periods increase heating costs for consumers but increase income for utilities.
How were data and information used to define storm impacts gathered? Direct measure
-ments of losses and/or gains were obtained from some institutions. Some impact measures came from use of defined relationships between climate conditions and physical conditions of plants, animals, trees, and soils. Use of established relationships between physical conditions and societal, economic, and health conditions also provided some impact information.
Sources of data/information for these complex assessments involved a wide variety of experts in government agencies, industry, and business communities identified by the authors over the past 40 years. The authors also calculated or estimated some impacts using existing relationships.
As a result of decades of consulting with private firms and services-oriented work for Illinois, the authors developed numerous contacts for impact data/information. A level of trust about information being provided from the private sector carefully was developed, but most sources do
3
not want their names or companies identified. Development of this information network has been a unique, long-term endeavor.
Several sources were used to define and quantify impacts listed herein. These include
representatives from financial institutions, stock market experts, weather advisory firms, utili
-ties, agribusinesses, railroads, airlines, universi-ties, retail associations, insurance industry (crop and property), and government agencies (local, state, and federal). Weather and climate data used came from the Midwestern Regional Climate Center based on measurements made by the National Weather Service.
CHApTER TWO: THE STORM Of NOvEMbER 30-DECEMbER 1, 2006
A very powerful early winter storm produced significant snowfall and ice across much of the Midwest on November 30-December 1. More than 6 inches of snow fell along a 1,000-mile path from central Oklahoma to northern Michigan, with accumulations of sleet and freezing rain in excess of 2 inches in large portions of Illinois and Missouri.
This monstrous storm ushered in winter 2006-2007. The storm began in the southern Plains on November 30 and swept across the Midwest during the 30th and December 1, the start of clima-tological winter. It caused numerous deaths and near record damages in many locales. Figure 2-1 shows the outline of the winter storm, as seen by the polar orbiting satellite.
Snowfalls of 6 inches or more fell in less than 24 hours, a threshold long recognized as leading to major problems (Changnon et al., 2006). The area of 6 inches or more extended from central Oklahoma to the Northeast, crossing southeastern Kansas, central Missouri, half of Illinois, eastern Iowa, southeastern Wisconsin, and northern Michigan. Figure 2-2 shows that much of Missouri and Illinois had snowfall of 10 inches or more, with several locales receiving 14 inches or more. Some small areas had 16 inches or more including 18 inches in central Missouri and in west-central Illinois.
Figure 2-. A polar-orbiting satellite captures the outline of the winter storm on December , 2006.
In addition, freezing rain occurred over a large area in and parallel to the snow region. Ice layers of 0.25 inch or more were common in much of Oklahoma, Missouri, and Illinois. A large area where the glaze on surfaces was 0.5 inch or more thick is shown (Figure 2-2). Much of this bad ice area also had snowfall of 2-6 inches as the ice storm ended.
Causes
Prior to this storm, mild weather covered the Midwest. Temperatures on November 26-28 were in the 60s in much of the central and southern Midwest, with 50s to the north. At the same time, however, a cold air mass of Arctic origin became established in southwestern Canada. Beginning on November 28, a cold front representing the eastern edge of this air mass entered western regions with below freezing temperatures behind the front. This front advanced very slowly through the Midwest. On the morning of November 29, freezing temperatures advanced into central Iowa, and the freeze line was in eastern Iowa and western Missouri by evening (Figure 2-3). The front continued to advance at the leisurely rate of about 10 mph. As a low-pressure system advanced from the southwest during the night of November 30-December 1, the front stalled and retreated briefly before again advancing after passage of the low to the northeast. Movement of this front put in place a below-freezing air mass that was very shallow on its advancing edge.
6 6 2 2 2 2 2 2 2 2 6 6 6 6 6 6 6 6 10 10 10 10 10 10 14 14 14 14 6 6
Figure 2-2. Snowfall (inches) and ice storm areas, November 30-December , 2006 storm.
6
Figure 2-. Location of the center of the surface low pressure system (denoted by “L”) at 6-hour intervals between 6 p.m. CST on November 29, 2006, through 6 p.m. CST on December , and location of the center of the upper level
low-pressure system (denoted by “U”) at 2-hour intervals from 6 a.m. CST on November 30 through 6 p.m. CST on December .
Movement of Freeze Line November 29 - December 1, 2006
11/29, 6:00 AM 11/29, 6:00 PM 11/30, 6:00 AM
11/30, 6:00 PM
12/1, 6:00 AM
Figure 2-3. Location of the boundary between temperatures below 32°F (to the west) and above 32°F (to the east) at selected times,
November 29-December , 2006.
Path of Low Pressure Center November 29 - December 1, 2006 11/29 6:00 PM 11/30 12:00 AM 11/30 6:00 AM 11/30 12:00 PM 11/30 6:00 PM 12/1 12:00 AM 12/1 6:00 AM 12/1 12:00 PM 12/1 6:00 PM L U U U U L L L L L L L L
7
Concurrent with movement of this front, cold air from this same Arctic air mass spilled into the western United States just as a low-pressure system entered from the eastern Pacific. These two factors combined to trigger development of a strong storm system*. During the evening of November 29, the surface low- pressure center of this storm was near the border of west Texas and Mexico (Figure 2-4). The low moved eastward into south-central Texas and then curved northeast-ward early on November 30. During the next 24 hours, it moved steadily northeastnortheast-ward and was in west-central Indiana by the early morning of December 1. It then moved rapidly northeastward into southeastern Canada by the evening of December 1. Typical of many strong and rapidly devel-oping systems, a closed upper-level low developed by morning of November 30. This low was west of the surface low but followed a similar path eastward and then northeastward.
Southerly winds ahead of the surface pressure system advected abundant moisture from the Gulf of Mexico. Immediately northwest of the freeze line, cold air near the surface was very shallow with temperatures above freezing at higher altitudes. Thus, precipitation, which formed at much higher, below-freezing levels in the form of snow, fell through a layer above freezing, melt-ing the snow. When it then fell through the shallow near surface freezmelt-ing layer, it supercooled and froze on contact with the surface. Farther northwest, the cold air was deeper, but there was not a layer above freezing. Thus, in those areas, precipitation reached the ground as snow.
Three major factors influenced the magnitude and characteristics of this storm event. First, the combination of the cold Arctic air mass from southwestern Canada into the western United States and very mild air in the eastern United States provided potential energy for development of a strong storm system. Second, given the path of surface low pressure from Texas into the Midwest, winds on the eastern side of the low-pressure center were directly off the Gulf of Mexico, provid-ing abundant moisture to the system. Third, the congruence of the path of the low-pressure system just east of the slow-moving freeze line provided many hours of freezing precipitation.
Analysis of hourly temperature data for Illinois provides further insights into the character of the event. Precipitation primarily occurred during the 12-hour period from midnight on November 30 until noon on December 1. Extreme western parts of the state were below freezing during this entire period (Figure 2-5). During the same period, extreme southeastern Illinois experienced fewer than five freezing hours, all on the morning of December 1 when precipitation intensity had decreased to light levels. There was a very sharp gradient across central Illinois, with the number of freezing hours increasing from 5 hours in Danville to more than 25 hours in Bloomington, less than 80 miles away. Corresponding to these differences, there were no significant storm impacts in Danville, but severe impacts occurred in Bloomington and areas to the west.
An interesting feature of the event was the reversal of the freeze line the night of November 30-December 1 as the low-pressure center approached from the southwest. Figure 2-6 shows the highest temperature recorded that night. Prior to this, the freeze line had progressed past
*In the context of this report, “storm system” refers to large areas of inclement weather that periodically occur during the cold season. These areas are characterized by low pressure both at the surface and throughout the troposphere, and a strong jet stream in the upper troposphere. They also are characterized by fronts, boundaries between cold and warm air.
35 30 25 20 15 10 5
Number of hours below freezing November 30 - December 1, 2006 Champaign Bloomington Peoria Quincy Moline Springfield St. Louis Chicago Rockford Carbondale Danville
Figure 2-. Number of hours with temperature below 32°F between midnight on November 29, 2006, and noon on December , 2006.
34 32 36 38 4042 Maximum advance of freeze line on November 30 Maximum Temperature December 1, 2006 Champaign Bloomington Peoria Quincy Moline Springfield St. Louis Chicago Rockford Carbondale Jefferson City Vichy Springfield Poplar Bluff Cape Girardeau Joplin Kansas City Columbia Kirksville Saint Joseph
Figure 2-6. Spatial pattern of the maximum temperature (°F) between midnight and noon on December , 2006. The dashed line shows the maximum eastward advance of the freezing line on November 30, 2006.
9
Champaign and south of St. Louis. During the night, however, the freeze line retreated westward to a line extending from the western suburbs of Chicago, to the east of Bloomington and Springfield, and to the north of St. Louis. In the area between the eastern advance and westward retreat, there was a period when freezing precipitation changed to rain, reducing accumulations and allowing some melting of ice already accumulated. A comparison of hourly temperatures at Champaign and Springfield (Figure 2-7) indicates very similar behavior, but temperatures throughout the period after the front passed were just a few degrees lower at Springfield. As a result, temperatures failed to exceed freezing during the early morning on December 1 at Springfield, while, there were several hours of temperatures above freezing at Champaign.
Zielinski (2002) notes that November storms that develop around a Texas-Colorado low become very intense as they move northeastward through the central United States and toward the Great Lakes. The 2006 storm qualifies as a top intensity category type 5 winter storm on the Zielinski scale.
Storm Dimensions
Dimensions and intensity of the 2006 storm were assessed using results from all snow-storms during 1949-2006, a 58-year period with 2,305 snow-storms (Changnon, 2007). The shape of the 2006 snowstorm was elliptical (Figure 2-2), and historical storm data revealed that 1,335 past snowstorms, 60 percent of the total, were also elliptical. Preferred orientation for 35 percent of all
Figure 2-7. Time series of hourly temperatures at Springfield, Illinois (thin line) and Champaign, Illinois (thick line) between midnight on November 29, 2006, and midnight on December 2, 2006. The horizontal line indicates the freezing point.
10 20 30 40 50 60 70 Nov. 29
midnight Nov. 29noon midnightNov. 30 Nov. 30noon midnightDec. 1 Dec. 1noon midnightDec. 2
Date/Time T e m p e ra tu re (°F ) Champaign Springfield 32
0
past elliptical-shaped storms, and the 2006 storm, was southwest-northeast. Hence, shape and ori-entation of the 2006 storm were not unusual.
Dimensions of the 2006 storm and averages and extreme values determined from the 1,335 past elliptical snowstorms are shown (Table 2-1). Comparison of the 2006 storm values with the averages reveals the 2006 storm was longer, wider, and much larger than average. It was 3.5 times bigger than the average of 41,300 square miles, but smaller than the largest storm during 1949-2006.
Storm size (152,600 square miles) was compared with sizes of past storms. The 2006 storm was the 93rd largest on record and, thus, in the top 4 percent of all snowstorms since 1948.
The 2006 snowstorm also was evaluated based on how heavy snow areas rated statistically against amounts from snowstorms expected to occur at 5- and 10-year frequencies (Changnon, 2006). Snowfall amounts of 10-14 inches, once in 10-year events, occurred from Oklahoma to northern Illinois (Figure 2-2), over 50,260 square miles. Snowfall amounts rated as once in 5-year (and less than 10-year) events covered 43,400 square miles. This included the area of 6 inches or more in south-central Oklahoma, and areas of 6-10 inches along the storm’s axis into northeast-ern Illinois. Thus, storm amounts matched 5- and 10-year frequencies and covered 93,660 square miles, 61 percent of the total snowfall area. Other moderate to heavy snow areas in Wisconsin and Michigan were amounts that occur more frequently than once in 5 years.
Snowfall data at first-order weather stations with long records inside the 2006 storm area were assessed to measure the magnitude of storm values. Three of the nine stations that met those criteria had snowfall totals from the 2006 storm ranked in the top ten of all events in the past 65 years (Table 2-2). All three stations were in the high snowfall axis of the storm.
Freezing rain south and east of the snowstorm axis extended from southern Oklahoma to southeastern Wisconsin. An ice storm area with 0.5 inch or thicker glaze extended across 19,600 square miles (Figure 2-2), compared to an 8,400-square-mile average area for ice storms since 1948 (Changnon, 2004). Thus, the 2006 ice storm was 2.3 times larger than average and within the top 21 percent of the nation’s 328 ice storm areas measured in the past 55 years.
Table 2-1. Dimensions of 2006 Winters Storm and past Snowstorms, 1949-2006
Past storms
Storm dimensions 2006 storm values Averages Extreme values
Length, miles 1,085 428 2,120
Average width, miles 155 75 —
Maximum width, miles 245 — 760
Size, square miles 152,600 41,300 456,000
Table 2-2. first-order Weather Stations with 2006 Storm Snowfall Amounts (inches) among Top Ten values, 1940-present
Station 2006 amount Rank Record highest
Columbia, Missouri 15.3 2 19.7
Rockford, Illinois 10.7 3 16.5
Tulsa, Oklahoma 8.0 9 13.9
Impacts
The storm led to 19 deaths and more than a thousand injuries. Excessive damages to build-ings and vehicles and resulting financial losses exceeded $900 million.
The property insurance industry assesses and labels all types of storms that exceed $1 million in insured losses as catastrophes. Insured property losses from the 2006 storm totaled $300 million, including $90 million in Missouri and $85 million in Illinois, the states with the greatest insured losses. There were 106,000 loss claims from the 2006 storm, a very high number (Kerney, 2006). The nation has experienced 202 catastrophic winter storms since 1948 (Changnon and Changnon, 2006). The average property loss per storm was $147 million, and the highest loss was $1.8 billion. Hence, 2006 storm property losses of $300 million were double the average. Assessment also showed that 25 of the 202 past catastrophic storms had insured property losses greater than $300 million, indicating that the 2006 storm losses ranked in the top 13 percent of all catastrophic storms.
The 19 deaths (15 in vehicle accidents and 4 from shoveling snow) were three times the average based on past catastrophic winter storms. Such a magnitude of deaths was uncommon for the more sizable past catastrophic winter storms. Most injuries in 2006 came from falls and traffic accidents. Numerous cases of hypothermia and frostbite occurred during six days after the storm. The storm and ensuing 6-day period of 21°F average temperatures, all much below normal, affected several sectors. Included were power and telephone systems, transportation, retail sales, property, the environment, and local, state, and federal governments.
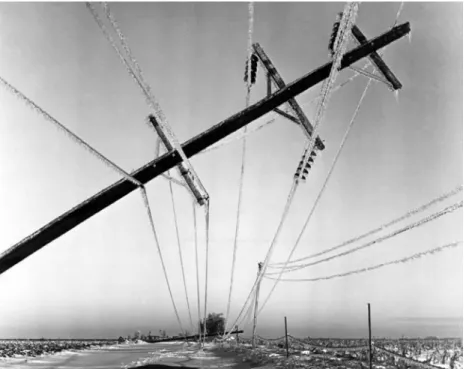
The large storm area with thick ice layers, coupled with moderate to heavy snow, produced extensive losses of power and telephone lines from broken wires due to broken poles and falling tree branches (Figure 2-8). By December 2, 2.4 million customers were without power. Repairs were slowed greatly by thick ice layers, very slick surfaces, and continuing cold temperatures that kept the ice from melting. Power outages still affected 510,000 customers in Missouri and Illinois on December 3, and 350,000 customers were still without power on December 4 (Figure 2-9), including 42,000 customers in Decatur, Illinois. Reports showed that 65,000 customers were without power as late as December 7, six days after the storm ended. Repair costs for power and telephone companies in the eight-state snowstorm area were $177 million. The slow recovery raised government concerns, and Illinois and Missouri launched investigations of the how power companies handled repairs.
2
Customers Affected by Outage by Zip Code
1-1,000 1,001-5,000 5,001-10,000 More than 10,0000
Figure 2-9. Some areas were without power five days after the storm ended on December , 2006.
Figure 2-. The massive ice storm in Illinois and Missouri tore down many power poles, including this one in rural western Illinois on December 2, 2006.
3
Other government actions included use of National Guard troops in Missouri and Illinois. Troops were sent to individual houses in power outage areas to assess the needs of local residents. Governors of three states declared portions of their states as major disaster areas, thus qualifying for federal aid. This included 49 counties in Illinois, 52 counties in Missouri, and 27 counties in Kansas. Costs of snow and ice removal and various snow-ice damage repairs by local and state government agencies totaled $65 million, including $15 million in Illinois. The Federal Emergency Management Agency provided $33 million for the local and state recovery and repair efforts.
As would be expected, the sizable storm had major transportation impacts. Many roads and highways, including several interstate highways, were closed for 1-5 days after the storm, and many rural areas were isolated with no transportation (Figure 2-10). Truck movement was delayed and halted in several areas. Chicago, Kansas City, and St. Louis, the three major rail hubs in the nation, were hit by the storm, and busy rail lines between them were in the axis of the storm. Railyards were closed, delaying or altogether halting trains for 1-2 days. Amtrak passenger trains between Chicago and St. Louis were halted until December 4. Railroad losses plus the costs to remove snow and ice totaled $74 million. Airports were closed from 12 hours up to 3 days at several loca-tions, including the busy airports in Chicago, Milwaukee, and St. Louis. Losses from hundreds of cancelled flights amounted to $145 million. Added costs for travelers stranded at airports and train stations for unexpected meals and hotel costs were an estimated $4 million.
Retail business suffered major losses, and many businesses along the axis of the snowstorm and in the ice storm area were closed 2-7 days. Employees could not get to work, and delivery companies like Fed Ex and UPS were unable to make pickups or deliveries. Retail sales plum-meted, largely from poor transportation conditions. Costs and losses in the retail industry totaled $79 million. Another result was a loss in taxable income from decreased sales, and a $13 million loss of taxes.
Massive icing and heavy snows led to sizable environmental damage to trees and bushes over large areas. Broken limbs and downed trees were common in the heavily iced area (Figure 2-2). Losses, including residential and commercial plantings, were an estimated $30 million.
Various losses and costs from the storm occurred in several economic sectors (Table 2-3). The storm total was $924 million.
Table 2-3. Storm losses and Costs, November 30-December 1, 2006 Sectors Dollars (millions)
Insured property 300 Uninsured property 33 Railroads 54 Airlines 145 Trucking 22 Power/telephone systems 177 Retail business 79 Government 80 Environment 30 Stranded travelers 4 Total 924 Summary
Sizable death totals and $924 million in losses and costs rank this storm as one of worst U.S. winter storms in the past 51 years. Storm dimensions were much above average but not quite at record-setting levels.
• Storm size was in the top 4 percent of all past snowstorms, 3.5 times the average size.
• Snowfalls reached or exceeded 5- or 10-year frequencies in 61 percent of the storm area.
• Ice storm area was 2.3 times the average size and in the top 23 percent of all past ice storms.
• Insured property losses of $300 million were double the winter catastrophe average, the
CHApTER THREE: THE STORM Of fEbRUARy 12-15, 2007
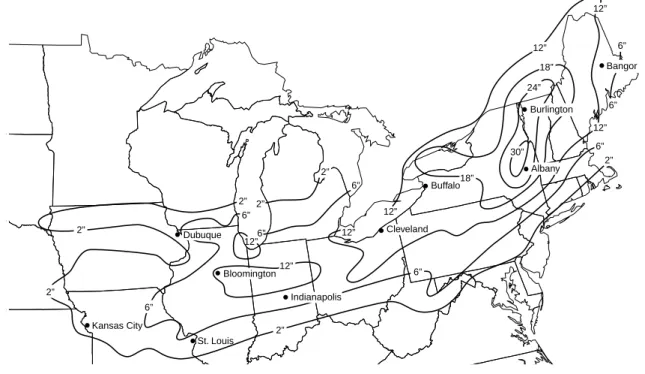
A major winter storm developed in the Midwest on February 12, moved eastward across Pennsylvania and New York on February 13-14, and then struck New England on February 14-15. Near record 24-hour snowfalls occurred, and extremely high winds buffeted the snowstorm area, earning the blizzard label from Illinois to Maine. In the Northeast, the storm was labeled the “Valentine Day’s Blizzard” (AP, 2007). Snowfall of 6 inches or more over 186,200 square miles ranked the storm as the nation’s 29th largest snowstorm since 1949 (Figure 3-1).
South of the heavy snowbelt of the storm were broad areas of freezing rain, including lay-ers up to an inch thick at some locations. Massive storm impacts in the Midwest and East included widespread power outages, and most forms of transportation were halted for two days or more. More than 40 deaths occurred as a result of the storm. Assessed damages to insured property were $0.55 billion, and total storm losses and costs were $1.373 billion.
Causes
The first 10 days of February were very cold in the Midwest and Northern Plains, averaging 6-20°F below normal. Although some moderation began to occur on February 11, a cold Arctic air mass remained in place in southern Canada and the upper Midwest. A relatively weak upper level low-pressure system moved from the eastern Pacific into the western United States on February 11. By February 12, it moved east of the Rockies and began to draw Arctic air to the north into
Snowstorms on February 12-15, 2007 Bangor Burlington Albany Buffalo Cleveland Indianapolis Kansas City Bloomington Dubuque St. Louis 12” 12” 12” 18” 18” 24” 30” 12” 12” 12” 6” 6” 2” 2” 2” 6” 6” 12”6” 6” 6” 6” 2” 2” 2” 2”
6
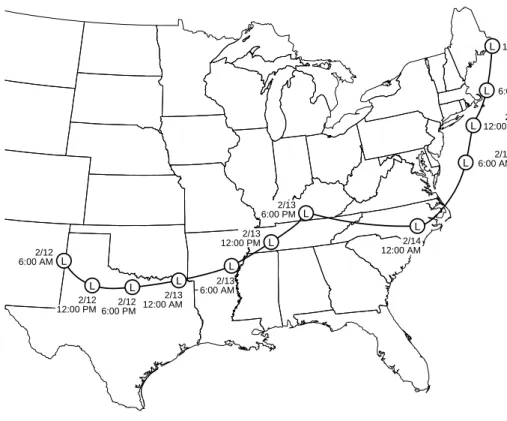
the system, and the surface low-pressure system moved into eastern New Mexico (Figure 3-2). This system intensified rapidly, moved eastward, and was in Kentucky by evening on February 13 (Figure 3-2). The system then moved rapidly to near the east coast of North Carolina and intensi-fied further while moving northeastward along the coast, creating a Nor’easter.
Strong southerly winds ahead of the surface low advected abundant moisture from the Gulf of Mexico during its traverse from New Mexico to North Carolina. During its northeastward movement along the coast on February 14, moisture was brought into the system from the western Atlantic. The amount of water vapor in the atmosphere, as measured by the precipitable water (a quantity representing the vertically integrated water vapor), was above average in the Gulf of Mexico, Caribbean Sea, and western Atlantic Ocean during the storm.
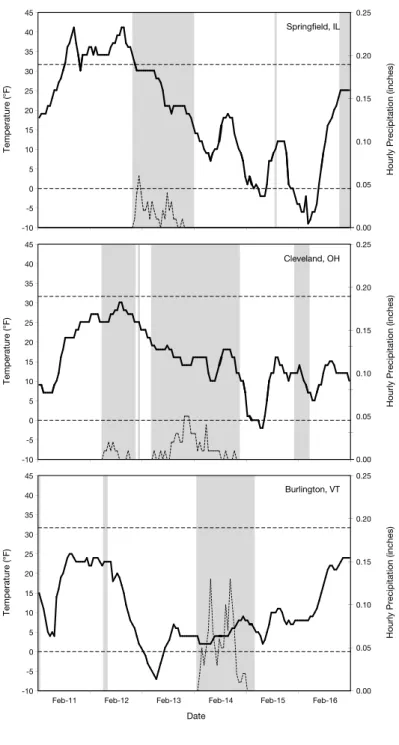
The evolution of the snowstorm (Figure 3-3) is illustrated by hourly temperature and precip-itation data at three representative sites from west to east experiencing heavy snowfall: Springfield, Illinois (11.2 inches), Cleveland, Ohio (17.0 inches), and Burlington, Vermont (25.7 inches). At
Springfield, snow began late on February 12 about the time the temperature dropped below freez
-ing; the early period included a period of heavy snow. Snowfall continued throughout February 13, ending about midnight. At Cleveland, the snowfall on February 12 was probably a result of lake effect, not the storm. Storm-related snowfall began early on February 13 and continued until late on February 14. The heaviest snow occurred late on February 13. At Burlington, snowfall began shortly after midnight on February 14 and continued till early morning on February 15. The heaviest
Path of Low Pressure Center February 12-15, 2007 2/12 6:00 AM 2/12 12:00 PM6:00 PM2/12 2/13 12:00 AM 2/13 6:00 AM 2/13 12:00 PM 2/13 6:00 PM 2/14 12:00 AM 2/14 6:00 AM 2/14 12:00 PM 2/14 6:00 PM 2/15 12:00 AM L L L L L L L L L L L L
Figure 3-2. Location of the center of the surface low-pressure system (denoted by “L”) at 6-hour intervals between 6 a.m. CST on February 2, 2007,
7
Figure 3-3. Time series of hourly temperature (solid line) and precipitation total (dashed line) at Springfield, Illinois, Cleveland, Ohio, and Burlington, Vermont, during February -6, 2006. Horizontal dashed lines indicate the freezing point. Vertical shaded areas indicate time periods when precipitation was reported (either trace or measurable amounts). Hourly precipitation amounts during snowfall events are often biased low, but relative changes are likely to be reasonably accurate
snowfall occurred around 8 a.m. and 5 p.m. on February 14. Progression of snowfall periods, as well as the timing of the heaviest snow, reflect the rapid eastward progression of the storm.
Key elements of this storm were: (1) very cold air in the northern United States and south-ern Canada promoted rapid intensification of a rather weak Pacific storm system, and (2) strong southerly surface winds provided moisture to the system from the Gulf of Mexico and the western Atlantic. The heaviest snow fell from eastern Missouri to Maine in the cold air about 100-400 miles north and west of the path of the surface low-pressure system.
Zielinski (2002), in classifying winter storms, noted that Texas-origin storms that move eastward along the Ohio River valley, as did this storm, get more intense with the development of a deeper low close to the Atlantic Coast. This storm then becomes a Nor’easter and qualifies as a class 5 winter storm, the most intense and severe on the Zielinski scale.
Storm Dimensions
The storm progressed rapidly from west to east, typically producing snow for 24 hours at most locations. Snowfall began early on February 12 in Nebraska, Missouri, Iowa, and Illinois. By the afternoon of February 13, the snowfall was intense across Indiana and Ohio, where it ended on February 14. Snow began early on February 13 in southwestern Pennsylvania and strengthened and produced more snow as it moved closer to the Atlantic Coast on February 14 (Figure 3-2). The storm struck New England February 14-15, ending by noon on February 15. Snowfalls of 12 inches or more fell from Illinois east into New York, and amounts at many locales ranked among the heaviest 2-day snowfalls on record. Chicago had 12 inches, its second largest storm total, as did Champaign, Illinois, the third largest snowfall there since 1901.
The resulting snowfall pattern (Figure 3-1) shows that areas with 12 inches or more snow occurred from Illinois eastward to Maine. Amounts exceeding 18 inches developed in New York and New England as in-flowing moisture from the Atlantic added to the storm’s potential. The heaviest snowfalls, 24-30 inches, fell in the Catskill Mountains of New York, enhanced by the region’s higher elevations.
The area with 12 inches or more snowfall totaled 135,400 square miles (Figure 3-1). Snow-falls of 6 inches or more covered 186,200 square miles, 4.5 times the 4,300-square-mile average area, based on the 2,305 storms during 1950-2006 (Changnon, 2007). The record largest snow-storm of 6 inches or more during 1950-2006 covered 456,000 square miles.
Assessment of snowfall totals and their areal extent revealed that amounts over 38,800 square miles matched once in 5-year recurrence interval frequencies, and amounts over 71,900 square miles matched or exceeded once in 10-year frequencies. The total area with once in 5- or 10-year amounts was 110,700 square miles, 81 percent of the total storm area.
The 6-inch snow area in this February 2007 storm had a maximum length (Illinois to Maine) of 1,446 miles, as compared to the average of 428 miles and a one-storm maximum of 2,130 miles. Average width of the 6-inch snowfall area in the 2007 storm was 205 miles, much more than the average of 75 miles.
9
Considerable freezing rain and sleet occurred along the storm’s southern sections (Figure 3-1). Ice layers typically were 0.25 inch thick. A north-south band of freezing rain 80 miles wide extended from southern Illinois across southern Indiana, southern Ohio, and into Pennsylvania and West Virginia. Freezing rain with ice layers of 0.5 inch or more fell over 13,800 square miles in Ohio and parts of west Virginia, 1.6 times greater area than average for past ice storms (Changnon, 2004). A portion of south-central Ohio had ice layers up to an inch thick.
Impacts
Ice and heavy snowfalls, coupled with persistent high winds, damaged many power lines, creating widespread power outages for 1-3 days in ice storm areas. More than 250,000 customers were without power, a problem intensified by the sub-zero temperatures for 2-3 days following the storm. Added costs for repairs and additional crews to repair downed power and telephone lines were $226 million.
Ice, heavy snows, and high winds were also detrimental to all forms of transportation. Many hundreds were trapped, some on highways and thousands in rural areas for days before roads were passable (Figure 3-4). Road clearing was ineffective 2-3 days after the storm as per-sistent high winds constantly created drifts over newly plowed roads and highways. Whiteout conditions also seriously limited visibility, halting traffic and creating accidents. The extreme cold further limited road clearance. In many snowstorm areas, road closures or slowdowns led many travelers to stay overnight, filling local hotels. Added income for hotels of $7 million was an added
20
Figure 3-. An Amtrak train pushes through deep drifts in central Illinois
(photo by Steve Smedley).
cost to travelers and truck drivers. In some communities, temporary shelters were established. Thousands of vehicle accidents occurred along the heavy snow belt, and more than 3,000 accidents were reported.
Many airports were closed 24-48 hours, including those at Chicago, Springfield, Peoria, Indianapolis, Columbus, Cleveland, Pittsburgh, Philadelphia, Boston, and at New York City and Albany. Airline losses and costs were $153 million. Railroads had numerous problems with snow blockage (Figure 3-5), and snow removal took up to two days in the heavy snow areas. Added costs were $29 million. Truck stoppages and slowdowns led to shipping company losses and additional costs of $25 million.
Damages to property included autos, homes, and businesses. Insured property damages of $0.55 billion resulted from the ice and heavy snows. This was the sixth highest single winter storm loss since records began in 1949. Uninsured property losses were estimated at $100,000, based on past studies showing uninsured losses in major storms were 15-20 percent of the insured amounts (Changnon et al., 1997).
Costs to government agencies were high. At state and local levels, enormous snow-removal efforts incurred major costs. The city of Chicago added 75 staff members to help with snow removal. Communities with populations of 50,000-100,000 in heavy snow areas (12 inches or more) reported snow removal costs of about $100,000, an estimated $10,000 per inch of snow. Many snowplow drivers worked 12-hour days for a week. The New York National Guard was activated to help clear roads and to help trapped persons. Because of the bad conditions, state employees in Pennsylvania
2
and Vermont were told to stay home for 1-2 days, Maine’s governor declared a state of emergency. Government costs from the storm totaled $148 million.
Blocked traffic flow and other dangers led to closure of most schools and many government buildings in the storm area. School closures lasted 2-4 days. The University of Illinois closed for two days, the first time since a blizzard in 1978. Postal deliveries were halted for 1-3 days.
Many deaths from the storm were a result of auto accidents. A child was killed in Ohio from a falling tree branch. Falls due to heavy snow and ice on sidewalks led to many injuries and two deaths. Snow shoveling-induced heart attacks led to 11 deaths. State death totals included Illinois (6), Missouri (3), Michigan (1), Indiana (6), Ohio (5), Nebraska (2), Pennsylvania (4), New York (6), and New England states (8). In all, 41 deaths occurred.
Impacts were lessened to some extent by excellent forecasts of the storm, often issued 24 hours before it began. This allowed persons to stock up on food and water for the storm.
Businesses were hurt from lost sales and delayed deliveries, including limited Valentine Day deliveries. Shopping was greatly reduced, as were deliveries of supplies. Lost sales by retail businesses were an estimated $120 million.
As with all extreme U.S. weather events, there were a few storm-derived benefits. This included $7 million added income to hotels. Ski resorts in New England claimed the added snow
was a major benefit to future seasonal business. Private snow-removal firms also benefitted by han
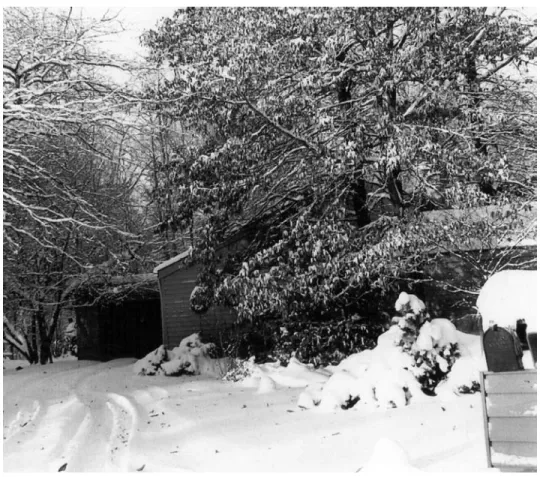
-dling removals for private homes and for the government in areas with inadequate or unavailable facilities. The deep snow layer provided considerable moisture for underlying soils (Figure 3-6), only two months before the start of the 2007 growing season.
22
Table 3-1. Storm losses and Costs, february 12-15, 2007 Sector Dollars (millions)
Insured property 550 Uninsured property 100 Airlines 153 Railroads 29 Trucking 25 Retail business 120 Government 148
Power and telephone 226
Travelers 7
Environment 15
Total 1,373
Various losses and costs from the storm occurred in several economic sectors (Table 3-1). The storm total was $1.373 billion.
Summary
This winter storm caused 41 deaths, an extremely large number of deaths, and near record economic losses of $1.373 billion. This storm was the most damaging, in both measures, of the 14 winter storms during winter 2006-2007. The storm’s physical dimensions were much above aver-age, and the storm affected several major cities including Chicago, Indianapolis, Columbus, and Cleveland in the Midwest. Storm highlights include:
• The storm was the 29th largest U.S. storm since 1949, and 4.5 times larger than average,
and extended from the High Plains to Maine, and 6-inch or heavier snowfalls covered 186,000 square miles.
• Extremely high winds and blizzard conditions occurred in deep snow areas, and high winds
persisted 2-3 days after the storm ended, creating major problems.
• Snowfalls reached once in 5- and 10-year frequencies over 61 percent of the total storm area. • An ice storm with ice layers of 0.5 inch or more covered 13,800 square miles, 1.6 times the
average size.
• Insured property losses totaled $0.55 billion, the sixth highest winter storm amount since
23
CHApTER fOUR: THE STORM Of fEbRUARy 22-26, 2007
On February 22, heavy snow and high winds began in the northern High Plains, and the storm system moved eastward, intensifying in Minnesota and Wisconsin where some areas had 20-30 inches of snow, breaking local records. Snowfall produced by the eastward-moving low-pressure system then crossed southern Michigan, and then extended across northern Ohio, Pennsylvania, New Jersey, and parts of New York, Maryland, and Virginia (Figure 4-1). A large area of freezing rain occurred along the southern boundary of the heavy snow zone in the upper Midwest, with some areas in Iowa having ice layers up to an inch thick and bad damages (Figure 4-2). The storm caused major power outages and halted or delayed many forms of transportation in the upper Midwest.
Causes
A strong upper level storm system moved from the western Pacific into the western United States on February 22. By the morning of February 24, it had moved east of the Rockies with an intensifying surface low-pressure area centered in northeastern New Mexico. This system moved into northern Illinois by the evening of February 25. It then slowed considerably and eventually dissipated over the Great Lakes (Figure 4-3). A second strong upper level storm entered the Pacific Northwest on February 27. By the next morning, intensifying surface low pressure had developed east of the Rockies centered in southeastern Colorado. This system tracked northeastward just slightly north of the February 23-26 storm. By the evening of March 1, it had reached northeast-ern Iowa, slowed considerably, and then dissipated over the Great Lakes by March 3. These close
Storm on February 22-26, 2007
freezing rain area Baltimore Detroit Madison 2” 2” 2” 6” 6” 6” 6” 6” 6” 6” 6” 6” 10” H 10” 20” 10” 10” 10” 2” 2” 2” Minneapolis Sioux City
2
Figure -3. Location of the center of the surface low-pressure systems (denoted by “L”) at 6-hour intervals between 6 p.m. CST on February 2, 2007, through 6 a.m. CST on February 26 for the first storm, and between 6 a.m. CST
on February 2, and 6 a.m. CST on March 3 for the second storm.
Path of Low Pressure Centers
February 24-26, 2007 and February 28 - March 3, 2007
2/24 6:00 PM 2/28 6:00 AM 2/28 6:00 PM 2/28 6:00 AM 2/28 6:00 AM 2/28 6:00 AM 2/28 6:00 AM 2/28 6:00 AM 2/25 6:00 AM 2/25 6:00 PM 2/26 6:00 AM L L L L L L L L L L L
2
back-to-back storms resulted in large snowfall accumulations due to their similar storm tracks and slow movement.
In both storms, strong southerly winds brought abundant moisture from the Gulf of Mexico. Hourly temperature and precipitation data at three representative sites from north to south expe-riencing heavy snowfall illustrate the snowstorm evolution (Figure 4-4): Duluth, Minnesota (38.1 inches), Rochester, Minnesota (25.8 inches), and La Crosse, Wisconsin (28.7 inches). Snow began at all three locations on the afternoon of February 23 and was almost continuous until late on February 26 when it ended at La Crosse and Rochester. Snowfall continued into February 28 at Duluth because of persistent easterly winds across Lake Superior causing lake-effect snowfall. Temperatures were near or just a few degrees below freezing at La Crosse during this event, a reflection of location on the southern fringe of the heavy snowfall band. Temperatures were a few degrees colder at Rochester and Duluth.
The second snowfall event began late on February 28 at Rochester and La Crosse and shortly after midnight on March 1 at Duluth. Snowfall ended late on March 2 at Duluth and shortly after midnight on March 3 at Rochester and La Crosse. As the second storm moved northeastward, surge of warm air briefly raised temperatures above freezing at Rochester and La Crosse. Snowfall duration in these storms was high: more than three days for the first storm and about two days for the second storm.
The key elements of these storms were: (1) the Pacific storm systems were already quite strong and did not require much cold air for development; (2) strong southerly winds provided abundant moisture; and (3) the systems stalled as they reached the Great Lakes, lengthening snow-fall duration.
Dimensions
The snowfall pattern created by the February 22-26 storm (Figure 4-1) reveals that 6 inches or more snow fell from the Dakotas eastward and covered most of Minnesota and Wisconsin. Such snowfalls also occurred in lower Michigan and then extended southeast across northeastern Ohio, Pennsylvania, and parts of Virginia and Maryland. The storm was most intense in southern Wisconsin, and an area of 9,600 square miles had 20 or more inches of snow. Record high totals included those at La Crosse, Wisconsin (22.4 inches) and Winona, Minnesota (29.5 inches).
This was a very large storm with 6 inches or more of snow over 238,000 square miles. This 19th largest storm over the past 58 years (Changnon, 2007) was six times larger than average storm size (41,300 square miles). The 6-inch snow area, from the Dakotas to eastern Michigan, was 840 miles long, twice the 428-mile average, but less than the record longest storm (2,120 miles). Average width of the 6-inch area with this storm was 305 miles, four times the 75-mile average but less than record greatest width (760 miles). High winds exceeding 35 mph persisted 6-15 hours in snowfall areas of the eastern plains and upper Midwest, resulting in blizzard conditions.
The area with freezing rain covered 35,100 square miles, and ice storm conditions (ice lay-ers 0.5 inch or more) occurred over 18,100 square miles. The national average size of ice storms is 8,400 square miles (Changnon, 2004). Thus, this February ice storm area was about two times
26
Figure -. Time series of hourly temperature (solid line) and precipitation total (dashed line) at Duluth, Minnesota, Rochester, Minnesota, and La Crosse, Wisconsin, between February 23 and March 3, 2007. The horizontal dashed line indicates the freezing point. Vertical shaded areas indicate time periods when precipitation was reported (either trace or measurable amounts). Hourly precipitation amounts during snowfall events are often biased low, but relative changes are likely to be reasonably accurate indicators
27
larger than average. Portions of the iced area in Iowa and Wisconsin had ice layers an inch thick, which coupled with high winds, produced very damaging conditions.
Impacts
Heavy snow, glaze, and high winds led to various problems (Figure 4-5). Major power out-ages occurred in Illinois, Iowa, Minnesota, Nebraska, and Wisconsin on February 23-25. The ice storm in eastern Iowa brought down hundreds of power poles and 250,000 customers lost power for 2-5 days. Power outages affected 83,000 customers in northern Illinois. Snowstorm amounts of 6-10 inches also caused power outages in Ohio, Maryland, northern Virginia, and the Washington, D.C. area, where 22,000 customers lost power. Costs to restore the power system for the entire storm area were $153 million (Table 4-1).
Problems with transportation systems were also numerous. Chicago’s O’Hare Airport can-celled 550 flights on February 25, and all other flights were delayed 90-120 minutes. The blizzard in the upper Midwest greatly reduced visibility and made snow removal nearly impossible in parts of Wisconsin, Minnesota, and Nebraska. Many accidents occurred, resulting in eight deaths in Wisconsin and another in Kansas. Railroads in Wisconsin and Minnesota had to use snow-removal equipment to clear their tracks. Storm damages and costs for all forms of transportation amounted to $190 million.
2
Damages to vehicles, houses, and buildings led to extensive property losses. Insured prop-erty losses totaled $150 million, and uninsured losses were $20 million. Government agencies experienced $65 million in added costs, many due to snow removal and repairs. Government ser-vices, including mail delivery, were reduced for 2-3 days (Figure 4-6). Other storm-related losses and costs, a total of $638 million, are listed in Table 4-1.
Table 4-1. Storm losses and Costs, february 22-26, 2007 Sector Dollars (millions)
Insured property 150 Uninsured property 20 Airlines 125 Railroads 21 Trucking 44 Retail business 46 Government 65
Power and telephone 153
Travelers 2
Environment 12
Total 638
29 Summary
This extremely large storm produced snowfall of 6 inches or more over 238,000 square miles. Total losses and costs of $638 million and 7 deaths were attributed to the storm, near average values for winter storms. Although a very large storm, it struck only two urban centers, Minneapolis and Milwaukee.
• This 19th largest storm on record was double the average length and four times the average width of winter storms.
• A major blizzard occurred with snow in the upper High Plains and upper Midwest.
• Record-high snowfall amounts fell in portions of Minnesota and Wisconsin.
• An ice storm with ice layers 0.5 inch or thicker covered 18,100 square miles, double the
average.
30
CHApTER fIvE: SUMMARy
Impacts
The Midwest experienced three very large, damaging storms during winter 2006-2007. Areas with 6 inches or more snowfall in all three storms were two or more times larger than the average based on all U.S. storms during 1950-2007. The November 30-December 1 storm was in the top 4 percent of all past storms; the February 12-15 storm was the 29th largest storm on record; and the February 22-26 storm was the 19th largest storm on record. All three storms were elliptical in shape, the most common snowstorm shape, but storm lengths and widths were much above aver-age. All three storms produced snowfall totals at certain locations at or above prior record highs.
Six of the nation’s 14 winter storms during 2006-2007 were rated by the property insurance industry as catastrophes, and each exceeded $25 million in property damages. Losses and areas where they occurred are shown (Table 5-1).
Six winter catastrophes occurred in 2006-2007, the second largest number since insurance records began in 1949. Nine catastrophes occurred in 1978-1979. Total insured property losses from the six winter storms in 2006-2007 were $1.5 billion, the sixth greatest loss for a winter season. The highest one-season loss was $2.968 billion in 2002-2003, with $2.686 billion in 1992-1993, and $2.127 billion in 1950-1951 (all expressed in 2007 dollars).
Assessment of impacts of the winter’s three major storms revealed five sectors suffered the most losses and costs to respond (Figure 5-1). Property losses, including damage to vehicles, homes, and buildings, were near record proportions. Power outages were another major damage area with large losses and major costs to restore service. Major transportation problems occurred. For example, Chicago’s O’Hare Airport, the nation’s busiest terminal, had 55 percent of its February flights delayed or cancelled. Trucking firms had major losses and excessive delays in deliveries, as did railroads that also incurred major costs in snow removal.
Business was the fourth sector to experience substantial losses, and retail sales decreased 40-60 percent in storm areas. February storms had a major impact on sales of new homes. Sales fell 27 percent in the Midwest in February, and economists attributed this to heavy snows and
Table 5-1. losses in 2006-2007 Winter Storms Classified as Catastrophes Date Dollars (millions) Major loss areas
October 12-14, 2006 210 New York
November 30-December 2, 2006 300 Midwest
January 12-17, 2007 245 High Plains-South-East
January 13-15, 2007 45 West-Southwest
February 13-15, 2007 550 Midwest-Northeast
3
low temperatures (Chicago Tribune, March 2007). In contrast, February home sales rose 25
per-cent in the West where good weather existed. The construction industry experienced major work stoppages, and 63,000 jobs were lost. Local, state, and federal governments also had sizable snow-removal and road repair costs, and many key government services, including mail delivery, were halted for days.
The three major storms in the Midwest created major losses and ensuing costs to respond. The economic impacts and death totals from these storms are shown (Table 5-2).
Figure -. News headlines illustrate problems in the Midwest from the three 2006-2007 winter storms.
Table 5-2. Total losses, Costs, and Deaths from Three Top Winter Storms, 2006-2007 Dates Dollars (billions) Deaths
February 12-15, 2007 1.373 41
November 30-December 1, 2006 0.924 19
32
The storm on February 12-15 caused more economic losses in the East and Northeast than in the Midwest. Based on insured losses, the Midwestern total was $820 million. Losses from the November 30-December 1 storm ($0.924 billion), all in the Midwest, are the winter’s single storm maximum for the Midwest.
Deaths in the Midwest from the three storms included 21 (February 12-15), 19 (November 30-December 1), and 8 (February 22-26), for a regional total of 48 deaths. More than 3,000 injuries also occurred. Many persons experienced anxiety and stress from the three storms. Travel was difficult or impossible, and many people could not get to work. Thousands of homes were without power for several days. In many instances, travelers were stopped far from their destinations, and many schools were closed.
Amazingly, there were a few storm-related benefits. Hotels in storm areas had increased busi
-ness from stalled travelers. Incomes of private snow-removal firms greatly increased. The region’s soil moisture was recharged by the melting of heavy snows just before the 2007 growing season.
Summation of the losses of the three storms and assessment of the magnitudes of the losses for each major sector affected revealed that property losses were 40 percent of the total losses. Transportation losses were 22 percent of the total; utilities, 23 percent; retail 7 percent; and gov-ernment losses and costs, 8 percent. The relative magnitudes of the 2006-2007 storm losses were compared to those from 35 winter storms in Illinois during 1977-1979 (Changnon and Changnon, 1978; Changnon et al., 1980). Major losses in the 1970s occurred in the same five sectors as in the recent storms (property, transportation, utilities, retail, and government), but percentages of the total losses of 35 storms attributed to each sector were different. The major difference between the 1970s storms and recent storms was in the property losses that accounted for only 29 percent of the total losses in the 1970s, as compared to 40 percent in 2006-2007. The relative increase in property losses from winter storms is related to two factors: ice storm differences and societal changes. The 2006-2007 storms had major ice storms with heavy glaze, all more severe than those with the 1970s winter storms. Population growth, a denser array of housing and buildings, and more wealth, as reflected in the greater number of autos per household (Changnon et al., 2000), have made the Midwest more vulnerable to storm damage. This important finding is a singular message for the insurance industry and for property owners.
Assessment of the reasons for high losses from certain intense winter storms found that the two most damaging storms of 2006-2007, as compared to much less loss from the equally intense and larger storm of late February 2007 (Table 5-2), hit many more large urban areas. The November 30-December 1, 2006, storm produced heavy snow and ice at Tulsa, Kansas City, St. Louis, Peoria, Chicago, and Milwaukee, and the February 12-15, 2007, storm hit Chicago, Indianapolis, Columbus, Cleveland, Pittsburgh, Philadelphia, New York, and Boston. In contrast, the February 22-25 storm only affected Minneapolis and Milwaukee. Assessment of 17 winter storms in 1978-1979 in Illinois revealed that most (72%) of the total storm losses came from the three storms that hit the Chicago area (Changnon et al., 1980).
33 Climate Conditions
A common question during periods of unusual weather occurrences is whether climate conditions on a hemispheric or global scale are the cause of the events. This is a question that can
rarely be answered definitively, as is the case with the events of this report. Two conditions, how
-ever, may have played some role, as described below.
Kunkel and Angel (1999) found that snowfall tends to be deficient during strong El Niño events in the central Midwest, specifically from Illinois eastward. During the late summer of 2006, a rather weak El Niño developed. Sea surface temperatures (SSTs) rose to above average levels
in the eastern equatorial Pacific (in a region denoted as Niño3.4 often used as an El Niño indica
-tor) during the summer (Figure 5-2), a condition characteristic of El Niño events. The peak value of about 1.3°C in early December was typical of an average El Niño. Usually, an El Niño event continues through the winter. This event was short lived, however, and by February the Niño3.4 index was near normal conditions (Figure 5-2). Thus, any suppressing effects of El Niño on winter storms in the Midwest would not have been present by the time of the February and March storms. Notably, the western portion (the part in Illinois, Indiana, and Ohio) of the belt of heavy snow during the February 12-15 storm event coincides with an area of very deficient snowfall during El Niño events (Kunkel and Angel, 1999).
The SSTs in the Caribbean (Figure 5-2) were somewhat above normal throughout 2006, in the range of 0.1-0.2°C above normal. In early 2007, they increased further, to about 0.3°C above normal by February. This is the highest February value in the entire record of the Caribbean SST index, which is calculated back to 1951. The amount of water vapor in the atmosphere over oceans is closely related to SSTs, with higher SSTs leading to higher levels of atmospheric water vapor. Indeed, atmospheric water vapor levels were higher than average during February 2007 over the Caribbean, the Gulf of Mexico, and portions of the western Atlantic, the primary source regions for water vapor for these winter storms. Thus, the amount of water vapor available to the storms was above average for the time of year.
Figure -2. Time series of the weekly Nino3. SST index (solid line) and the monthly Caribbean SST index (dashed line), January 2006-April 2007.
0.2 0.3 0.4 -0.5 0.0 0.5 1.0 1.5 2.0 0.0 0.1 -0.1 -0.2 -0.3 -0.4 -1.5 -2.0 -1.0 Date Niño3.4 SST Index (°C)
Jan Feb Mar Apr May Jun Jul Aug Sep Oct Nov Dec Jan Feb Mar Apr 2006 2007
Caribbean SST Index (°C)
Niño3.4
3
REfERENCES
Associated Press. February 14, 2007. The Valentine’s Day Blizzard.
Changnon, S.A. 2004. Climate Atlas: Freezing Rain and Ice Storms. Changnon Climatologist, Mahomet, IL.
Changnon, S.A. 2006. Frequency Distributions of Heavy Snowfall from Snowstorms in the U.S.
Journal of Hydroponic Engineering, ASCE, 11: 427-431.
Changnon, S.A. 2007. Final Report Snowstorm Project. Changnon Climatologist, Mahomet, IL.
Changnon, S.A., and D. Changnon. 1978. Record Winter Storms in Illinois, 1977-1978. Report of
Investigation 88, Illinois State Water Survey, Champaign, IL.
Changnon, S.A., and D. Changnon. 2006. Snowstorm Catastrophes in the U.S. Environmental
Hazards6: 158-166.
Changnon, S.A., D. Changnon, E. Fosse, D. Hoganson, R. Roth, and J. Totsch. 1997. Effects of Recent Extremes on the Insurance Industry: Major implications for Atmospheric Sciences.
Bulletin of the American Meteorological Society 78: 425-435.
Changnon, S.A., D. Changnon, and T.R. Karl. 2006. Temporal and Spatial Characteristics of
Snowstorms in the Contiguous U.S. Journal of Applied Meteorology and Climatology45:
1144-1155.
Changnon, S.A., D. Changnon, and P. Stone. 1980. Illinois Third Consecutive Severe Winter:
1978-1979. Report of Investigation 94, Illinois State Water Survey, Champaign, IL.
Changnon, S.A., R.A. Pielke, D. Changnon, R.T. Sylves, and R. Pulwarty. 2000. Human Factors
Explain the Increased Losses from Weather and Climate Extremes.Bulletin of the American
Meteorological Society81: 437-442.
Chicago Tribune. March 27, 2007. Home Sales Declined. Section 3, page 2.
Freedman, A. 2007. An Anatomy of a Forecast: Arborgeddon takes Buffalo by Surprise. Weatherwise
60: 16-21.
Kerney, G. 2006. Comments. Property Claims Service, NJ.
Kunkel, K.E., and J.R. Angel. 1999. Relationship of ENSO to Snowfall and Related Cyclone Activity
in the Contiguous United States, Journal of Geophysical Research104: 425-19,434.
Zielinski, G.A. 2002. A Classification Scheme for Winter Storms in the Eastern and Central U.S.
Equal opportunity to participate in programs of the Illinois Department of Natural Resources (IDNR) and those funded by the U.S. Fish and Wildlife Service and other agencies is available to all individuals regardless of race, sex, national origin, disability, age, religion, or other non-merit factors. If you believe you have been discriminated against, contact the funding source’s civil rights office and/or the Equal Employment Opportunity Officer, IDNR, One Natural Resources Way, Springfield, IL 62702-1271; 217/785-0067; TTY 217/782-9175.