Developing statistical and bioinformatic analysis of genomic
data from tumours
Rohit Thakur
Submitted in accordance with the requirements for the degree of
Doctor of Philosophy
The University of Leeds
Faculty of Medicine and Health
This candidate confirms that the work submitted is his own and that appropriate credit has been given where reference has been made to the work of others.
This copy had been supplied on the understanding that it is copyright material and that no quotation from the thesis may be published without proper acknowledgement Ó 2018 The University of Leeds Rohit Thakur
Acknowledgements
This project has received funding from the European Union’s Horizon 2020 research and innovation programme under the Marie Skłodowska-Curie grant (MELGEN) agreement No 641458. Being a part of the MELGEN program provided me with several training opportunities to develop my statistical, bioinformatic, and complementary skills. Additionally, because of this program, I was able to pursue internships at two academic institutions and at a private company. This program helped in my career development immensely by enabling me to attend and present my research at several scientific meetings.
The collection of samples in the Melanoma Cohort Study was funded by Cancer Research UK (project grant C8216/A6129, Programme awards C588/A4994 and C588/A10589) and Centre Award (C37059/A11941) and by the NIH (R01 CA83115). I would like to thank all my supervisors for providing me with incredible mentorship. Without their supervision this dissertation would not have been possible. I would also like to express my sincerest gratitude to everyone who has helped me in pursuing this thesis, especially I would like to thank:
Prof. Jenny Barrett, my main supervisor, for introducing me to the field of biomedical statistics and for always guiding me. Prof. Barrett helped me in developing statistical thinking skills by providing constructive feedback on my monthly progress reports and statistical analyses. Prof. Barrett always kept track of my progress due to which I was able to finish this project in a timely manner. When I started my PhD, I had an inherent fear about scientific writing, Prof. Barrett’s mentorship helped me overcome this fear by developing good scientific writing skills.
Prof. Julia Newton-Bishop, my co-supervisor, for introducing me to the field of translational melanoma research. Prof. Newton-Bishop helped me improve my thinking from a clinical perspective and her clinical insights have immensely helped in the development of this thesis. Prof. Newton-Bishop also helped in developing a strong network with principal investigators from several other institutions.
Dr Jérémie Nsengimana, my co-supervisor, for helping me develop supervised and unsupervised analyses pipelines and providing a rigorous review on my writing and presentation skills. Dr Nsengimana also provided me with the pre-processed microarray data generated from the LMC study cohort.
Prof. Tim Bishop, for being a great mentor, creating a positive atmosphere, and giving me feedback on my thesis project at weekly group meetings. Despite his busy schedule, Prof. Bishop took out time for discussions, the spectrum of which varied from
academic research to ongoing cricket series. Prof. Bishop helped me move my project forward by taking a lead on requesting access to several independent melanoma datasets.
Prof. Göran Jönsson, my external supervisor, for giving valuable feedback in the supervisory meetings and collaborating with our group on this project. Prof. Jonsson also gave me an opportunity to pursue a short internship with his group at Lund University, Sweden. I also want to thank Dr Martin Laüss (postdoctoral fellow with Prof. Jönsson) for granting me access to their gene expression dataset. Dr Laüss also taught me differential gene expression analysis during my internship.
Dr Jon Laye, for his brilliant suggestions and insightful thinking on the biological aspects of this thesis. Dr. Laye, trained me in drawing figures in a logical format. I have always cherished our conversations on understating some of the results in this thesis. Dr Juliette Randerson-Moor, for helping me with administrative tasks, preparing presentations and giving her feedback during regular group meetings. Dr. Randerson-Moor provided unique guidance and support to write this thesis in the correct format.
Dr Mark Harland, for helping me with the analysis of outlying samples in the dataset and explaining me the technical protocols behind generation of the gene expression dataset.
Dr John Davies, for providing feedback on statistical analysis during the regular lab meetings and improving my understanding on the Cox proportional hazard models. Dr Sally O’Shea, for sharing words of wisdom on writing the PhD thesis. Dr. O’Shea calculated the mitotic rate from the tumour cores which was used in the univariable and multivariable analyses.
May Chan, for always motivating me and giving access to the datasets analysed in this study.
Faye Elliott, for positively encouraging me to complete this thesis on time. Dr Mark Iles, for providing feedback on the statistical analysis in aims 1 and 2. Katie Cairns, for kindly helping me to keep a track of my annual leave, and arranging the logistics when I went for international conferences and internships.
Dr Will Spooner and Eleanor Stanley (members of the Eagle Genomics company), for giving an opportunity to pursue an internship at the Eagle Genomic company. Dr Bram Vandekerckhove (a member of the company) helped me with applications of machine learning technique support vector machine to our dataset.
Prof. Manolis Kellis for giving me the opportunity to pursue an internship in his group at Massachusetts Institute of Technology, USA. Alvin Shi (PhD student with Prof. Kellis) helped me with the feature selection in machine learning.
Joey Diaz, for introducing me to the field of copy number data analysis and helping me during my knee injury. Joey and I have always motivated each other on writing the PhD thesis.
Sathya Muralidhar, for giving insightful feedback during group meetings. Joanna Pozniak for helping me with the Cytoscape and ReactomeFiViz based network enrichment analysis and improving my understanding of immune cell subtypes.
Theofanis Tsismentzoglou, for sharing words of encouragement during lunch breaks.
I would also like to thank my friend Payal Ganguly for always being supportive and encouraging and especially for going out of her way to help me during my knee injury period.
Finally, I would like to thank my mother (Revti Devi) and father (Duni Chand), who made several sacrifices to get me to this point today, for their love, support, and encouragement. I want to thank my sister (Yogita Kumari) for always having my back and being a constant source of motivation. I also want to thank my uncle (Gauri Dutt Thakur) who taught me to aim for the stars. I am also thankful to my grandmother (Soma Devi), my partner (Saumya Sisoudiya), and her family (Yogeshwar Singh Sisoudiya, Dushyant Sisoudiya, Rita Sisoudiya and Swati Sisoudiya) for their strong support during the course of this PhD.
Abstract
Previous prognostic signatures for melanoma based on tumour transcriptomic data were developed predominantly on cohorts of AJCC (American Joint Committee on Cancer) stages III and IV melanoma. Since 92% of melanoma patients are diagnosed at AJCC stages I and II, there is an urgent need for better prognostic biomarkers to allow patient stratification for receiving early adjuvant therapies.
This study uses genome-wide tumour gene expression levels and clinico-histopathological characteristics of patients from the Leeds Melanoma Cohort (LMC). Several unsupervised and supervised classification approaches were applied to the transcriptomic data, to identify biological classes of melanoma, and to develop prognostic classification models respectively.
Unsupervised clustering identified six biologically distinct primary melanoma classes (LMC classes). Unlike previous molecular classes of melanoma, the LMC classes were prognostic in both the whole LMC dataset and in stage I tumours. The prognostic value of the LMC classes was replicated in an independent dataset, but insufficient data were available to replicate in an AJCC stage I subset.
Supervised classification using the Random Forest (RF) approach provided improved performances when adjustments were made to deal with class imbalance, while this did not improve performance of the Support Vector Machine (SVM). However, RF and SVM had similar results overall, with RF only marginally better. Combining clinical and transcriptomic information in the RF further improved the performance of the prediction model in comparison to using clinical information alone. Finally, the agnostically derived LMC classes and the supervised RF model showed convergence in their association with outcome in some groups of patients, but not in others.
In conclusion, this study reports six molecular classes of primary melanoma with prognostic value in stage I disease and overall, and a prognostic classification model that predicts outcome in primary melanoma.
Table of Contents
Acknowledgements ... iii
Abstract ... vi
Table of Contents ... vii
List of Tables ... xiii
List of Figures ... xvi
Abbreviations ... xviii
Chapter 1 Introduction ... 1
1.1 Human skin and melanoma ... 1
1.1.1 Melanocytes ... 2
1.1.2 Melanin, melanogenesis and response to UVR ... 2
1.1.3 Melanocytes to melanoma... 3
1.2 Cutaneous melanoma ... 3
1.3 Melanoma epidemiology ... 4
1.4 Melanoma genetics ... 5
1.5 Melanoma histopathological classification, prognostic factors and survival ... 6
1.5.1 AJCC staging system ... 6
1.5.2 Prognostic factors in primary melanoma ... 9
1.5.3 Melanoma survival based on the AJCC stage ... 10
1.6 Genomic classification of melanoma ... 11
1.6.1 Mutational subtypes of melanoma ... 11
1.6.2 Somatic copy number association with mutational subtypes ... 12
1.7 Gene expression profiling technologies ... 12
1.7.1 DNA microarrays ... 13
1.7.2 RNA-sequencing ... 13
1.8 Gene expression based classification of melanoma ... 15
1.8.1 Supervised classification using gene expression ... 15
1.8.2 Unsupervised classification using gene expression ... 20
1.9 Outline of this study ... 23
1.9.1 Aims and objectives ... 23
1.9.2 Outline of the chapters ... 24
Chapter 2 General Methods ... 26
2.1 Leeds Melanoma Cohort (LMC) ... 26
2.2 Gene expression data ... 27
2.2.1 Tumour core generation ... 27
2.2.2 RNA extraction and Expression data generation ... 27
2.2.3 Data pre-processing ... 28
2.3 Clinico-pathological characteristics ... 29
2.4 Survival analysis ... 30
2.4.1 Survival Outcome ... 31
2.4.2 Kaplan-Meier survival estimate ... 31
2.4.3 Log-rank test ... 32
2.4.4 Cox Proportional Hazards model (CPH) ... 32
2.5 Statistical tests ... 33
2.5.1 Mann-Whitney/Wilcoxon test ... 33
2.5.2 Kruskal-Wallis test ... 34
2.5.3 Pearson’s chi-squared test ... 34
Chapter 3 Analysing existing melanoma gene signatures and devising a new one by clustering of LMC tumours... 36
3.1 Introduction ... 36
3.1.1 Gene expression based cluster analyses in melanoma ... 36
3.1.2 Replication of Lund and TCGA signatures in the whole dataset ... 41
3.2 Methods ... 41
3.2.1 Replicating Lund 4-class and Lund 2-grade signatures in LMC ... 41
3.2.2 The Lund and TCGA signatures association with clinico-histopathological variables ... 42 3.2.3 Lund and TCGA signatures association with melanoma-specific survival
3.2.4 Statistical interaction test between the Lund grade and AJCC stage ... 42
3.2.5 Clustering gene expression data of LMC tumours ... 43
3.2.6 Comparing the HC, KM and PAM based clusters ... 48
3.3 Results ... 48
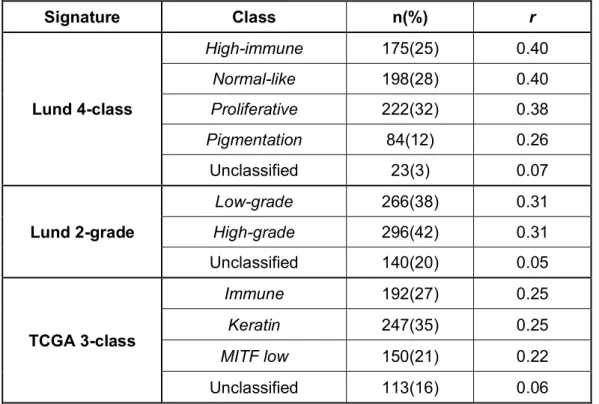
3.3.1 Applying the existing signatures to the whole LMC dataset ... 48
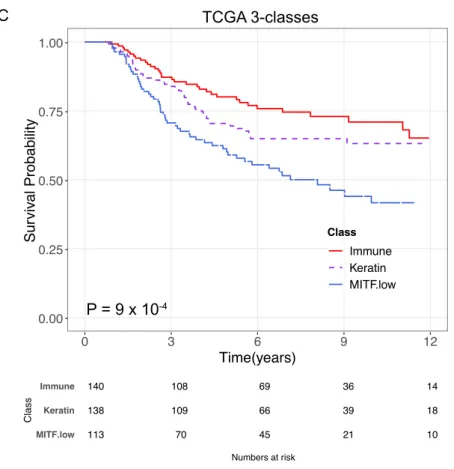
3.3.2 Clinico-histopathological association with the Lund and TCGA signatures 50 3.3.3 Lund and TCGA signatures association with survival in the LMC primary tumours ... 54
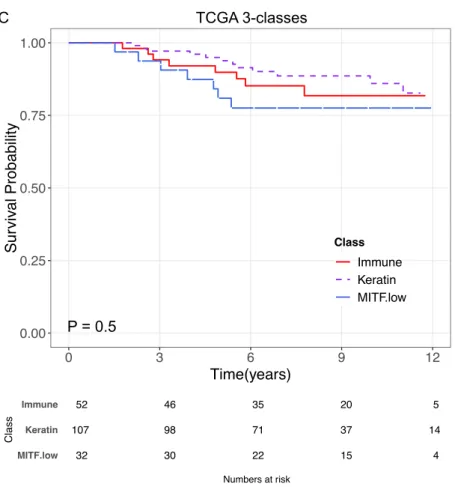
3.3.4 Signature’s prognostic value when stratified on AJCC stage ... 58
3.3.5 Statistical Interaction between the Lund signature and AJCC stage ... 64
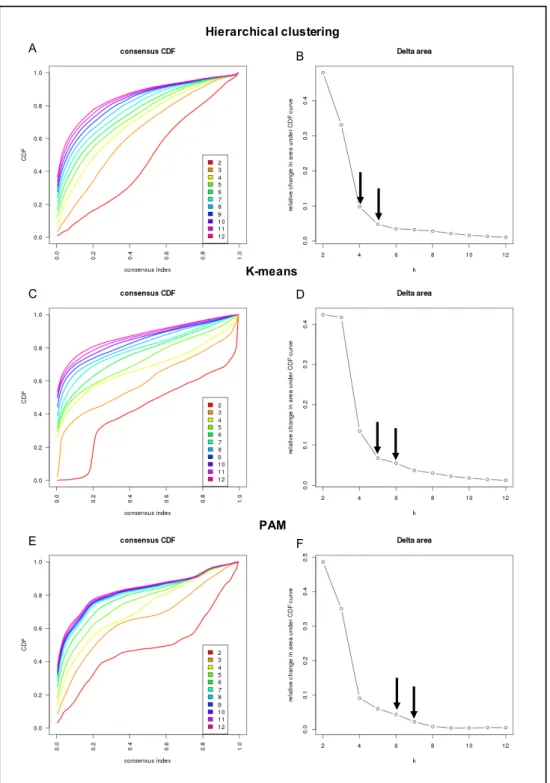
3.3.6 Devising a new signature by consensus-based clustering ... 66
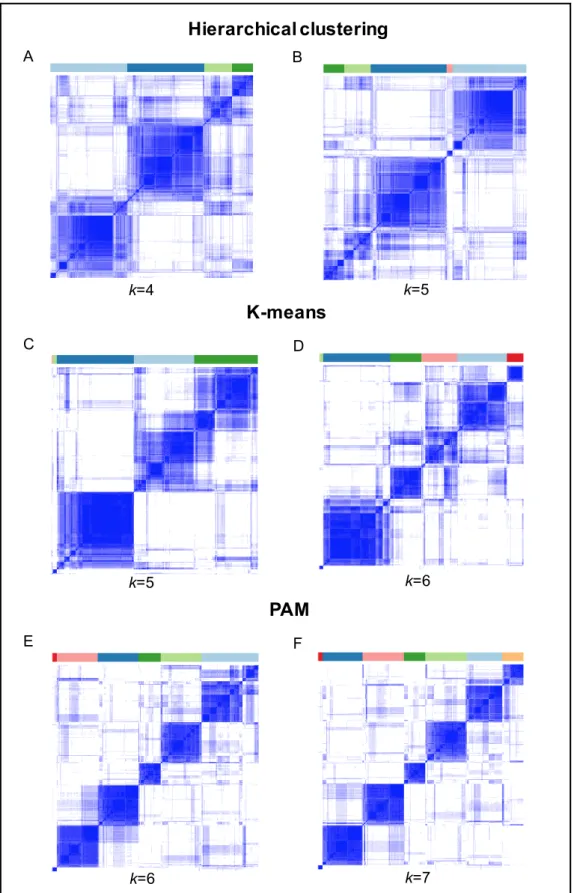
3.3.7 Comparing HC, KM, and PAM based clusters ... 69
3.3.8 Agreement with Lund and TCGA signatures... 71
3.4 Discussion ... 72
3.4.1 The Lund and TCGA signatures were reproducible in the Leeds Melanoma cohort 73 3.4.2 The Lund and TCGA signatures’ lack of association with AJCC stage ... 74
3.4.3 Unsupervised clustering of the LMC dataset ... 74
Chapter 4 Properties of the new tumour classes in primary melanoma: prognostic significance and biological characterisation ... 76
4.1 Introduction ... 76
4.2 Methods ... 77
4.2.1 Identifying LMC classes using a cluster separation measure ... 77
4.2.2 Association of the LMC classes with clinico-histopathological characteristics ... 77
4.2.3 Association of LMC classes with MSS ... 78
4.2.4 Refining the LMC class signature ... 78
4.2.5 Replicating the prognostic value of the LMC signature in the Lund cohort 79 4.2.6 Area under Receiver Operating Characteristic Curve ... 80
4.2.7 Biological significance of LMC classes ... 82
4.2.8 Assessing the Lund module activity in LMC classes ... 85
4.3 Results ... 86
4.3.1 Identifying the number of classes in the LMC dataset ... 86
4.3.2 The LMC class association with clinico-histopathological features ... 91
4.3.3 Prognostic value of the LMC signature ... 93
4.3.4 Comparing LMC signatures with Lund 4-classes and TCGA 3-classes .. 99
4.3.5 Replicating prognostic value of LMC signature ... 100
4.3.6 Biological significance of the LMC classes ... 107
4.4 Discussion ... 116
4.4.1 Clinical-pathological characteristics of the LMC classes ... 116
4.4.2 Prognostic significance of the LMC classes in stage I melanoma ... 117
4.4.3 Biological interpretation of the LMC classes ... 118
Chapter 5 Machine learning applications to predict melanoma prognosis using gene expression ... 120
5.1 Introduction ... 120
5.2 Methods ... 121
5.2.1 Devising a supervised classification framework ... 121
5.2.2 Defining a dichotomous outcome in the LMC ... 121
5.2.3 Creating the training and test sets in LMC ... 122
5.2.4 Prediction performance measures ... 123
5.2.5 Developing classification models using Random Forest (RF) ... 124
5.2.6 Developing classification models using SVM ... 128
5.2.7 Calculating agreement between RF and SVM models ... 134
5.2.8 Generating permutation-based baseline models ... 135
5.3 Results ... 135
5.3.1 Training and test sets in LMC ... 135
5.3.2 RF applications to predict outcome ... 135
5.3.3 SVM applications to predict outcome ... 140
5.3.5 Comparing RF and SVM predictions ... 142
5.3.6 Permutation-based RF model ... 145
5.4 Discussion ... 147
Chapter 6 Combining clinical information and gene expression for predicting outcome and independent validation ... 150
6.1 Introduction ... 150
6.2 Methods ... 151
6.2.1 Using clinical information to generate RF model ... 151
6.2.2 Removing clinical information from the gene expression ... 152
6.2.3 Combining clinical information and gene expression ... 152
6.2.4 Refining the RF model via variable selection ... 153
6.2.5 ROC analysis for the refined RF model ... 155
6.2.6 Application of the refined RF model on independent dataset ... 155
6.2.7 Pathway enrichment of predictor genes in the refined RF model ... 156
6.2.8 Comparison between the LMC classes and the refined RF model predictions ... 156
6.3 Results ... 157
6.3.1 Baseline RF model using clinical information alone ... 157
6.3.2 Prediction after removing clinical information from gene expression ... 157
6.3.3 RF model from combining clinical information and gene expression ... 161
6.3.4 Variable selection to generate the final refined RF model ... 162
6.3.5 ROC analysis of the final refined RF model ... 164
6.3.6 Validating prognostic significance of the refined RF model on Lund dataset 166 6.3.7 Biological interpretation of the refined RF model ... 168
6.3.8 The LMC class association with the refined RF model predictions ... 168
6.4 Discussion ... 170 6.4.1 Prognostic value of clinical information and gene expression based RF models 170
6.4.2 Refining combination of clinical information and gene expression based RF model 171
6.4.3 Prognostic value of refined RF model and validation ... 171
6.4.4 Biological interpretation of the refined RF model ... 172
Chapter 7 Final summary and discussion ... 173
7.1 Summary of the two main aims of this study ... 173
7.2 Context and discussion of findings ... 174
7.2.1 Class discovery using unsupervised clustering ... 175
7.2.2 Class prediction using machine learning ... 178
7.3 Strengths and limitations... 180
7.4 Future perspectives ... 182
List of Tables
Table 1.1 TNM staging of cutaneous melanoma ... 8 Table 1.2 Clinical staging of cutaneous melanoma ... 9 Table 1.3 Summary of studies investigating prognostic signatures of melanoma ... 18 Table 2.1 Summary of clinico-histopathological characteristics of the LMC cohort ... 30 Table 3.1 Summary statistics of the LMC tumour classification using the Lund and TCGA signatures ... 49 Table 3.2 Lund signatures association with clinico-pathological characteristics of LMC primary tumours... 52 Table 3.3 TCGA signatures association with clinico-pathological characteristics of LMC primary tumours... 53 Table 3.4 Unadjusted Cox proportional hazard analysis of the Lund 4-classes.. ... 54 Table 3.5 Unadjusted Cox proportional hazard analysis of the Lund 2-grades… ... 56 Table 3.6 Unadjusted Cox proportional hazard analysis of the TCGA 3-classes….. ... 57 Table 3.7 Unadjusted Cox proportional hazard models for the Lund 4-class, Lund 2-grades and TCGA 3-classes in the AJCC stage I group ... 59 Table 3.8 Unadjusted Cox proportional hazard models for the Lund 4-class, Lund 2-grades and TCGA 3-classes in the AJCC stages II & III ... 62 Table 3.9 Test of interaction between AJCC stage and Lund 2-grade signature in Cox proportional hazards model of MSS ... 65 Table 3.10 Cramer’s V statistic comparing agreement between HC, KM, and PAM derived clusters and the Lund and TCGA signatures ... 72 Table 4.1 Summary of cluster separation measure at various k values ... 87 Table 4.2 Summary of LMC class tumours across the three batches sent for gene expression profiling ... 88 Table 4.3 Summary of cluster separation measure at various k values after removing 15 samples ... 90 Table 4.4 Comparing new classification with initial classification after removing 15 samples ... 90 Table 4.5 LMC classes association with clinico-histopathological variables ... 92 Table 4.6 Summary of the univariable and multivariable analysis of the LMC signature with melanoma-specific survival in the whole LMC dataset ... 94
Table 4.7 Summary of the univariable and multivariable analysis of the LMC
signature with melanoma-specific survival in the AJCC stage I group... 97
Table 4.8 Summary of the univariable analysis of the LMC signature with relapse-free survival and overall survival in the Lund cohort ... 103
Table 4.9 Summary of the univariable analysis of the LMC signature with relapse-free survival and overall survival in the AJCC stage I group of Lund cohort. .. 104
Table 5.1 Life table of patients in LMC for 16-year time interval ... 122
Table 5.2 Comparing histopathological differences between the training and test set ... 136
Table 5.3 Summary of the RF model performance on training and test set ... 138
Table 5.4 Summary of SVM model performance on training and test set ... 140
Table 5.5 Summary of SVM non-linear kernel functions on training and test set ... 141
Table 5.6 Summary of SVM linear kernel model after under sampling the majority class ... 142
Table 5.7 Comparing overlap between RF model and SVM model prediction on test set ... 144
Table 6.1 Refining the RF model by selecting variable number of genes, mTry, and number of trees... 154
Table 6.2 Summary of clinical variable based RF model performance ... 157
Table 6.3 Summary of residual based RF model performance ... 161
Table 6.4 Summary of combined RF model performance ... 161
Table 6.5 Summary performance of RF models generated after selection of genes based on Gini index measure ... 163
Table 6.6 Summary of refined RF model performance on the Lund dataset .... 166
Table 8.1 The 150-gene based LMC 6 class signature... 184
Table 8.2 Summary of upregulated biological pathways in LMC class 1, FDR is the false discovery rate ... 189
Table 8.3 Summary of upregulated biological pathways in LMC class 2, FDR is the false discovery rate ... 191
Table 8.4 Summary of upregulated biological pathways in LMC class 3, FDR is the false discovery rate ... 192
Table 8.5 Summary of upregulated biological pathways in LMC class 4, FDR is the false discovery rate ... 193
Table 8.6 Summary of upregulated biological pathways in LMC class 5, FDR is the false discovery rate ... 193
Table 8.7 Summary of upregulated biological pathways in LMC class 6, FDR is the false discovery rate ... 194
Table 8.8 Summary of downregulated biological pathways in LMC class 1, FDR is the false discovery rate ... 195 Table 8.9 Summary of downregulated biological pathways in LMC class 2, FDR is the false discovery rate ... 196 Table 8.10 Summary of downregulated biological pathways in LMC class 3, FDR is the false discovery rate ... 197 Table 8.11 Summary of downregulated biological pathways in LMC class 4, FDR is the false discovery rate ... 199 Table 8.12 Summary of downregulated biological pathways in LMC class 5, FDR is the false discovery rate ... 201 Table 8.13 Summary of downregulated biological pathways in LMC class 6, FDR is the false discovery rate ... 202 Table 8.14 Gini index value for 200 predictor genes of the refined RF model .. 203
List of Figures
Figure 1.1 Anatomy of human skin ... 1
Figure 1.2 Measurement of tumour thickness across the T stages in the AJCC staging system ... 7
Figure 1.3 Summary steps of a microarray experiment ... 14
Figure 1.4 Melanoma tumour subtypes identified by the Lund group ... 21
Figure 3.1 Comparison of Lund and TCGA melanoma subtypes. ... 40
Figure 3.2 Consensus clustering workflow ... 46
Figure 3.3 Melanoma-specific survival for the Lund 4-classes ... 55
Figure 3.4 Melanoma-specific survival for the Lund 2-grades ... 56
Figure 3.5 Melanoma-specific survival for the TCGA 3-classes ... 58
Figure 3.6 Melanoma-specific survival for the Lund 4-classes, Lund 2-grades and TCGA 3-classes in the AJCC stage I group... 61
Figure 3.7 Melanoma-specific survival for the Lund 4-classes, Lund 2-grades and TCGA 3-classes in the AJCC stages II&III ... 64
Figure 3.8 Sample size and power calculation ... 65
Figure 3.9 Selecting k by examining the relative change in area under the CDF curve ... 67
Figure 3.10 Consensus matrix heatmaps for HC, KM and PAM ... 68
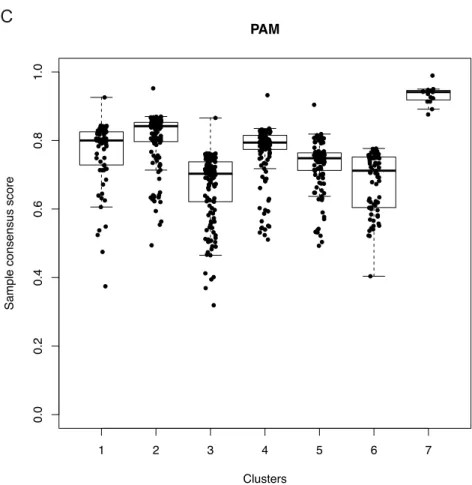
Figure 3.11 Comparing stability of HC, KM and PAM derived clusters ... 71
Figure 4.1 Summary of SAM workflow ... 84
Figure 4.2 Re-clustering of LMC tumours after excluding 15 samples, using consensus clustering PAM method ... 89
Figure 4.3 Melanoma-specific survival for the LMC classes on the whole LMC dataset ... 93
Figure 4.4 Melanoma-specific survival for the LMC classes on the AJCC stage I group ... 96
Figure 4.5 Overlap between the LMC signatures and the Lund 4-classes and TCGA 3-classes ... 99
Figure 4.6 Refining the LMC class gene signature ... 100
Figure 4.7 Relapse-free survival and overall survival for the LMC classes on the Lund dataset... 102
Figure 4.8 Independent prognostic value of the LMC signature ... 106
Figure 4.9 Summary of biological pathways associated with the LMC class 1.. ... 108
Figure 4.10 Summary of biological pathways associated with the LMC class 2 ... 109
Figure 4.11 Summary of biological pathways associated with the LMC class 3
... 110
Figure 4.12 Summary of biological pathways associated with the LMC class 4 ... 111
Figure 4.13 Summary of biological pathways associated with the LMC class 5 ... 112
Figure 4.14 Summary of biological pathways associated with LMC class 6 .... 113
Figure 4.15 Characterising LMC classes using the Lund modules ... 115
Figure 5.1 Summary of supervised classification framework ... 121
Figure 5.2 Summary of reference terms when comparing actual status with predicted status ... 123
Figure 5.3 Workflow of RF algorithm ... 125
Figure 5.4 Example of a RF decision tree. ... 126
Figure 5.5 Maximum margin classifier... 129
Figure 5.6 Polynomial kernel SVM and radial kernel SVM ... 133
Figure 5.7 RF model using unbalanced class design ... 137
Figure 5.8 RF model using balanced class design ... 139
Figure 5.9 Comparing RF and SVM predictions ... 144
Figure 5.10 Performance summary of the permuted model ... 146
Figure 6.1 Gini importance index ... 154
Figure 6.2 Clinical variable based RF model. ... 158
Figure 6.3 Gene expression association with clinical predictors of melanoma. ... 159
Figure 6.4 RF model from adjusted gene expression ... 160
Figure 6.5 Comparison of the refined RF model with baseline RF models ... 165
Figure 6.6 ROC analysis of the RF models in the Lund dataset ... 167
Figure 6.7 Biological interpretation of the refined RF model. ... 168
Abbreviations
ABCDE Asymmetry Border Colour Diameter Evolution
AUC Area Under the Curve
CDF Cumulative Distribution Function
cDNA complementary Deoxy-ribonucleic acid
CPH Cox Proportional Hazards
CSD Chronically Sun Damaged skin
CV Cross Validation
DASL cDNA-mediated Annealing, Selection, extension and Ligation
FDR False Discovery Rate
FFPE Formalin-Fixed Paraffin-Embedded
FN False Negative
FP False Positive
FPF False Positive Fraction
GWAS Genome Wide Association Studies
HC Hierarchical Clustering
KM Kaplan-Meier
LMC Leeds Melanoma Cohort
mRNA messenger Ribonucleic Acid
MSS Melanoma Specific Survival
NCC Nearest Centroid Classification
NGS Next Generation Sequencing
NPV Negative Predictive Value
ONS Office of National Statistics
OOB Out Of Bag
PAM Partitioning Around Medoids
PCR Polymerase Chain Reaction
RF Random Forest
RGP Radical Growth Phase
RNA Ribonucleic Acid
ROC Receiver Operating Characteristic
RSN Robust Spline Normalisation
SVM Support Vector Machine
TCGA The Cancer Genome Atlas
TILS Tumour Infiltrating Lymphocytes
TMA Tissue Microarray Needle
TN True Negative
TP True Positive
TPF True Positive Fraction
UVR Ultra Violet Radiations
Chapter 1
Introduction
This chapter provides an introduction to melanoma research by presenting an overview of melanoma formation, epidemiology and genetics. This is followed by different methods of classification: histopathological, genomic and transcriptomic.
1.1 Human skin and melanoma
Human skin, the largest organ of the human body, is not directly thought of as a functional organ like the heart or the liver, but is simply believed to just protect us from external stimuli, like extreme hot or cold temperatures [1]. However it plays a unique and complex role in maintaining a barrier between internal and external environment, and in maintaining the steady state of internal body (homeostasis) in terms of heat and hydration [1, 2].
Figure 1.1 Anatomy of human skin Adapted from [2].
Human skin is arranged into three layers: epidermis (outer layer), dermis (inner layer) and hypodermis (inner most layer) (Figure 1.1). The epidermis can be further divided into an outer ‘dead’ layer and an inner ‘living’ cell layer [2]. The outer layer contains all the dead and peeling cells, and its major function is to maintain a barrier against
microbes and other environmental factors. The inner layer contains a higher proportion of keratinocytes (up to 90%) and lower proportion (up to 10%) of other cell types known as melanocytes, Merkel cells and Langerhans cells [2]. The main function of the inner layer is to help in the formation of the main barrier, which protects against invasion of chemical substances and microbes. The majority of skin cancers originate in the epidermis [3]. Melanoma, the most aggressive form of skin cancer, originates from melanocytes or their precursor cells, melanoblasts, which are mainly present in the epidermis.
1.1.1 Melanocytes
In 1889, S. Meyerson first introduced the term ‘melanocyte’ to represent a dendritic cell which originates from the neural crest [4]. As described above, melanocytes are small subpopulations of cells located in the inner layer of the epidermis. A melanoblast is a precursor cell of melanocytes, and it is derived from the neural crest cells [4]. The melanoblasts differentiate from the neural crest cells and migrate extensively during embryonic development [1, 2]. Once melanoblasts have reached their terminal locations, most of these cells then differentiate into melanocytes. The process of differentiation from neural crest cell to becoming a melanocyte completes within the first 6 months of the gestation period [1, 2]. Most of the melanocytes migrate from dermis to epidermis and produce a pigment known as melanin.
1.1.2 Melanin, melanogenesis and response to UVR
After a melanocyte has been formed, it starts producing an organelle known as the melanosome [4]. Melanosomes are the organelles that produce a pigment known as melanin. The variation in human skin colour is primarily due to variations in melanin. Melanin is classified into two types: eumelanin and pheomelanin [5, 6]. Eumelanin, a major source of pigmentation, is a high density dark pigment which is contained in eumelanosomes. Pheomelanin is a cysteine-derived compound which is reddish/yellow in colour that is largely responsible for the colour of red hair.
The biological process of melanin synthesis is known as melanogenesis. After melanoblasts have differentiated into melanocytes, the melanosome formation is initiated. During melanogenesis, tyrosinase and tyrosinase-related proteins 1 and 2 (TRP1 and TRP2) catalyse the synthesis of melanin [6]. After producing melanin, it is transferred to keratinocytes, where melanin plays an important role in protecting the skin from harmful ultraviolet radiation (UVR) [6]. Generally, in humans, one melanocyte is in contact with ~35 neighbouring keratinocytes [7]. Melanin is
transferred to keratinocytes located on the inner layer of the epidermis, and it is degraded before keratinocytes migrate to the outer dead layer [6].
UVR exposure increases melanin production, which causes tanning of the skin [4-6]. A sudden increase in pigmentation in response to UVR, also referred to as immediate tanning, is achieved by darkening and shifting pre-existing melanosomes from the nuclear region to the dendritic region. Delayed tanning is caused by a gradual increase in production of melanin (i.e. eumelanin) over 2-3 weeks after UVR exposure. Overall, in both immediate and delayed tanning, a pigment is produced that protects the skin from UVR. In pale skin, melanin levels increase by 500 to 1000 fold, in comparison to dark skin where the levels only increase by 10 to 15 fold [8, 9].
1.1.3 Melanocytes to melanoma
The transition from melanocyte to the most readily recognisable form of melanoma, i.e. superficial spreading melanoma, occurs in five different phases as follows: benign naevi; dysplastic naevi; radial growth phase (RGP); vertical growth phase (VGP); metastatic melanoma [3]. This superficial spreading melanoma is typified by change in shape, size and colour and is the commonest form of melanoma in pale-skinned populations. As described above, many superficial spreading melanomas originate in naevi, although some melanoma may arise de novo from normal skin.
Benign naevi are the normal moles present on the skin: they are benign proliferations of melanocytes such that the proliferation step is self-limiting. A small proportion of these benign naevi undergo continued cellular proliferation which leads to formation of an asymmetric dysplastic (or atypical) naevus. Even though the majority of such naevi eventually cease, a proportion of them emerge into RGP melanoma. In RGP, the cells contained in the epidermis invade the outer dermis layer. In VGP, the malignant cells invade further into the inner dermis and subcutaneous fat layers. The melanoma at this stage has a high metastatic potential and can metastasize to distant organs. In the metastatic phase, the melanoma metastasizes both by lymphatics (probably the most frequent) but also via the blood vessels and then subsequently to different organs in the human body, such as the lungs, liver or brain [3].
1.2 Cutaneous melanoma
Melanoma is a cancer that arises from genetic changes in melanocytes and melanoblasts leading to an uncontrolled growth of these cells. Melanoma occurs most frequently on the skin, also referred as cutaneous melanoma, but also on body sites such as the uvea of the eye, mucosa, and leptomeninges. Although cutaneous
melanoma represents only 5% of skin cancer cases but it accounts for 80% of skin cancer related mortality [3].
Cutaneous melanoma most commonly presents as a mole in clinical settings, and initial diagnosis is based on the ABCDE criteria, where A stands for asymmetrical nevi, B for irregular border, C for multiple colours, D for diameter >5mm, and E for evolving shape and size [10]. Melanoma is further divided based on these criteria into four distinct subtypes: superficial spreading melanoma, nodular melanoma, lentigo maligna melanoma, and acral lentiginous melanoma [11]. Superficial spreading melanoma is the most common melanoma subtype and accounts for ~70-75% of melanoma cases; it occurs mostly on the limbs and trunk of the body [11]. The ABCDE criteria best describe this sort of melanoma. Nodular melanoma accounts for ~20-25% of melanoma cases and can appear on any body site, including the sites mentioned for superficial spreading melanoma [11]. Lentigo maligna melanoma is the least frequent melanoma and accounts only for ~5-10% of melanoma cases [11]. It occurs mostly at older age and, unlike previous subtypes, it does not originate from an existing naevus but occurs as a result of prolonged sun exposure. The previous three melanoma subtypes are mostly observed in the Caucasian population. However, the fourth subtype, acral lentiginous melanoma, is rarely observed in this population, and the majority of cases are individuals with darker skin; it occurs mostly on non-sun exposed sites, such as feet, finger nail beds, and toes [11].
1.3 Melanoma epidemiology
Cutaneous melanoma is the 5th most common form of cancer in the UK and is ranked 19th worldwide [12, 13]. In the last 50 years, the world wide incidence of melanoma has risen sharply, with greatest incidence observed in pale-skinned populations. In the UK, the incidence rates have increased by 50% over the last decade [13], and males have had a higher increase (64%) in the incidence rate in comparison to females (39%). Across Europe, approximately 100,000 new cases of melanoma were diagnosed in 2012, and the incidence rate in the UK was ranked 9th in Europe [14]. In the UK, every year (2012-2014) ~15,000 patients are diagnosed with melanoma [13]. Melanoma is predominantly an adult cancer with very few cases prior to puberty. The risk factors for melanoma are a history of severe sunburn, a higher number of dysplastic naevi, older age, family history of melanoma, pale skin, and light hair colour [15-19]. A pooled analysis of 15 case-control studies showed that sun exposure increases melanoma risk [18]. This study provides stronger evidence for intermittent sun exposure than cumulative sun exposure [18], but a so-called UVR
signature, i.e. C>T somatic mutations in the tumour [16], implicates sun exposure as the major environmental factor in pathogenesis. Along with sun exposure, greater numbers of melanocytic naevi, also known as “moles”, increases melanoma risk, and individuals with ≥ 100 moles have 7 fold increased risk of melanoma in comparison to individuals with <100 moles. Along with melanocytic naevi, the presence of dysplastic naevi further increases melanoma risk [17]. Age is an important risk factor for melanoma, and growing old increases the relative risk of melanoma [16, 19]. Family history of melanoma increases the risk 2 fold [16, 17]. A systematic review of 10 case-control studies showed that hair colour predicts melanoma risk, as blond hair individuals had 1.8 fold increased risk, red hair individuals had 2.4 fold increased risk in comparison to black and dark brown hair individuals [20]. A recent study of a Norwegian-Swedish cohort reported consistent findings, as red haired, blond haired and brown haired individuals had increased risk of melanoma in comparison to dark brown and black haired individuals [21].
1.4 Melanoma genetics
A family history of melanoma is reported in approximately 8% of melanoma cases [16]. In families with 3 or more cases, almost 40% of cases carry a germline mutation in the cyclin-dependent kinase inhibitor 2A (CDKN2A) gene [16, 22-25]. Linkage studies of melanoma have also identified other high penetrance genes such as
CDK4, BAP1, POT1, and TERT [26-31]. GenoMEL, a consortium of familial melanoma research, led one of the biggest studies to examine these mutations and reported that these mutations characterise only a proportion of melanoma families, and mutations in more than 50% of families remain unexplained [25].
Completion of the Human Genome Project has enabled development of cost effective genome-wide genotyping technologies. In addition to the previous linkage-based studies used to identify highly penetrant susceptibility genes, genome-wide association analysis studies (GWAS) have further characterised the genetic architecture of melanoma by identifying genes with intermediate and low penetrance. Several GWAS have identified a total of 20 loci associated with different melanoma phenotypes (physical characteristics associated with melanoma), such as pigmentation phenotypes, naevi in the skin and telomere length [32-39]. The variants mapping to the CDKN2A/MTAP, PLA2G6 and IRF4 regions were associated with development of naevi. The variants mapping to the MC1R, ASIP, OCA2, SLC45A2
and TYR regions were observed to be associated with pigmentation phenotypes such as hair colour and eye colour. Variants in the TERT, PARP1, ATM and OBFC1
mapping to the CCND1, RMDN2, CDKAL1, ARG3, TMEM38B, ARNT1, MX2, and
CASP8 regions were not associated with any specific melanoma phenotype despite being strongly associated with increased melanoma risk.
1.5 Melanoma histopathological classification, prognostic
factors and survival
Melanoma has the highest mortality rate among the skin cancers, but if detected early, the majority of the patients survive for more than 10 years [40]. In clinical settings the initial diagnosis of melanoma is made using visual examination of the mole with the naked eye and then using a magnifying system (dermoscopy). Suspicious moles are then removed by performing a surgical excision [10, 11]. Several histopathological factors of melanoma and host factors (site, sex and age) have been shown to be determinants of melanoma prognosis [41-43]. After clinical diagnosis of melanoma, the extent (stage) of cancer is decided based on histopathological classification described in the AJCC (American Joint Committee on Cancer) staging system [44].
1.5.4 AJCC staging system
The final version of the 7th edition of the AJCC staging system classifies melanoma tumours using TNM staging, where T is primary tumour characteristics, N is the number of regional lymph nodes and M is metastasis of tumours to distinct organs [44]. The T staging is based on three main histopathological factors as follows: Breslow thickness, mitotic rate and ulceration status of tumours.
Mitotic rate provides an estimate of the proliferation rate of cells [45] and is defined as the number of tumour cell divisions per square millimetres (mm) of the tissue slide. An increase in mitotic rate significantly reduces survival time [44]. In primary melanoma, mitotic rate has been identified as an independent predictor of poor prognosis in thin melanomas (stage I, Table 1.1, Table 1.2). The proposed threshold for mitotic rate is <1 /mm2 or ≥1 /mm2, classifying patients into T1a and T1b stages respectively (Table 1.1, Table 1.2). Several studies have shown an association of mitotic rate with poor prognosis in thicker melanomas as well, but when jointly analysed with other clinical predictors, mitotic rate did not reach the significance threshold. Therefore, mitotic rate was not included in the AJCC classification of thicker melanomas [44, 46, 47]. In fact, mitotic rate has been dropped in the 8th edition [48] but this system is only now being applied, and therefore in this study the 7th Edition was used [44].
Breslow thickness is a well-established, independent prognostic factor for melanoma which is used in TNM staging of primary tumours [44, 45, 47, 49, 50]. Breslow thickness measures the thickness of the tumour in mm from the surface of the skin (granular cell layer) to the deepest part of the tumour (Figure 1.2). As shown in Table 1.1 Breslow thickness is divided into four categories in the AJCC staging system, as: ≤1mm, 1.01-2.0mm, 2.01-4.0mm, >4.0mm, and these categories classify primary tumours in T1, T2, T3, and T4 stages respectively. The recently published 8th edition of the AJCC staging system [51] uses ≤0.8 mm as a cut-off for T1 stage, in comparison to the previous ≤1.0mm cut-off [48].
Ulceration status of the tumour is another prognostic indicator used in TNM classification and has been identified as an independent predictor of prognosis when jointly analysed with other clinical predictors of melanoma [44, 52]. The presence of ulceration increases the T stage (Table 1.1), and ulceration of the tumour also confers an increased risk of metastasis in comparison to non-ulceration. However, the detection of ulceration is associated with some interobserver variation, and several attempts has been made to standardise this variable [53].
The advanced stage classification (AJCC stage IV) utilises additional information from N and M stages which are based on detection of regional lymph node metastases, distant organ metastases and lactate dehydrogenase levels respectively (Table 1.1, Table 1.2) [44].
Figure 1.2 Measurement of tumour thickness across the T stages in the AJCC staging system
Table 1.1 TNM staging of cutaneous melanoma Adapted from Balch et al. [44].
Primary Tumour Characteristics
T stage T1
T1a: ≤ 1.0 mm in thickness without ulceration, mitoses < 1/mm2
T1b: ≤ 1.0 mm in thickness with ulceration or mitoses ≥ 1/mm2 T2 T2a: 1.01-2.0 mm in thickness without ulceration
T2b: 1.01-2.0 mm in thickness with ulceration T3 T3a: 2.01-4.0 mm in thickness without ulceration
T3b: 2.01-4.0 mm in thickness with ulceration T4 T4a: >4.0 mm in thickness without ulceration
T4b: >4.0 mm in thickness with ulceration Regional Lymph Nodes (N)
N stage
N0 No regional metastases detected
N1 N1a: Micrometastases in one lymph node N2b: Micrometastases in one lymph node
N2
N2a: Micrometastases in 2-3 lymph nodes N2b: Micrometastases in 2-3 lymph nodes
N2c: In-transit metastases/satellites without metastatic lymph nodes
N3 ≥ 4 metastatic lymph nodes, or matted lymph nodes, or in-transit metastases/ satellites with metastatic lymph node (s) Distant metastases (M)
M stage
M0 No evidence of distant metastases
M1a Metastases to the skin, subcutaneous tissue, or distant lymph nodes, normal serum lactate dehydrogenase (LDH) level M1b Lung metastases, normal LDH level
Table 1.2 Clinical staging of cutaneous melanoma
Adapted from Balch et al. [44]. See Table 1.1. for definition of the TNM stages.
Staging T N M Stage I IA T1a N0 M0 IB T1b T2a N0 N0 M0 M0 Stage II IIA T2b T3a N0 N0 M0 M0 IIB T3b T4a N0 N0 M0 M0 IIC T4b N0 M0
Stage III Any T N>N0 M0
Stage IV Any T Any N M1
1.5.5 Prognostic factors in primary melanoma
As described before, histopathological factors such as tumour thickness, ulceration and mitotic rate were determined to be strong independent prognostic factors in melanoma and have been included in the calculation of the AJCC staging system [44]. Host factors such as sex, age at diagnosis and site of melanoma have also shown strong association with melanoma prognosis after adjusting for the histopathological factors of melanoma.
Sex is a well-known predictor of melanoma prognosis with males being consistently identified as a poor prognostic group in comparison to females [55, 56]. However, the underlying biological reasons to explain the survival advantage for women are still not clear. It was also reported that men have increased propensity to develop metastases and have higher mutation burden in their metastases in comparison to females [57]. The 5 year survival for males is around 70% and for females it is around 82% [13].
Age at diagnosis predicts poor prognosis, with the age group >70 years having the poorest prognosis [58]; this group also has a lower rate of sentinel lymph node positivity, which may imply that the poor prognosis of this group is due to the high morbidity [59, 60], or because of blood borne metastases which are more common
in older patients. Furthermore, older patients are less likely to have a strong immune system, leading to poor ability to mount an appropriate anti-tumour response [61]. The site of melanoma is another strong prognostic factor for melanoma. The site of primary melanoma is usually classified as limbs, head and neck, trunk, and other rare sites on the body, e.g. on genital skin or the sole of the foot. Melanoma occurring on the trunk has a worse prognosis in comparison to melanoma on the limbs or head and neck [62]. Melanoma most commonly occurs on the trunk and lower limbs for males and females respectively [13].
The other relevant histopathological features of melanoma that are not included in the AJCC staging system are tumour infiltrating lymphocytes (TILs), the presence of vascular or lymphatic invasion and the presence of tumour regression. The histopathological classification of tumours based on TILs was developed by Clark et al., and it quantifies presence of immune cell populations surrounding and infiltrating the tumour [63]. Clark et al. categorised TILs as absent (when no lymphocyte aggregation is detected), non-brisk (presence of few lymphocytes) and brisk (when the lymphocyte population is large and lymphocytes have surrounded the tumour). The TILs classification has been shown to predict melanoma prognosis, with brisk TILs predicting good prognosis and the absence of TILs predicting the worst prognosis, independent of age, sex, tumour site, and the AJCC staging system [63, 64] [65]. Vascular or lymphatic invasion is the presence of tumour cells in blood vessels, which has been shown to be associated with a higher Breslow thickness, ulceration of the tumour, mitotic rate and a nodular melanoma subtype; furthermore it predicts poor prognosis [66-68]. Tumour regression is the disappearance of tumour cells, most likely as a consequence of interactions between the tumour cells and immune cells leading to replacement of the tumour tissue with non-malignant tissue [69-71]. A few studies have shown that tumour regression predicts prognosis in thin melanomas and is associated with other clinical prognostic variables such as sex, older age at diagnosis, head and neck or trunk site of melanoma [69, 70, 72]. However other studies have found no evidence to indicate that regression influences survival [73, 74].
1.5.6 Melanoma survival based on the AJCC stage
In the UK, the 5-year survival rate for patients diagnosed with melanoma is more than 95% for AJCC stage I [40]. The survival rate decreases by ~20% for the patients diagnosed at AJCC stage II [40]. The survival for AJCC stage III patients is 50%; at this stage the tumour has reached the lymph nodes. The survival further drops down
to 15-17% for AJCC stage IV melanoma [40]. At stage IV, the tumour has already
metastasized to different organs in the body.
1.6 Genomic classification of melanoma
The AJCC staging system is a powerful tool for predicting melanoma prognosis, but it only considers the pathological state of the tumour and does not include the genomic changes that contribute to driving tumour progression. Advances in cost-effective DNA microarray and next-generation sequencing technologies have paved the way to discovery of biomarkers predicting disease outcome or response to treatment. These technologies have been broadly applied to detect changes in the tumour DNA to help in characterising the genomic landscape of melanoma.
1.6.1 Mutational subtypes of melanoma
BRAF and NRAS oncogenes have been identified as the most commonly mutated genes in melanoma [75-78]. Mutations in these genes are effectively mutually exclusive [79], and both activate the Mitogen-Activated Protein Kinase (MAPK) pathway [80]. In 2015, a study by The Cancer Genome Atlas consortium (TCGA) identified four mutation subtypes in a cohort predominantly of metastatic melanoma tumours [81]. The four mutation subtypes were named as BRAF, RAS, NF1 and triple wild type mutant groups. In this study, among 318 tumours, 52% (n=166) harboured a BRAF mutation, with 144 tumours specifically having a BRAFV600E mutation. The
RAS subtype tumours harboured mutations mainly in NRAS (28%), and only a few tumours had mutation in other RAS-family member genes such KRAS and HRAS. Fourteen percent of tumours harboured NF1 mutation, classified as the NF1 subtype. The triple-wild type group contained a heterogeneous group of tumours harbouring mutations in different genes and was characterised based on the lack of mutation in
BRAF, NRAS and NF1 [81].
Melanoma when classified based on body site showed different mutation patterns on chronically sun-damaged skin (CSD) in comparison to non-chronically sun damaged skin (non-CSD) sites [82]. Early stage tumours of the CSD class harboured NF1,
BRAF, NRAS or KIT mutations in the tumour, and the non-CSD class harboured only
BRAF mutations [83-85]. In both groups, metastatic stage melanomas harboured somatic mutations in genes associated with key signalling pathways relating to cell proliferation (NRAS, BRAF, NF1), cell growth (PTEN and KIT), cell identity (ARID2), resistance to apoptosis (TP53) and cell cycle control (CDKN2A) [86, 87].
A study led by Shain et al. showed that mutation in the BRAF gene is acquired at an early stage when the tumour is benign [88]. Mutation in the NRAS gene is a characteristic feature of intermediate stage, along with mutations in other genes such as TERT and PPP6C. Overall, the sequence of mutations that lead to melanoma initiation are still unclear because different individuals harbour different mutations which lead to activation of different pathways. This supports the view that there are several biological routes to melanoma progression, and only a few of them are highlighted by these analyses [86]. The research on melanoma genomes continues with an expectation that understanding of disease biology and routes of melanoma progression can be improved by examining other data types such as copy number alterations, gene expression, and methylation status of the tumours.
1.6.2 Somatic copy number association with mutational subtypes
In melanoma, genomic regions associated with genes such as CCND1, KIT, CDK4,TERT and MITF are frequently amplified, and regions associated with CDKN2A,
PTEN are frequently deleted [86]. The level of amplifications and deletions are a measure to estimate whether regions of the genome are duplicated or deleted during cell replication. In the TCGA study, analyses testing the association between the mutational subtypes and copy number alterations revealed that the BRAF mutational subtype had significantly higher copy number gains in BRAF, MITF and PD-1, PDL-1 genomic regions of the tumour DNA than other mutational subtypes. The NRAS
subtype had significantly more copy number gains in the NRAS genomic region in comparison to other mutational subtypes. The NF1 subtype had significantly higher deletions in the PTPRD region. The triple-wild type mutational subtype had amplifications in KIT, PDGFRA, KDR, CDK4, CCND1 and MDM2 regions. Overall, the amplifications in CCND1 and TERT, and deletions in CDKN2A and PTEN
genomic regions were observed across all the mutational subtypes, suggesting that these copy number alterations are an intrinsic characteristic of metastatic melanoma tumours [81].
1.7 Gene expression profiling technologies
Gene expression is a process by which the genetic code or the nucleotide sequence of a gene is used in the synthesis of a functional gene product during transcription. Expression profiling at whole genome level is achieved using DNA microarray or RNA-sequencing technologies.
1.7.1 DNA microarrays
Microarray based gene expression profiling captures the molecular state of the cell by quantifying expression of thousands of genes simultaneously (Figure 1.3) [89-91]. In this high throughput technique, mRNA extracted from tissues samples is further amplified using PCR (Polymerase Chain Reaction), and then reverse transcribed into cDNA using reverse transcriptase enzyme (Figure 1.3). The cDNA sequences are stained using a fluorescent dye. As a next step, the stained cDNA sequences are hybridised to the unique short fragments of single stranded DNA bound to the plates, known as probes. After the hybridisation step, the plates are washed to retain the strong probe-cDNA binding sequences. The fluorescently labelled cDNA bound to a probe generates a signal, and the intensity of signal provides an estimate of the gene expression (Figure 1.3). There exist two main techniques for DNA microarray: oligonucleotide microarray and cDNA microarray. The oligonucleotide microarray uses short probe sequences which are 25 to 70 bases in length, and the cDNA microarray used probes of 200 to 2000 bases in length [89].
Gene expression profiling of disease using tissue specimens (such as blood, fresh tumour or archived Formalin Fixed Paraffin Embedded (FFPE) tumour) can lead to the discovery of biomarkers with prognostic potential that go beyond the histopathological classification [92]. Extracting RNA from FFPE samples stored over a long time yields low-quantity RNA, and analysing it is difficult because formalin fixation leads to crosslinking of RNA with proteins and causes nucleic acid to fragment [93]. To overcome these problems Fan et al. developed a gene expression assay known as DASLâ (cDNA mediated Annealing, Selection, extension and Ligation) [94], which had locus specific probes designed for probe-cDNA hybridisation. The limitation of this assay was the limited number of probes, but introduction of a whole-genome DASLâ assay has allowed profiling of approx. 29000 transcripts [92]. The RNA from the frozen FFPE samples is partially degraded but studies have shown that transcriptome signature based disease subtyping is still feasible using this technique [92, 95].
1.7.2 RNA-sequencing
RNA-sequencing (RNA-seq) is a another widely used technique for gene expression profiling which is based on next-generation sequencing (NGS) [96, 97]. In this technique, the mRNA extracted from the tissue sample is annealed to oligo-dT magnetic beads, and then a fragmentation agent is added to generate multiple fragments of mRNA. The fragments are reverse transcribed into single stranded
cDNA sequences. The opposite strands of cDNA are synthesized, and the resultant product is a double stranded cDNA. The double stranded cDNA sequences are end-repaired, ligated to adaptors, and PCR amplified to generate a library that is ready for sequencing. The sequences in the library are then sequenced using a NGS platform, and reads of ~30-500 bases long are generated. The reads are then aligned to a reference genome to produce a genome-wide transcriptional state which determines the level of expression for each gene [96, 97].
Figure 1.3 Summary steps of a microarray experiment Adapted from [98].
Malone et al. compared DNA microarray and RNA-sequencing technologies and reported that both the technologies had a comparable performance and provided a reliable estimate of gene expression [99]. Both the technologies showed poor performance in detecting genes with low expression. RNA-seq has an advantage over DNA microarrays as one can study a lot of other characteristics (e.g. splicing, gene/isoforms, gene fusions, structural variations) apart from studying gene expression. The limitation of RNA-seq is that it is an expensive and more time-consuming technology than DNA microarrays [99].
Along with the advantages of high-throughput profiling techniques come various challenges: how to deal with the variability due to the use of different platforms, variability due to heterogeneous sources of material, and different ways of analysing the data.
1.8 Gene expression based classification of melanoma
Previously, numerous studies have used supervised and unsupervised classification approaches to generate gene expression-based signatures which predict melanoma tumour outcome (Table 1.3) [84, 100-109]. The unsupervised classification approach identifies novel subgroups by exploring distinct patterns in the dataset. The supervised classification, including machine learning, on the other hand mine the knowledge from known subgroups or outcomes and develop prediction models to classify new observations into these groups [110-112].
1.8.1 Supervised classification using gene expression
In 2006, Winnepenninckx et al. published the first study (Table 1.3) that analysed the gene expression data from primary melanoma tumours and generated a 254 gene-based signature predictive of metastasis free survival for 4 years (Agilent oligonucleotide microarray) [100]. When comparing the prediction performance of this signature with histopathological factors like tumour stage based on TNM staging, the signature misclassified 29% of samples in comparison to 28% misclassification when using histopathological factors alone. Overall the gene signature had similar prognostic value in comparison to the histopathological factors [100].
In 2007, Alonso et al. analysed the gene expression data from 34 vertical growth melanomas with every patient followed for at least 36 months (OncoChip DNA microarray) (Table 1.3) [101] . The study compared the patients who developed nodal metastases (n=21) with those who did not (n=13) and generated a 243 gene-based signature that predicted risk of metastasis. The biological pathway enrichment
analyses revealed that genes in the signature were associated with the epithelial-mesenchymal transition pathway, and these findings were further confirmed in an independent dataset [101].
In 2008, John et al. performed molecular profiling of 29 patients diagnosed at AJCC stages IIIB and IIIC with clinical outcome defined as melanoma progression in 2 years (oligonucleotide microarray) (Table 1.3) [102]. Thirteen patients did not experience disease progression in 2 years whereas 16 patients experienced disease progression. Comparing gene expression differences between the two groups identified 21 genes, which were experimentally validated and used to generate a predictive risk score. This score was applied on two independent datasets, and it accurately predicted outcome in 90% and 85% of patients respectively [102]. In 2009, Bogunovic et al. analysed gene expression data, mitotic rate and TILs from 38 melanomas to explore the molecular basis for metastasis and to generate biomarkers of melanoma survival (Affymetrix Human Genome microarray) (Table 1.3) [103]. Comparing gene expression differences between patients with prolonged survival and patients with short survival led to the generation of a 266 gene-based signature. For the 266 genes, pathway enrichment analysis revealed that immune response related genes were enriched in the good prognosis groups and cell proliferation related genes were enriched in the poor prognosis group. The prognostic value of the gene signature was validated in an independent dataset of comparatively similar size [103].
Conway et al. (former PhD student in the Leeds research group) performed gene expression profiling using archived FFPE tumour blocks of 254 melanoma patients (part of Leeds Melanoma Cohort described in chapter 2) diagnosed at AJCC stages I, II, and III (DASL microarray cancer chip based on 502 genes) (Table 1.3) [104]. Increased expression of the Osteopontin gene (SPP1) was identified as a prognostic biomarker predicting relapse-free survival in the training set. When jointly analysed with other clinico-histopathological factors of melanoma in a multivariable analysis, this gene remained a significant predictor of relapse-free survival. The prognostic significance of this gene was validated in an independent dataset (n=218). A follow up study in 2010 by Jewell et al. (another PhD student in the group) jointly analysed the two datasets analysed in Conway et al. (n=472) and identified that genes associated with DNA repair mechanisms as significant predictors of relapse-free survival [113]. The increased expression of DNA repair mechanism genes in progressive tumours supported the view that melanoma progression requires genetic stability.
In 2013, Mann et al. analysed the mutational and gene expression data generated from 73 melanoma patients diagnosed at AJCC stage III and identified a 46 gene-based signature that predicted outcome (Expression BeadChips microarray) (Table 1.3) [84]. Pathway enrichment analysis revealed overrepresentation of immune response mechanisms. The gene signature showed independent prognostic value when jointly analysed with clinico-pathological variables. The prognostic value of the signatures was validated in two previously published cohorts of AJCC stage III melanoma. The study concluded that BRAF and NRAF mutation, along with absence of immune related gene expression, is associated with poor prognosis in stage III melanoma [84].
In 2015, Gerami et al. analysed the differences between primary and metastatic melanoma tumours using available gene expression datasets and selected the 28 most discriminatory genes (Table 1.3) [109]. These 28 genes were used to developed a classification model to predict risk of metastasis using training set observations (n=164). When applying the classification model to the validation set (n=104), the model robustly predicted risk of metastasis (area under Receiver Operating Characteristic (ROC) curve =0.91) [109].
In 2018, Brunner et al. developed a classification model that predicted Melanoma-Specific Survival (MSS) based on expression values of 8 genes (Table 1.3) [108]. The classification model was developed using tumours in the training set (n=125) and was validated on the tumours in the test set (n=211). Both the sets were a mixture of primary tumours from AJCC stages I, II and III. The generated classification model significantly predicted MSS in both the training set and the test set observations. When the gene signature was jointly analysed with the AJCC staging system, the area under the ROC predicting MSS increased by 4% in the training set and 6% in the test set when compared to the AJCC staging system alone [108].
Table 1.3 Summary of studies investigating prognostic signatures of melanoma
Study Cohort Outcome Gene signature and prognostic performance
Winnepenninckx et al.
(2006) [100]
38 AJCC stage I-IV melanoma tumours
≥ 4 years distant metastasis-free survival versus < 4 year distant metastasis free survival
259 gene-based signature, signature
misclassified 29% cases and histopathological variables misclassified 28% cases
Alonso et al. (2007) [101]
34 vertical phase melanoma tumours (21 with metastasis and 13 without)
Metastasis versus without metastasis
243 gene-based signature, only 3 genes were validated and showed association with survival
John et al. (2008) [102] 29 AJCC stage III and stage IV melanoma tumours
≥2 years to tumour progression versus <2 years to tumour progression
21 gene-based signature, no prognostic impact shown
Bogunovic et al. (2009) [103] 38 AJCC stage III and stage IV melanoma tumours
≥ 1.5 years of survival versus <1.5 years of survival
266 gene-based signature, independent prognostic indicator of survival when jointly analysed with mitotic rate and TNM stage Conway et al. (2009) [104] 254 primary melanoma AJCC
stage I-III
Relapse free survival and overall survival
1 gene, Osteopontin (SPP1) expression, gene expression did not maintain significance in the validation set
Jonsson et al. (2010) [106] 57 AJCC stage IV melanoma tumours
Overall survival difference in four groups
503 gene-based signature, strong association with overall survival in four groups and
association of increased immune response with good prognosis.
Study Cohort Outcome Gene signature and prognostic performance
Harbst et al. (2012) [105] 223 AJCC stage I and stage II melanoma tumours
Overall survival (OS) and relapse-free survival (RFS) difference in two groups
1864 gene-based signature, strong association with OS and RFS in two groups. Association of increased immune response with good prognosis
Mann et al. (2013) [84] 79 AJCC stage III melanoma tumours
<1 year survival versus survival > 4 years post-surgery
46 gene-based signature, strong over
representation of immune response gene with good prognosis
The Cancer Genome Atlas Network (2015) [81]
331 primary and metastatic melanomas, AJCC stage I-IV
Overall survival difference between three groups
1500 gene-based signature, increased immune gene expression predicted good prognosis
Gerami et al. (2015) [109] 268 AJCC stage I-III
melanoma tumours Risk of metastasis
28 gene-based signature predicted risk of metastasis in the training and validation cohorts
Brunner et al. (2018) [108] 336 AJCC I-III melanoma tumours
Melanoma-specific survival (MSS)
8 gene-based signature predicted MSS in the training and validation dataset

![Table 1.1 TNM staging of cutaneous melanoma Adapted from Balch et al. [44].](https://thumb-us.123doks.com/thumbv2/123dok_us/1456701.2694887/27.892.182.784.187.993/table-tnm-staging-cutaneous-melanoma-adapted-balch-et.webp)