Center for Nondestructive Evaluation Conference
Papers, Posters and Presentations
Center for Nondestructive Evaluation
7-2009
Evolution of QNDE's core interdisciplinary science
and engineering base
Donald O. Thompson
Iowa State University
Follow this and additional works at:
http://lib.dr.iastate.edu/cnde_conf
Part of the
Materials Science and Engineering Commons
,
Mechanical Engineering Commons
,
and the
Structures and Materials Commons
The complete bibliographic information for this item can be found at
http://lib.dr.iastate.edu/
cnde_conf/61
. For information on how to cite this item, please visit
http://lib.dr.iastate.edu/
howtocite.html
.
This Conference Proceeding is brought to you for free and open access by the Center for Nondestructive Evaluation at Digital Repository @ Iowa State University. It has been accepted for inclusion in Center for Nondestructive Evaluation Conference Papers, Posters and Presentations by an authorized administrator of Digital Repository @ Iowa State University. For more information, please [email protected].
EVOLUTION OF QNDE’S CORE INTERDISCIPLINARY SCIENCE AND
ENGINEERING BASE
Donald O. Thompson
Citation: AIP Conf. Proc. 1211, 3 (2010); doi: 10.1063/1.3362421 View online: http://dx.doi.org/10.1063/1.3362421
View Table of Contents: http://proceedings.aip.org/dbt/dbt.jsp?KEY=APCPCS&Volume=1211&Issue=1 Published by the American Institute of Physics.
Related Articles
Influence of a localized defect on acoustic field correlation in a reverberant medium J. Appl. Phys. 110, 084906 (2011)
Full-field imaging of nonclassical acoustic nonlinearity Appl. Phys. Lett. 91, 264102 (2007)
Laser ablation of solid substrates in a water-confined environment Appl. Phys. Lett. 79, 1396 (2001)
Estimation of lubricant thickness on a magnetic hard disk using acoustic emission Rev. Sci. Instrum. 71, 1915 (2000)
A theoretical model for acoustic emission sensing process in contact/near-contact interfaces of magnetic recording system
J. Appl. Phys. 85, 5609 (1999)
Additional information on AIP Conf. Proc.
Journal Homepage: http://proceedings.aip.org/
Journal Information: http://proceedings.aip.org/about/about_the_proceedings
Top downloads: http://proceedings.aip.org/dbt/most_downloaded.jsp?KEY=APCPCS Information for Authors: http://proceedings.aip.org/authors/information_for_authors
EVOLUTION OF QNDE'S CORE INTERDISCIPLINARY SCIENCE
AND ENGINEERING BASE
Donald O. Thompson
Anson Marston Distinguished Professor Emeritus of Aerospace Engineering and Engineering Mechanics and
Founding Director, Center for NDE, Iowa State University Scientific Advisor to the Director, IPRT
1915 Scholl Road, Ames, IA 50011
ABSTRACT. Nondestructive testing (NDT) for flaws in materials and structures has undergone an evolutionary change over the past 50 years. In the U.S. it has moved from a testing strategy (NDT) with a zero defects requirement to a test and evaluate technology (NDE) based upon damage tolerant design considerations. Here it is assumed that the part will always contain defects but those greater than a critical size, specified by fracture mechanics, will be removed by inspection thereby resetting the part’s service clock. In this talk, events will be identified that were critical in promoting this paradigm shift and in moving on to quantitative NDE (QNDE). A number of major research programs were also initiated to upgrade NDT to meet the new requirements; principal attention in this talk will be given to research highlights initiated in the first of these programs, the DARPA/AFML Interdisciplinary Program for Quantitative Flaw Definition that was established 35 years ago. Its purpose was threefold: to develop a new core science/people base for inspection technology that could meet the new requirements, to set the stage for new field - adaptable engineering tools, and to initiate the current continuing series of quantitative NDE (QNDE) meetings. Advances initiated in this program and pursued by many over the years have resulted in a scientific core structure for quantitative NDE (QNDE) based on a linkage of fundamental models of the various measurement processes that are involved in any inspection and/or technology. These models and their linkage will be discussed and the core structure defined. A new and powerful set of engineering tools - i.e. simulation programs for UT, X-ray, and EC technologies –has also been developed using these models. Applications of these tools will be highlighted and their role in other advanced programs including Structural Health Monitoring and Condition-Based Maintenance will be noted. Finally, a discussion of visions of future opportunities and directions for QNDE will be given.
Keywords: NDT, NDE, QNDE, Ultrasonics, Science Base, Engineering Technology, Simulators
PACS: 43.35.Zc, 81.70.Ex, 87.59.B
INTRODUCTION
The Conference this year marks the 36th anniversary of the initiation of a research quest to develop a science base for a quantitative nondestructive test technology, a quest
3
CREDIT LINE (BELOW) TO BE INSERTED ON THE FIRST PAGE OF EACH PAPER
EXCEPT FOR ARTICLES ON PP. 295-302, 427-434, 910-917, 1021-1028, 1233-1240, 1452-1459, 1887-1894, and 2015-2022.
CP1211, Review of Quantitative Nondestructive Evaluation Vol.29,
edited by D. O. Thompson and D. E. Chimenti © 2010 American Institute of Physics 978-0-7354-0748-0/10/$30.00
that has been a personal commitment of the author as well as a number of colleagues for these many years. This has not been a simple task, for the technology contains many modalities, many branch points, and is extraordinarily interdisciplinary. It is appropriate at this time, after more than a generation, to look back at the evolution of QNDE and to realize the magnitude of the changes that have taken place in this technology. To do this, however, it is necessary to define as clearly as possible the terms that are used in this paper. While there is no universal consensus on term usage, Forney [1] defined the terms that are increasingly accepted and used herein. According to Forney,
• NDT refers to the development and application of the nondestructive test methods themselves
• NDI refers to the performance of inspections to established specifications or procedures using the NDT methods to detect anomalies
• NDE refers to the broad examination of materials, components, or assemblies to define, classify, and make qualitative, and eventually quantitative, measurements of anomalies in terms of size, shape, type, orientation, and hopefully materials strength and stress levels.
Following Forney, then, QNDE is defined as quantitative NDE, a truly interdisciplinary engineering technology that deals with physical measurements f quality assurance.
The purpose of this paper is to demonstrate that a science core for QNDE has indeed been constructed and that important engineering tools that follow exist. To do this, the background driving the changes will be discussed, the structure of the science core with examples for the case of standard ultrasonic practice will be given, a new and powerful engineering tool, simulation, that is completely dependent upon the existence of QNDE and examples of its application will be given, and some thoughts for future directions put forth. Part of the information presented will be “old hat” to many of you, but the author begs your patience and hopes that the history presented will useful to those unfamiliar with it.
BACKGROUND
Nondestructive testing (NDT) had its formal beginnings in the U.S. during WW2 as an experiential, need- based technology. Its purpose was to assure that all war products and goods were without defect and of high quality. Because of the rush of World War II and, in contrast to other engineering technologies, NDT was reduced to practice without the benefit of the work of organized academic programs and a firm scientific base derived from a period of research and development. The first formal organization was the American Industrial Radiation and X-Ray Society which grew into the American Society for Nondestructive Testing (ASNT) that included an increased range of testing technologies. Means for this growth was provided by industry and its support organizations and federal high technology agencies such as the Department of Defense (DOD), the National Aeronautics and Space Administration (NASA), the Atomic Energy Commission (AEC) which has become the Nuclear Regulatory Commission (NRC) and the Department of Energy (DOE). This approach produced an array of testing tools and techniques whose worth was proved in the war and following years in several high cost, high technology programs but was technically deficient of physical understanding of the measurements and their relation to materials and failure modes.
4
2010
On‐site monitoring 2000
Economic and cultural globalization
Scanning of large areas and multi‐dimensional problems 1990
Aging systems (Aloha, Sioux City power system) “Mushrooming” of computational capabilities 1980
ASME codes
Field tests for defect detectability (e.g., “Have cracks will travel”) Military air crashes and missed defects
1970
Improved safety for nuclear power systems New materials (e.g., composites)
Advent of fracture mechanics and “critical flaw” replacing “0” defects (damage tolerant design)
1960
“0” defects strategy with research emphasis on high defect sensitivity (safe‐ life design)
1950
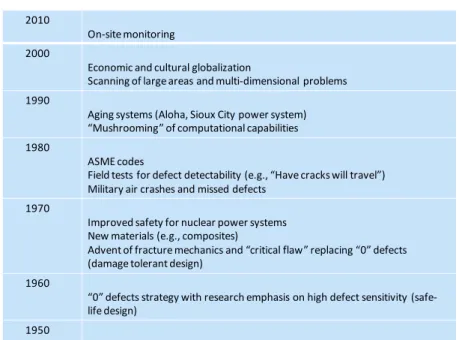
FIGURE 1. A selected summary of events that motivated the development of quantitative NDE.
A selected summary of events that motivated the development of quantitative NDE (QNDE) from the 1950s to current times is shown in Fig. 1. In the following paragraphs comments are made that highlight three major points of guidance: the need to size defects, the need for improved flaw detectability, and the need for continued inspection in aging structures.
Reading from bottom to top, most development in the 1950s was guided by a strategy from the war years– the “zero” defects strategy. This strategy declared that if any “indication” of a flaw were found, the product harboring the “indication” had to be removed from service. No criteria for flaw severity were available. This strategy was not only excessively costly but, as it turned out, also provided motivation for research which was aimed in the wrong direction - higher instrumental sensitivities and a greater ability to find smaller and smaller defects.
In the 1960 – 1970 period, major changes took place. The first important change was the advent of fracture mechanics that introduced the idea of a critical flaw [2]. This was very important, for it said that flaws below a critical size were not important to safety and that fulfillment of a “zero defects” criterion was much more than needed for safety and acquired only at a much higher cost. Fracture mechanics and the recognition of critically sized flaws led to another significant change, i.e. the development of damage tolerant design. In contrast to the earlier safe life design practice and its “zero defects” inspection strategy, damage tolerant design permitted the existence of flaws in structures so long as they were below the critical size. Figure 2 shows the exceptionally large range of critical flaw sizes that characterizes various materials [3].
Materials Critical Flaw Size (mm) Steels 4340 1.5 D6AC 1.0 Marage 250 5.0 9Ni4Co 2OC 18.0 Aluminum Alloys 2014‐T6S1 4.5 2024‐T3511 25.0
Titanium Alloys 6Al‐4V 2.5
8Al‐1Mo‐IV (β) 14.5 Silicon Nitrides Hot Pressed 0.05 Reaction Sintered 0.02
Glasses Soda Lime 0.001
Silica 0.003
FIGURE 2. Estimates of critical flaw sizes in some metal and ceramic systems. After Thompson and Evans [3] (© 1976 IEEE).
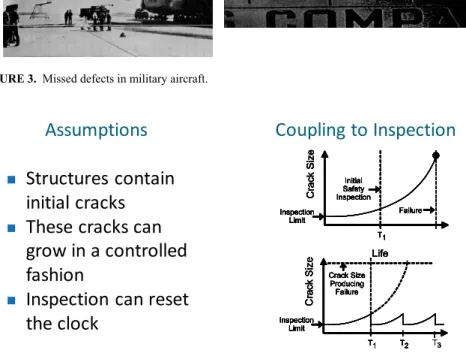
In the 1970s and 1980s we learned that improved defect detectability was the next major milestone to be met. Figure 3 shows two examples of military air disasters that emphasized this point. The left side shows a pylon failure in a C5 aircraft due to a missed defect. The engine took off but the airplane is still sitting. The right side shows an inclusion in the wing of an F111 aircraft that was missed and resulted in a crash with loss of life. It was reported that this inspection was done 11 times and was missed 11 times, both in the manufacturing cycle and in field inspection.
The period from 1980-1990 brought into focus the third major need for improvement, i.e. the necessity and importance of continued and upgraded NDE inspections in all aging systems and infrastructures. A first example of this need was the tragic Aloha Airlines event in which the canopy of a commercial aircraft was torn off in flight with loss of life. It was later found that this event was traceable to a crack. A second major event was the crash of United Airlines flight 232 at Sioux City due to an engine disc failure, again with the loss of many lives.
In the 1990s and the 2000s changes continued from lessons learned earlier. One of these was the need for scanning of large areas including structural health monitoring (SHM) and other condition based maintenance based strategies with simultaneous cost reduction. Industrial globalization lead to the extension of QNDE concepts world-wide through the establishment of the World Federation of NDE Centers and other mechanisms. This was an important step required to maintain a standard of quality world-wide.
6
C-5 engine pylon failure Manufacturing defect leading to F-111 wing failure
FIGURE 3. Missed defects in military aircraft.
Structures
contain
initial
cracks
These
cracks
can
grow
in
a
controlled
fashion
Inspection
can
reset
the
clock
Assumptions
Coupling
to
Inspection
Crack Si ze Inspection Limit Life Failure Initial Safety Inspection T1 Crack Si ze Inspection Limit Life Failure Initial Safety Inspection T1 Crack Si ze Inspection Limit Life Failure Initial Safety Inspection T1 Crack Si ze Inspection Limit Life Failure Initial Safety Inspection T1 Crack Si ze Inspection Limit Life Failure Initial Safety Inspection T1 Crack Si ze Inspection Limit Life Failure Initial Safety Inspection T1 Crack Si ze Inspection Limit Life Failure Initial Safety Inspection T1 Cr ack Size Inspection Limit Life Crack Size Producing Failure T1 T2 T3 Cr ack Size Inspection Limit Life Crack Size Producing Failure T1 T2 T3 Cr ack Size Inspection Limit Life Crack Size Producing Failure T1 T2 T3 Cr ack Size Inspection Limit Life Crack Size Producing Failure T1 T2 T3 Cr ack Size Inspection Limit Life Crack Size Producing Failure T1 T2 T3 Cr ack Size Inspection Limit Life Crack Size Producing Failure T1 T2 T3 Cr ack Size Inspection Limit Life Crack Size Producing Failure T1 T2 T3
FIGURE 4. Relationship between damage tolerant design and inspection.
It is important to understand the relationship between damage tolerant design and the imspection process. This is shown in Fig. 4. As opposed to the earlier safe life design philosophy which supposes that no flaws exist, damage tolerant practice assumes that structures contain initial cracks that, if undetected, can grow in service to critical size at which point failure can occur. This is shown in the upper curve in which the growing crack size is plotted against service time of the part. An inspection is performed at T1; finding no crack or that the crack is still less than critical size, the service clock is reset and the part is restored to service. This process is repeated until the crack becomes critical and the part is removed from service.
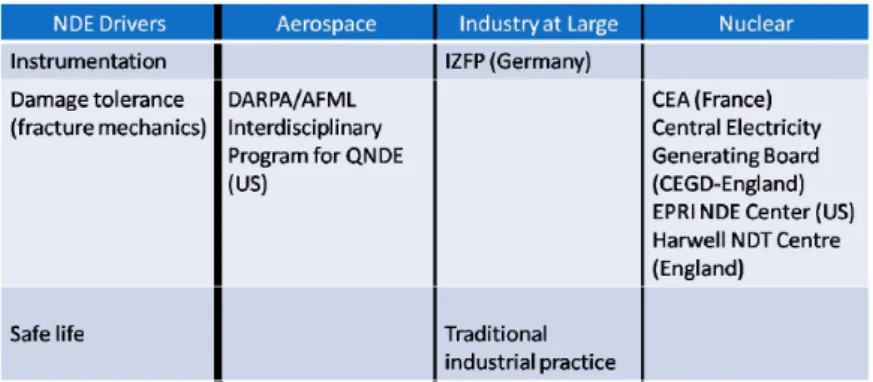
The research community responded to these demands in the 1970s with the establishment of several major NDE research activities shown in Fig. 5. The NDE drivers are listed in the first column, and responses serving three different industry segments are shown in the remaining columns. In the U.S., the aerospace industry was the focus of the Defense Advanced Research Projects Agency/Air Force Materials Laboratory
.
FIGURE 5. R and D response to NDE needs.
(DARPA/AFML) Interdisciplinary Program for Quantitative Non Destructive Evaluation with emphasis upon finding ways to quantify flaw size and flaw detectability. Industry in Germany was served by the Fraunhofer Institute that formed the Fraunhofer Institute for Non-Destructive Testing (IZFP) with an emphasis upon the development of new techniques and instrumentation, while industry at large continued its ongoing research efforts that focused largely upon the improved instrumental sensitvity as required by safe life design practices. Several new activities were started that served primarily the emerging nuclear industry. These included the French Atomic Energy Commission (CEA) in France, the Central Electricity Generating Board (CEGB) and the Harwell NDT Centre in England and the Electric Power Research Institute (EPRI) NDT Center in the U.S. In addition to these major research activities that involved large numbers of investigators, various single investigator research efforts were also initiated.
SCIENCE BASE
This paper will now focus on work initiated in the DARPA/AFML Program and extended by many others. This is the program upon which the QNDE annual conference is based and the one that was initiated by and affiliated with members of the QNDE staff.
The dual, broad objectives of the DARPA/AFML Interdisciplinary Program for Quantitative NDE are given in Fig. 6. The Air Force and DARPA were both aware that NDE deficiencies were severe and that research efforts needed to go back to fundamentals before reliable engineering tools could become available to address the needs of the new damage tolerant design. A third unwritten objective is also stated in the figure. The program manager was strongly encouraged by the sponsors to initiate efforts to develop a new people base that would be a part of the new quantitative technology. The current QNDE conference was started as a consequence to help build both the new people-base and the new quantitative technology.
8
Develop a new science/people base core that will meet the
requirements for damage tolerant design and set a new path
for NDE
Set the stage for the development of new engineering tools Initiate and develop QNDE meetings to help build a quantitative
technology
FIGURE 6. Objectives of the DARPA/AFML Interdisciplinary Program for QNDE.
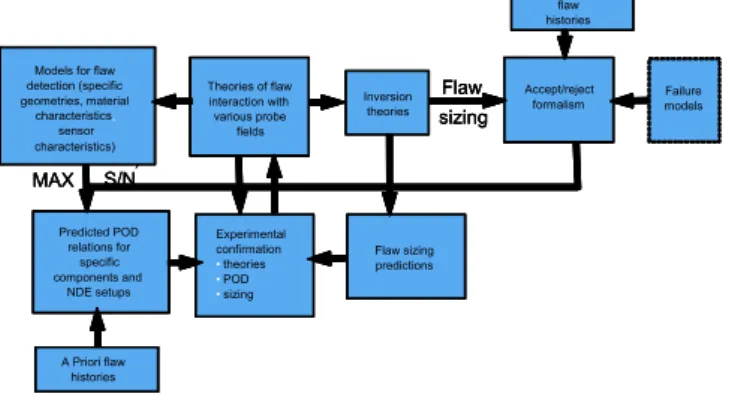
Figure 7 shows the building blocks that were deemed minimally necessary to form the core of an interdisciplinary science base for each NDE technology that would enable key parameters to be determined, i.e. flaw size, shape, and detectability [4]. They include the development of theories of flaw detection with various probe fields, inversion models with flaw sizing capabilities, and models for flaw detection leading to probability of detection (POD) relations, all with experimental confirmation. Success in developing these blocks would allow coupling to the materials engineering community to form the needed accept/reject criteria and to the physical mathematics groups to form PODs. As noted above, this set of building blocks is applicable to all NDE measurement techniques; however, the remainder of my comments will be focused upon advances in a standard ultrasonic test procedure since there isn’t time and space to summarize the various techniques individually and they can’t be done generically. It is to be noted, however, that progress similiar to that discussed here for ultrasonics has been accomplished for eddy currents and X-rays.
In the following sections examples will be given of major advances that have been made in all the science base building blocks for the ultrasonic case. This is not intended to be, and certainly is not, a comprehensive survey, but one which shows that a sufficient number of working solutions has been obtained in all blocks to claim that a working
FIGURE 7. Generic NDE building blocks that form the core of an interdisciplinary science base. After Burte, Chimenti, Thompson, and Thompson [4].
Probe and Probe Field
Models
Failure models Models for flaw
detection (spe -cific geometries, material char-acteristics, sensor characteristics ) Theories of flaw inter-action with various probe fields Inversion theories Accept/reject formalism A Priori flaw histories Predicted POD relations for specific compo -
nents and NDE setups Experimental confirmation •theories •POD •sizing Flaw sizing predictions A Priori flaw histories Flaw sizing MAX S/N Models for flaw detection (spe -cific geometries, material char-acteristics, sensor characteristics ) Theories of flaw inter-action with various probe fields Inversion theories Accept/reject formalism A Priori flaw histories Predicted POD relations for specific compo -
nents and NDE setups Experimental confirmation •theories •POD •sizing Flaw sizing predictions A Priori flaw histories Flaw sizing MAX S/N Flaw sizing MAX S/N Models for flaw detection (specific geometries, material characteristics, sensor characteristics) Theories of flaw interaction with various probe fields Inversion theories A Priori flaw histories Accept/reject
formalism Failure models
Predicted POD relations for specific components and NDE setups Experimental confirmation • theories • POD • sizing Flaw sizing predictions A Priori flaw histories 9
FIGURE 8. Standard ultrasonic system that is utilized in model discussion. After Schmerr [6].
science base literature has been developed for ultrasonics (and as noted above for other major technologies also) and is at work solving major problems. Many of these advances were seeded and done through the DARPA/AFML program but many were done by others, perhaps through contact with and contributions to this Conference. The reader is referred to the recent book by Schmerr [5] for a much more complete summary of the contributions to be discussed.
Theories of Interaction with Probe Fields
Much work has been done in the development of models that describe the fundamental interactions of the probe field with the flaw at the position of the flaw for the standard ultrasonic system shown in Fig. 8 [6]. These include transducer/field models, scattering models, a reciprocity model, and a measurement model that are reviewed briefly in this section. From these basics the size, shape, and detectability of the flaw can be determined.
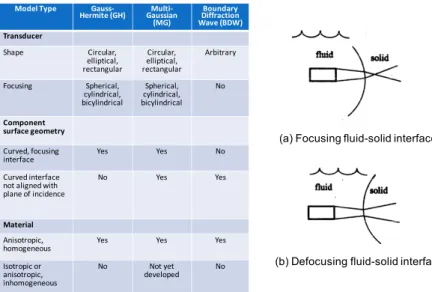
Models that describe the transducer field at any position in the test piece and their properties are given in Fig. 9. The Gauss-Hermite [7, 8, 9], the multi-Gaussian [10,11], and the boundary diffraction models [12,13,14] are all paraxial models. Other models have been developed that may be more detailed but also more computationally intensive than these [15, 16, 17,18,19, 20, 21]. The models describe fields generated by transducers of different shapes and fields and are calculated on the basis of external properties of the transducer (i.e. size and shape) rather than internal transducer structure such as is the case with older models due to Mason [22] and others. The right half of the figure shows model performance at both focusing and defocusing interfaces, one of the practical considerations required of all transducers.
10
Model Type Gauss‐
Hermite (GH) GaussianMulti‐
(MG) Boundary Diffraction Wave (BDW) Transducer Shape Circular, elliptical, rectangular Circular, elliptical, rectangular Arbitrary Focusing Spherical, cylindrical, bicylindrical Spherical, cylindrical, bicylindrical No Component surface geometry Curved, focusing interface Yes Yes No Curved interface not aligned with plane of incidence
No Yes Yes
Material
Anisotropic, homogeneous
Yes Yes Yes
Isotropic or anisotropic, inhomogeneous No Not yet developed No
(a) Focusing fluid-solid interface
(b) Defocusing fluid-solid interface
FIGURE 9. Probe field/transducer beam models and some properties. Schematic on right shows field interaction with curved surfaces. After Schmerr [5].
Models
Analog Kirchoff
Born
Geometrical Theory of Diffraction (GTD) Numerical Separation of variables
T‐Matrix Method of Optical Truncation (MOOT) Finite differences Finite elements Boundary elements
(a) Kirchoff-fields at flaw are approximated by the incident and reflected waves from a plane surface at the point of contact; the incident wave passes through a weakly scattering inclusion essentially undisturbed
(b) Born assumes that only the incident fields at the flaw generate the scattered waves (weak scattering assumption)
flaw
FIGURE 10. Scattering amplitude models for the beam/flaw interaction, right half shows interaction for the Kirchoff and Born approximations. After Schmerr [5].
After describing the generation and propagation of the probe fields, the interaction of the flaw with the probe field at the position of the flaw must be described. Here, a rich set of both analog and numerical scattering models and tools have been developed and are listed in Fig. 10. The analog models are approximate models and can be handled computationally fairly easily. Two limiting cases are shown in Fig. 10. The Kirchoff model [23, 24, 25, 26, 27] is a high frequency model that is widely used. As shown in the right half, the field at the flaw is taken to be the incident wave and the reflected wave at the point of contact with the flaw but reflections of the wave from the rear of the flaw are neglected. On the other hand, the Born model [28, 29, 30, 31, 32] is a low frequency model in which
only the incident wave at the surface of the flaw generates the scattered wave. As yet, there is no model that is applicable in the mid frequency range. The geometrical theory of diffraction [33] is well known to many and is used often in the characterization of cracks. The earlier work of Ying and Truell [34] is an exact solution for the scattering by a spherical defect. It is not computationally easy and cannot be applied to other scattering shapes.
Having the models described above and an additional way to measure the efficiency of the ultrasonic system, the results can be combined to yield a model of the entire measurement process, i.e. a “measurement model”. This combinatorial procedure was used by Tittman, Thompson, and Thompson [35] to form a “characteristic equation” in discussing ultrasonic standards and by Schmerr [5] in the context of the “measurement model” as defined above. A more elegant and rigorous approach that leads to similar results but doesn’t depend upon the assumptions inherent in the combinatorial approach, i.e. a quasi plane wave condition at the position of the flaw and a flaw size small compared to the wavelength, was put forth by Auld in 1979 [36]. Auld developed a general formulation based on electromechanical reciprocity that has been used widely in the development of today’s “measurement models”. Specifically, he calculated the change in the cable (c.f. Figure 8) transmission coefficients due to the presence of the flaw in the system.
Using Auld’s results, Thompson and Gray formulated the “measurement model” [37] for ultrasonics that is widely used in current day practice. Figure 11 shows their results. Notably, the measured system response is given by S in their equation and the flaw scattering amplitude is given by A. Other parameters in the equation are defined in the figure and figure caption. The appearance of both S and A in the same equation is useful (and also physically intuitive) since these are the two key parameters needed to satisfy the inspection requirements given earlier, i.e, A , the scattering amplitude of the flaw that contains flaw sizing information and S, the measured signal amplitude. S is obtained by direct experimental procedures whereas A can be obtained by deconvolution, an inverse and usually difficult indirect procedure.
1/2 a a a [T C P ] = β • 1/2 b b b [T C P ] β • 1 1 b 2 b 0 0 2A v ik a v ρ ρ S
βIs the system efficiency factor are interface transmission coefficients
are diffraction/focusing terms (beam model) are propagation terms (phase and attenuation) is the flaw scattering amplitude
a b T , T a b C , C a b P , P 1 A
FIGURE 11. Measurement models results. In addition to labels in figure, ρ1 is the density and νb is the
ultrasonic velocity of the received mode in the solid medium, kb is the wavenumber of the received wave
mode in the solid medium, ρ0 is the density of the fluid medium, v0 is the acoustic velocity in the fluid medium, and a is the transducer radius. After Thompson and Gray [11].
12
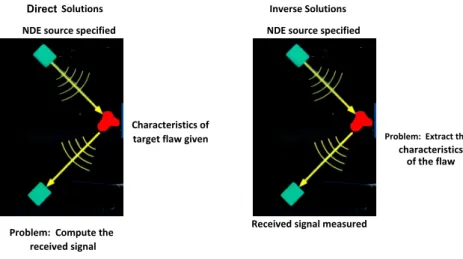
FIGURE 12. Examples of direct and inverse solutions.
Figure 12 is useful in physically understanding the concept of direct and inverse solutions. The direct solution is shown on the left side of the figure. In this case the source of the driving signal is known as are the details of the scattering flaw. With this information the signal S can be calculated or measured. The inverse problem is shown on the right half of the figure. Here the driving signal is known and the received signal is measured. A, the unknown scattering cross section, is then calculated.
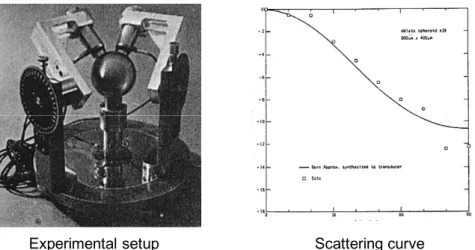
Experimental confirmation of modeling results and limits of model applicability have been an important part of the development of QNDE from its beginnings. It has become a welcome standard practice in QNDE research and resultant papers presented to note that theoretical work is nearly always followed by experimental confirmation in the well established scientific practice. Figure 13 shows an example of some apparatus and results from early work by Tittman in confirming scattering results and limitations predicted by the Born approximation [38]. The apparatus was a precise goniometer and the samples were cleverly diffusion - bonded from two titanium halves, each half containing a carefully machined half of the test defect (e.g. spheres, ellipsoids, cracks) that were matched before bonding. Most measurements of this kind were pitch-catch measurements in which the scattering angles could be accurately measured and theoretical predictions checked.
DirectSolutions Inverse Solutions
NDE source specified NDE source specified
Characteristics of
target flaw given Problem: Extract the
characteristics of the flaw
Problem: Compute the
received signal
Experimental setup Scattering curve FIGURE 13. Experimental goniometer and scattering results for confirming Born approximation. After Tittmann [38].
Inversion Theories and Sizing Predictions
Information obtained from the flaw scattering amplitude in the measurement model is key in determining flaw size and shape that are required in damage tolerant design considerations. Various inverse solutions have been developed for small flaws using the Born and Kirchoff approximate models discussed earlier. These solutions are challenging because of the necessity of collecting much scattering data to avoid non-unique answers. It may be expected that use of these small flaw methods will increase with the advances in transducer array and signal processing technology. A variety of imaging, reconstruction, and characterization techniques and methods has also been developed to obtain size and shape data for larger flaws. Examples of these inverse procedures are given in Fig. 14. Imaging procedures are very attractive as an inverse technique whenever they can be used.
Ultrasound:
Inversion of Tip Diffracted Signals (TOFD, RATT) Inverse Born Approximation
Flaw Reconstruction SAFT in Anisotropic Media Imaging
Materials Characterization Surface Characterization Eddy Currents:
Model‐Based Crack Sizing
Characterization of Coatings and Cladding Process Control of Extruded Materials Imaging (Scan and Array)
X‐Rays: Imaging
FIGURE 14. Examples of inverse solutions including both analytic and instrumental methods.
14
FIGURE 15. Forms of the probability of detection results. The inflection point occurs at the critical flaw size.
Models for Flaw Detection and Probabilty of Detection (POD)
The direct solution S of the measurement model provides a way to fulfill the second major requirement cited earlier, i.e., flaw detectability. Coupled with information that characterizes various kinds of noise distributions in samples and measurement systems such as electronic noise, surface roughness and grain scattering noise, and others that must be determined separately [5, 6, 39, 40, 41, 42, 43, 44, 45, 46], probability of detection (POD) models have been developed that predict the performance of the ultrasonic system and flaw detectability. Most models rely upon the results derived by Rice [47] for the envelope detection of a narrowband rectified signal in noise distributed normally. Such models usually result in a sigmoidal shaped curve when plotted as a function of flaw size a, such as is shown in Fig. 15 in which the inflection point occurs at the critical flaw size. Regions of false reject and false accept are also shown. The left side of the figure gives expressions for the Probability of Detection and the Probability of False Alarm in which x is the flaw size, y is the signal amplitude, and yth is a noise threshold. Research in various aspects of the POD is intense at this time; the reader is encouraged to examine papers in these in the current and past volumes that relate to the subject.
Summary
Although research is never finished, the discussion in this section shows that a necessary working scientific base with continuity has been established in each of the boxes shown in Fig. 7 associated with the science core. The base is sufficient to provide ways to obtain the inspection information (flaw size and shape, detectability) required by damage tolerant design considerations even though some of he answers are as yet difficult to implement. These include in particular inversion techniques which may be enhanced by future advances in transducer array technology and scattering models that are valid in the midrange.
ENGINEERING TOOLS
Many new engineering tools and applications have been brought forward in recent years, but we will here focus on one major and very powerful tool – the simulator - that couldn’t exist without, and is exclusive to, the structured fundamental modeling results described earlier in this paper. This tool has the potential for enhancing the role of NDE significantly in opening new opportunities, improving safety, and reducing manufacturing and operational costs of industrial products. The simulator is a concept and tool well known in a variety of technical endeavors. In the QNDE case, a simulator’s purpose is to produce predictable QNDE results at the drawing board stage of a design as well as to permit parametric studies of inspection situations to be made.; it is constructed by joining some or all of the models discussed earlier with a way to describe the geometry of a part, such as a computer-aided design program. Several early QNDE simulators have been constructed that serve different purposes. Ultrasonic simulators include:
CIVA-French Atomic Energy Commission (CEA) [48, 49] UTDefect- Chalmers University of Technology [50, 51] UTSIM – Center for NDE, Iowa State University [52, 53] GPSS, GP – IZFP, Saarbruchen [54, 55, 56] EFIT – University of Kassel [57, 58 ]
MSLM – Korea [59]
The reader who is interested in details of the simulators is encouraged to read the references. A check will show that these simulators use different models in their structures and perform different operations. In addition to these ultrasonic simulators, simulation of eddy current and X-ray measurements have also been developed at the Center for NDE at Iowa State University (ECSIM and XRSIM) and at CEA where they are included in CIVA.
Many and varied applications have been identified for NDE simulators and many more can be expected. Some ultrasonic simulators that cover a wide range of interests in industry, education, and medicine are listed in Fig. 16. Industrially, applications listed bring QNDE to the front of the manufacturing process and provide quantitative assessments of inspection capabilities, both being long sought goals. Model assisted POD is a program of major current interest aimed at handling large statistical ensembles of components. Great opportunities for use in research and education exist as both and education and research tool. Some applications also exist in the medical as noted.
Industrial
Design of inspections
Quantification of detection capabilities
NDE inspectability during design
Training
Model assisted POD
Research and Education
Interpretation of experimental data
Classroom and distance education
Medical
X‐ray studies of dose effects
Examination of therapeutic effects of UT on soft tissue
Eddy current studies of heart valve fatigue damage
POD concepts related to tumor detection
FIGURE 16. A list of some simulator applications.
16
Figures 17 and 18 provide an excellent example due to T. Gray [60] of the use of simulation in the design of inspections and inspectability. Figure 17 is a CAD drawing of an engine turbine disc while details in Fig.18 show a transducer set up to inspect the cross section of the disc with the transducer beam in the disc shown as a light colored area. Inspection parameters for two cases are shown on the left and right halves of the figure; they are the same with the exception of the scan index parameter, i.e., the spacing between successive ultrasonic tests. On the left, labeled inadequate scan spacing (0.10”), it can be seen that there is a space between each of the inspections that is dark and therefore uninspected. On the right, labeled adequate scan spacing (0.02”), there is no dark space between beam patterns in the disc. In this case, the disc volume has been completely insonified and inspected This test can be very important when setting up the parameters to make an inspection.
FIGURE 17. A CAD model of a turbine engine disc. After T. Gray [private communication].
Signal Amplitude 0.0 .05 1.0 Inspection Parameters: •10 MHz probe •60% bandwidth •3” focal length •3/8” diameter •3” water path •normal incidence •0.10” scan index
Inadequate scan spacing Adequate scan spacing
Signal Amplitude 0.0 0.5 1.0 Inspection Parameters: •10 MHz probe •60% bandwidth •3” focal length •3/8” diameter •3” water path •normal incidence •0.02” scan index
Continue development and validation of model science
base for all major modalities
Extend simulator applications to SHM and evaluate
performance
Explore ways to use model‐based approaches to address
statistical ensembles of components (MAPOD) Explore use of simulation to establish standards for all
modalities
Reactivate Unified Life Cycle work and incorporate NDE
engineer and NDE models into product design cycle FIGURE 19. Future directions that include both research and application.
FUTURE DIRECTIONS
As always, there are items of the science core that need to be completed and many new opportunities exist. A list of possible future directions is given in Fig. 19 that includes both. Comments follow.
• We have a strong need to continue the validation of the model science base and the development of new models for all inspection modalities. Broad world wide validation of current models has been initiated by the World Federation of NDE Centers in a comparative benchmark program that is summarized below [61, 62]. However, this is a small effort initiated and funded by the Federation that needs to be greatly extended. It is an important effort needed to make QNDE technology compatible on a worldwide stage. To the author’s knowledge, this work has not been initiated but offers great promise.
NDE Benchmarks
Benchmarks have included model‐model comparisons and comparison of models to experiments
Benchmark activities have considered Ultrasonic, Eddy Current, Magnetic Flux Leakage, and Radiography problems Worldwide participation, including France, Germany,
Sweden, Poland, Korea, China, India, Argentina, Brazil, and the USA
Organized by the World Federation of NDE Centers. First benchmark session held at RPQNDE Brunswick, Maine meeting in 2001
• It seems obvious that simulation techniques coupled with CAD, POD, and other model capabilities will be very useful in the engineering design, initial evaluation, and implementation of big system NDE such as structural health monitoring. For example, simulation provides the capability to test different sensors, different sensor locations and number required, and optimize POD results in different geometries all at the “ drawing board”.
• Serious major problems exist in the inspection of complex aging structures. For example, current practice requires the fabrication of many samples to validate an inspection procedure on a given part. Given multiple similar structures and multiple
18
structures of various kinds, it is easy to see that the inspection costs and times rapidly become unmanageable. It may be that computer simulation coupled with some experimental work could provide significant advantages. Model assisted POD (MAPOD), a curently active project, is addressing this issue.
• Computer based simulations should find a welcome role in improving significantly reference standards for all NDE modalities. The use of model based results, once confirmed in general, can be used to provide specific predictions for a given measurement against which the test system may be compared. This procedure would do away with the need for test blocks that depend upon material properties (inherently included in the test block material) that often make the test blocks irreproducible (from time to time and place to place) for standards purposes.
• It is important to re-establish the Unified Life Cycle Engineering (ULCE) activity that the Air Force initiated some time ago [63, 64, 65]. This concept, shown anecdotely in Fig. 20, envisions that the QNDE engineer can now take a seat at the designer’s “table” on an equal basis with all the other disciplinary engineers involved in product design. The QNDE engineer has, for the first time, a full set of model based tools with which to interact with the other engineers -i.e, CAD designer programs, stress analysis programs, new materials and properties models, failure mechanics and reliability models, and cost and models. The concept integrates and incorporates original design, operational, and maintenance schedules such as structural health monitoring and conditional based monitoring all at the design table.
SUMMARY
Although it has been more than a generation since QNDE research began with a specific focus to produce both a new quantitative NDE technology that meets the requirements of damage tolerant design and a complement of new QNDE researchers and
Designer NDE Engineer Materials and Properties Engineer Stress Analyst Failure Mechanics and Reliability Engineer Economist FIGURE 20. The new QNDE engineer seated at the designer’s table.
Have you heard of the wonderful one-hoss shay That was built in such a logical way
It ran a hundred years to a day And then all of a sudden it….
So well crafted, needed no repairs for over 100 years. Wore
out completely, all at once, and fell apart.
FIGURE 21. Holmes’ vision of the “holy grail” of NDE.
engineers who will promote the field, even a partial summary such as given here and the continuing excellent audience at QNDE shows that the time has been well spent. So, let me summarize here what we’ve said and shown.
• A core science base has been demonstrated including theory with experimental confirmation.
• The science base forms a powerful platform for new engineering tools e.g. simulations and a wide range of applications,
• Development of a model - based science core raises NDE from an experiential technology to a predictive engineering science with a seat at the designer’s table.
• The science core development has benefited immensely from attendee contributions to QNDE emanating from the DARPA/AFML seed.
Is it possible that, now, the “holy grail” of QNDE, as envisioned by the poet Oliver Wendell Holmes shown in Fig. 21, is attainable?
ACKNOWLEDGMENT
The author wishes to acknowledge with sincere thanks the support and friendship of Dr. R. Bruce Thompson who has provided technical leadership in all the scientific and technical development aspects of QNDE. He also wishes to thank many others for their participation over many years, especially Drs. George Alers, Otto Buck (deceased), B. Tittmann, C. Fortunko (deceased), Neil Paton, A. Evans (deceased), Lester Schmerr, Jr., J. Rose, Dale Chimenti, Lisa Brasche, John Moulder (deceased), T. Gray, J. Gray, R. Roberts, F. Margetan, D. Hsu, Norio Nakagawa, J. Krumhansl (Cornell University), Jan Achenbach (Northwestern University), Robert L. Thomas (Wayne State University), R. White,( UC Berkeley), B. Auld (deceased) and G. Kino (Stanford University) and contributors to and attendees at the QNDE Conference, members of the World Federation of NDE Centers and loyal staff members from the Rockwell International Science Center and the Center for NDE. No acknowledgement would be complete without noting the excellent guidance that
20
the DARPA/AFML program received from Dr. Harris Burte, Mr. Don Forney, and Dr. Michael Buckley at the AFML and Dr. Ed van Reuth at DARPA at its initiation and in the formative years, and continuing guidance from various program monitors including Dr. D.E, Chimenti, now at Iowa State University. Neither would it be complete without acknowledging the introduction to the changing NDT environment in the 50’ and 60’and mentoring provided to program researchers by Mr. Ed Caustin, Director of the B-1 Quality Assurance Program at North American Rockwell. The B-1 aircraft was the first major military system built to damage tolerant design specifications. The QNDE Conference is indebted to the Air Force, ASNT, NASA, NSF, and numerous industrial partners for their long term support.
REFERENCES
1. Forney, D. M., “USAF NDE Program-Requirement for Technology Transaction,” Technical Report AFML-TR-TI-44, July 18, 1975-September 1976, p. 220. 2. Anderson, T. L., Fracture Mechanics: Fundamentals and Applications, CRC Press,
Boca Raton, Florida (2005).
3. Thompson, R. B. and Evans, A. G., IEEE Transactions on Sonics and Ultrasonics, Vol. SU23, No. 5, p. 291 (1976).
4. Burte, H. M., Chimenti, D. E., Thompson, R. B., and Thompson, D. O., “The Middle Ground of the NDE R&D Spectrum,” in Review of Progress in Quantitative NDE, Vol. 2A, D. O. Thompson and D. E. Chimenti, eds., pp. 7-18 (Plenum Press, NY), 1978.
5. Schmerr, Lester, W. Jr., Fundamentals of Ultrasonic Nondestructive Evaluation - A Modeling Approach, Plenum Publishing Company, New York, NY, 1998.
6. Schmerr, L.W. and S. J. Song, Ultrasonic Nondestructive Evaluation Systems – Models and Measurements, Springer, New York, NY, 2007.
7. Newberry, B. P., “Paraxial Approximation for Ultrasonic Beam Propagation in Liquid and Solid Media with Application to Nondestructive Evaluation”, Ph.D. thesis, Iowa State University, Ames, Iowa, 1988.
8. Newberry, B. P. and Thompson, R. B., “A Paraxial Theory for the Propagation of Ultrasonic Beams”, J. Acoust. Soc. Am., 85, 2290-2300, 1989.
9. Newberry, B. P., Thompson, R. B., and Lopes, E. F., “Development and
Comparison of Beam Models for Two-Media Ultrasonic Inspection” in Review of
Progress in Quantitative NDE, D. O. Thompson and D. E. Chimenti, Eds., Plenum
Press, New York, NY, 6A, pp. 639-647, 1987.
10. Wen, J. J. and Breazeale, M. A.,“A Diffraction Beam Expressed as the
Superposition of Gaussian Beams”, J. Acoust. Soc. Am., 83, pp. 1752-1756, 1988. 11. Huang, D. and Breazeale M. A., “A Gaussian Finite-Element Method for
Description of Sound Diffraction,” J. Acoust. Soc. Am., 106, pp. 1771-1781, 1999. 12. Schmerr, L.W., Lerch, T. P., and Sedov, A., “Modeling the Propagation of
Ultrasonic Sound Beams through General Curved Surfaces,” in Review of Progress
in Quantitative NDE, D. O. Thompson and D. E. Chimenti, Eds., Plenum Press,
13. Lerch, T. P., “Ultrasonic Transducer Characterization and Transducer Beam Modeling for Applications in Nondestructive Evaluation”, Ph.D. Thesis, Iowa State University, Ames, Iowa, 1996.
14. Schmerr, L. W., Lerch, T., and Sedov, A., “A Boundary Diffraction Wave Theory and its Application to Ultrasonic NDE”, in Review of Progress in Quantitative NDE, D. O. Thompson and D. E. Chimenti, Eds., Plenum Press, New York, NY, 13A, pp. 69-74, 1994.
15. Ludwig, R. L., Moore, D., and Lord, W., “Transducer Models for the Finite Element Simulation of Ultrasonic NDT Phenomena”, in Review of Progess in
Quantitative NDE”, D. O. Thompson and D. E. Chimenti, Eds., Plenum Press, New
York, NY, 6A, pp. 649-655, 1987.
16. Ludwig, R. and Lord, W., “Finite Element Study of Ultrasonic Wave Propagation and Scattering in Aluminum,”,Mat. Eval., 46, pp. 108-113, 1988.
17. Lord, W., Ludwig, R., and You, Z., “Developments in Ultrasonic Modeling with Finite Element Analysis,” J. Nondestr. Eval., 9, pp. 155-160, 1990.
18. Goswami, P. P., Rudolphi, T. J., Roberts, R. A., and Rizzo, F.J., “Ultrasonic Transmission through a Curved Interface by the Boundary Element Method,” in
Review of Progress in Quantitative NDE, D. O. Thompson and D.E. Chimenti,
Eds., Plenum Press, New York, NY, 10A, pp. 193-200, 1991.
19. Guo, Q. C. and Achenbach, J. D.,“Radiation of Ultrasound into an Anisotropic Solid”, Ultrasonics,33, pp. 449-456, 1995.
20. Marklein, R., Barmann, R., and Langenberg, K. J., “The Ultrasonic Modeling Code EFIT as Applied to Inhomogeneous Dissipative and Anisotropic Media,” in Review
of Progress in Quantitative NDE, D. O. Thompson and D. E. Chimenti, Eds.,
Plenum Press, New York, NY, 14, pp. 251-258, 1995.
21. Marklein, R., Langenberg, K. J., Klaholz, S., and Kostka, J., “Ultrasonic Modeling of Real-Life Situations: Applications and Further Developments,” in Review of
Progress in Quantitative NDE, D. O. Thompson and D. E. Chimenti, Eds., Plenum
Press, New York, NY, 15, pp. 57-64, 1996.
22. Mason, W. P. (ed) Physical Acoustics, Vol.1-Part A , Academic Press, New York, NY, 1964.
23. Neubauer, W. G., “A Summation Formula for Use in Determining the Reflection from Irregular Bodies,” J. Acoust. Soc. of Am., 35, pp. 279-285, 1963.
24. Johnson, D. M., “Model for Predicting the Reflection of Ultrasonic Pulses from a Body of Known Shape,” J. Acoust. Soc.of Am., 59, pp. 1319-1323, 1976.
25. Haines, N. F. and Langston, D. B., “Reflection of Ultrasonic Pulses from Surfaces,” J. Acoust. Soc. Am., 67, pp. 1443-1454, 1980.
26. Avestas, J. S., “Physical Optics Method in Electromagnetic Scattering”, J. Math. Phys., 21, pp. 290-299, 1980.
27. Sedov, A. and Schmerr, L. W., “Pulse Distortion and the Elastodynamic Kirchoff Approximation for Cracks: the Direct and Inverse Problems,” SIAM J. Appl. Math. 47, pp. 1201-1215, 1987.
28. Gubernatis, J. E., Domany, E., Krumhansl, J. A., and Hubermann, M.,“The Born Approximation in the Theory of Scattering of Elastic Waves by Flaws,” J. Appl. Phys. 48, pp. 2812-2819, 1977.
22
29. Gubernatis, J. E., Domany,E., and Krumhansl, J. A.,”Formal Aspects of the Theory of Scattering of Ultrasound by Flaws in Elastic Materials,” J. Appl. Phys., 48, pp. 2804-2811, 1977.
30. Hudson, J. A. and Heritage, J. R.,“The Use of the Born Approximation in Seismic Scattering Problems,” Geophys. J. Royal Astron. Soc., 66, pp. 221-240, 1981. 31. Rose, J. H., and Richardson, J. M., “Time Domain Born Approximation,” J.
Nondestructive, 3, pp. 45-53, 1982.
32. Rose, J. H., “Elastic Wave Inverse Scattering in Nondestructive Evaluation,” Pure Appl. Geophys., 131, pp. 715-739, 1989.
33. Achenbach, J. D., Gautesen, A. K., and McMaken, H., Ray Methods for Waves in
Elastic Solids, Pitman Books Ltd., Boston, 1982.
34. Ying, C. F. and Truell, R., “Scattering of a Plane Compressional Wave by a Spherical Obstacle in an Isotropic Elastic Solid,” J. Appl. Phys., 27, pp. 1086- 1097, 1956.
35. Tittmann, B., Thompson, D. O., and Thompson,R. B., "Standards for Quantitative NDE", Proceedings of Symposium on NDT Standards, May, 1976, Nondestructive
Testing Standards—A Review (STP 624) American Society for Testing and
Materials, Philadelphia, 1977.
36. Auld, B. A., “General Electromechanical Reciprocity Relations Applied to the Calculation of Elastic Wave Scattering Coefficients”, Wave Motion, 1 3-10, 1979. 37. Thompson, R. B. and Gray, T. A., “A Model Relating Ultrasonic Scattering
Through Liquid-Solid Interfaces to Unbounded Medium Scattering Amplitudes,” J. Acoust. Soc. Amer., 74, pp. 140-146, 1983.
38. Tittmann, B. R. and Elsley, R. K., “Experimental Measurements and Interpretation of Ultrasonic Scattering by Flaws,” in Proceedings of the ARPA/AFML Review of Progress in Quantitative NDE, Science Center, Rockwell International, AFML-TR-78-55, May, 1978, pp. 26-35.
39. Thompson, R. B., and Margetan, F. J., “Use of Elastodynamic Theories in the Stochastic Description of the Effects of Microstructure on Ultrasonic Flaw and Noise Signals,” Wave Motion, 36, pp. 347-365, 2002.
40. Oakley, C. G., “Calculation of Ultrasonic Transducer Signal-Noise Ratios Using the KLM Model,” IEEE Trans. Ultrasonics, Ferroelectrics, and Frequency Control,” 44, pp. 1018-1026, 1997.
41. Yalda-Mooshabad, Margetan, F. J., and Thompson, R. B., “Applying the 2D Random Walk Formalism to Predict Ultrasonic Grain Noise Distributions,” in
Review of Progress in Quantitative NDE, D. O. Thompson and D. E. Chimenti,
Eds., Plenum Press, New York, NY, 13B, pp. 347-365, 2002.
42. Ogilvy, J. A., Theory of Wave Scattering from Random Rough Surfaces, Institute of Physics Publishing, Bristol, England, 1991.
43. Margetan, F. J., Thompson, R. B., “Microstructural Noise in Titanium Alloys and its Influence on the Detectability of Hard –Alpha,” in Review of Progress in
Quantitative NDE, D. O. Thompson and D. E. Chimenti, Eds., Plenum Press, New
York, NY,11B, pp. 1717-1724, 1992.
44. Rose, J. H., “Ultrasonic Backscatter from Microstructure”, in Review of Progress in
Quantitative NDE, D. O. Thompson and D. E. Chimenti, Eds., Plenum Press, New
45. Rose, J. H., “Theory of Ultrasonic Backscatter for Multiphase Polycrystalline Solids,” in Review of Progress in Quantitative NDE, D. O. Thompson and D. E. Chimenti, Eds., Plenum Press, New York, NY, 12B, pp. 1719-1726, 1993. 46. Meeker, W. Q., Chan, V., Thompson, R. B., and Chiou, C. P., “A Methodology for
Predicting Probability of Detection for Ultrasonic Testing,” in Review of Progress
in Quantitative NDE”, D. O. Thompson and D. E. Chimenti, Eds., American
Institute of Physics, Melville, N.Y., 20B, pp. 1972-1978, 2001.
47. Rice, S. O., “Mathematical Analysis of Random Noise,” Bell Syst. Tech. Journ. 24, pp. 46-156, 1945.
48. Calmon, P., “Recent Developments in NDT Simulation,” Proc. World Congress on Ultrasonics, pp. 443-446, 2003.
49. Lhemery, A., Calmon, P., Lecoeur- Taibi., I., Railoon, R., and Paradis, L., “Modeling Tools for Ultrasonic Inspection of Welds,” NDT&E International, 33, pp. 499-513, 2000.
50. Bostrom, A., and Wirdelius, H.,“Ultrasonic Probe Modeling and Nondestructive Crack Detection,” J. Acoust. Soc. Am., 97, pp. 2836-2848, 1995.
51. Bostrom, A., “A Review of Hypersingular Integral Equation Method for Crack Scattering and Application to Modeling of Nondestructive Evaluation,”, Appl. Mech. Rev., 56, pp. 383-405, 2003.
52. Turnbull, A. and Garton, M., “Ultrasound Ray Tracing in Arbitrary Complex Geometries,” in Review of Progress in Quantitative NDE, D. O.Thompson and D. E. Chimenti, Eds., Plenum Press, New York, NY, 14A, pp. 1105-1110, 1995. 53. Garton, M., “Refining Automated Ultrasonic Inspections with Simulation Models,”
in Review of Progress in Quantitative NDE, D. O. Thompson and D. E. Chimenti,
Eds., Plenum Press, New York, NY, 17B, pp. 1825-1829, 1998.
54. Spies, M., Batra, N. K., Simmonds, K. E., and Mignogna, R. B., “Numerical Modeling and Imaging of Three Dimensional Transducer Fields in Anisotropic Materials,” in Review of Progress in Quantitative NDE, D. O. Thompson and D. E. Chimenti, Eds., Plenum Press, New York, NY 16A, pp. 837-851, 1997.
55. Spies, M. and Kroning, M.,“Elastic Wave Field Modeling for Arbitrarily Oriented Orthotropic Media,” in Review of Progess in Quantitative NDE, D. O. Thompson and D. E. Chimenti, Eds., Plenum Press, New York, NY, 17B, pp. 1163-1170, 1998.
56. Spies, M.,“Transducer Field Modeling in Anisotropic Media by Superposition of Gaussian Base Functions,” J. Acoust. Soc. Am., 105, pp. 633-638, 1999.
57. Marklein, R., “NDT–Related Quantitative Modeling of Coupled Piezoelectric and Ultrasonic Wave Phenomena,” Proc. 7th European Conference on NDT, pp. 1-44, 1998.
58. Marklein, R., Langenberg, K., and Mayer, K., “EFIT Simulations for Ultrasonic NDE”, NDT.net., March, 2003, vol. 8., No. 3, 1-6, 2003.
59. Yim, H. and Baek, E., “Two-Dimensional Numerical Modeling and Simulation of Ultrasonic Testing”, Journ. of the Korean Soc. for NDT, 22, pp. 649-658, 2002. 60. T. A. Gray, private communication.
61. Udpa, S. S. and Thompson, D. O., “Modeling of Benchmark Problems,” in Review
of Progress in QNDE, D. O. Thompson and D. E. Chimenti, Eds., 21B,pp.
1891-1893, AIP, Melville, NY, 2001.
24
62. Thompson, R. B., “Ultrasonic Benchmarking: Past Programs and Future Goals,” in
Review of Progress in QNDE, D. O. Thompson and D. E.Chimenti, Eds., 23B pp.
1529-1536, AIP, Melville, NY, 2004.
63. Burte, H. M. and Chimenti, D. E., “Unified Life Cycle Engineering: An Emerging Design Concept,” in Review of Progress in Quantitative NDE, D. O. Thompson and D. E. Chimenti, Eds., 6B, 1797-1812, Plenum Press, New York, NY, 1986.
64. Schmerr, L.W. and Thompson, D. O., “Incorporating Inspectability into Design: The New Role of NDE in Concurrent Engineering,” Proc. ASME/NDE Engineering Div. Topical Conference,“NDE’s Role in Concurrent Engineering,” SanAntonio, Texas, April 22-23, 1992.
65. Schmerr, L. W. and Thompson, D. O., “NDE Models and Design- A Unified Life Cycle Engineering Approach”, in Review of Progress in Quantitative NDE, D. O. Thompson and D. E. Chimenti, Eds., 13B, pp. 2183-2190, Plenum Press, New York, NY, 1994.
![FIGURE 2. Estimates of critical flaw sizes in some metal and ceramic systems. After Thompson and Evans [3] (© 1976 IEEE)](https://thumb-us.123doks.com/thumbv2/123dok_us/1446061.2693560/6.742.157.597.68.345/figure-estimates-critical-sizes-ceramic-systems-thompson-evans.webp)
![FIGURE 8. Standard ultrasonic system that is utilized in model discussion. After Schmerr [6]](https://thumb-us.123doks.com/thumbv2/123dok_us/1446061.2693560/10.742.220.514.67.272/figure-standard-ultrasonic-system-utilized-discussion-after-schmerr.webp)