Zurich Open Repository and Archive University of Zurich Main Library Strickhofstrasse 39 CH-8057 Zurich www.zora.uzh.ch Year: 2015
Biodiversity increases the resistance of ecosystem productivity to climate extremes
Isbell, Forest ; Craven, Dylan ; Connolly, John ; Loreau, Michel ; et al ; Schmid, Bernhard ; Niklaus, Pascal A
Abstract: It remains unclear whether biodiversity buffers ecosystems against climate extremes, which are becoming increasingly frequent worldwide1. Early results suggested that the ecosystem productivity of diverse grassland plant communities was more resistant, changing less during drought, and more resilient, recovering more quickly after drought, than that of depauperate communities2. However, subsequent experimental tests produced mixed results3, 4, 5, 6, 7, 8, 9, 10, 11, 12, 13. Here we use data from 46 experiments that manipulated grassland plant diversity to test whether biodiversity provides resistance during and resilience after climate events. We show that biodiversity increased ecosystem resistance for a broad range of climate events, including wet or dry, moderate or extreme, and brief or prolonged events. Across all studies and climate events, the productivity of low-diversity communities with one or two species changed by approximately 50% during climate events, whereas that of high-diversity communities with 16–32 species was more resistant, changing by only approximately 25%. By a year after each climate event, ecosystem productivity had often fully recovered, or overshot, normal levels of productivity in both high- and low-diversity communities, leading to no detectable dependence of ecosystem resilience on biodiversity. Our results suggest that biodiversity mainly stabilizes ecosystem productivity, and productivity-dependent ecosystem services, by increasing resistance to climate events. Anthropogenic environmental changes that drive biodiversity loss thus seem likely to decrease ecosystem stability14, and restoration of biodiversity to increase it, mainly by changing the resistance of ecosystem productivity to climate events.
DOI: https://doi.org/10.1038/nature15374
Posted at the Zurich Open Repository and Archive, University of Zurich ZORA URL: https://doi.org/10.5167/uzh-126029
Journal Article Accepted Version
Originally published at:
Isbell, Forest; Craven, Dylan; Connolly, John; Loreau, Michel; et al; Schmid, Bernhard; Niklaus, Pascal A (2015). Biodiversity increases the resistance of ecosystem productivity to climate extremes. Nature, 526(7574):574-577.
Biodiversity increases the resistance of ecosystem productivity to climate extremes
Forest Isbell1, Dylan Craven2,3, John Connolly4, Michel Loreau5, Bernhard Schmid6, Carl Beierkuhnlein7, T. Martijn Bezemer8, Catherine Bonin9, Helge Bruelheide2,10, Enrica de Luca6, Anne Ebeling11, John Griffin12, Qinfeng Guo13, Yann Hautier14, Andy Hector14, Anke Jentsch15, Jürgen Kreyling16, Vojtěch Lanta17, Pete Manning18, Sebastian T. Meyer19, Akira S. Mori20, Shahid Naeem21, Pascal A. Niklaus6, H. Wayne Polley22, Peter B. Reich23,24, Christiane Roscher2,25, Eric W. Seabloom1, Melinda D. Smith26, Madhav P. Thakur2,3, David Tilman1,27, Benjamin F. Tracy28, Wim H. van der Putten8,29, Jasper van Ruijven30, Alexandra Weigelt2,3, Wolfgang W. Weisser18, Brian Wilsey31, Nico Eisenhauer2,3
1Department of Ecology, Evolution and Behavior, University of Minnesota Twin Cities, Saint Paul, MN 55108, USA 2German Centre for Integrative Biodiversity Research (iDiv) Halle-Jena-Leipzig, Deutscher Platz 5e, 04103 Leipzig, Germany 3Institute of Biology, University of Leipzig, Johannisallee 21, 04103 Leipzig, Germany
4Ecological and Environmental Modelling Group, School of Mathematical Sciences, University College Dublin, Dublin 4, Ireland
5Centre for Biodiversity Theory and Modelling, Experimental Ecology Station, Centre National de la Recherche Scientifique, Moulis, 09200,
France
6Institute of Evolutionary Biology and Environmental Studies, University of Zurich, 8057 Zurich, Switzerland 7Department of Biogeography, BayCEER, University of Bayreuth, 95440 Bayreuth, Germany
8Department of Terrestrial Ecology, Netherlands Institute of Ecology (NIOO-KNAW), PO Box 50, 6700 AB Wageningen, The Netherlands 9
Department of Agronomy, Iowa State University, Ames, IA, USA
10Institute of Biology, Martin Luther University Halle-Wittenberg, Halle, Germany
11Institute of Ecology, Friedrich Schiller University Jena, Dornburger Strasse 159, 07743 Jena, Germany 12Department of Biosciences, Swansea University, Wales, UK
13USDA FS, Eastern Forest Environmental Threat Assessment Center, Asheville, NC, USA
14Ecology and Biodiversity Group, Department of Biology, Utrecht University, Padualaan 8, 3584 CH Utrecht, Netherlands 15Disturbance Ecology, BayCEER, University of Bayreuth, 95440 Bayreuth, Germany
16Institute of Botany and Landscape Ecology, Ernst-Moritz-Arndt University Greifswald, D-17487 Greifswald, Germany
17Department of Botany, Faculty of Sciences, University of South Bohemia, Branisovska 31, 37005 Ceske Budejovice, Czech Republic 18Institute for Plant Sciences, University of Bern, CH-3013 Bern, Switzerland
19Department of Ecology and Ecosystem Management, School of Life Sciences Weihenstephan, Technische Universität München, 85354
Freising, Germany
20Graduate School of Environment and Information Sciences, Yokohama National University, 79-7 Tokiwadai, Hodogaya, Yokohama,
Kanagawa, 240-8501, Japan
21Department of Ecology, Evolution, and Environmental Biology, Columbia University, New York, NY 10027, USA 22
USDA ARS, Grassland, Soil and Water Research Laboratory, Temple, TX 76502, USA
23Department of Forest Resources, University of Minnesota Twin Cities, Saint Paul, MN 55108 USA 24Hawkesbury Institute for the Environment, University of Western Sydney, Penrith, NSW 2753, Australia 25UFZ Helmholtz Centre for Environmental Research, Community Ecology, 06120 Halle, Germany
26Graduate Degree Program in Ecology and Department of Biology, Colorado State University, Fort Collins, CO, 80523, USA 27Bren School of Environmental Science and Management, University of California, Santa Barbara, CA 93106 USA 28Crop and Soil Environmental Sciences, Smyth Hall 0404, Virginia Tech, Blacksburg, VA 24061, USA
29Laboratory of Nematology, Wageningen University and Research Centre, PO Box 8123, 6700 ES Wageningen, The Netherlands 30Nature Conservation and Plant Ecology Group, Wageningen University, P.O. Box 47, 6700 AA Wageningen, The Netherlands 31Department of Ecology, Evolution and Organismal Biology, Iowa State University, Ames, IA 50011, USA
It remains unclear whether biodiversity buffers ecosystems against climate extremes, which
1
are becoming increasingly frequent worldwide1. Early results suggested that the ecosystem
2
productivity of diverse grassland plant communities was more resistant, changing less
3
during drought, and more resilient, recovering more quickly after drought, than that of
4
depauperate communities2. However, subsequent experimental tests produced mixed
5
results3-13. Here we use data from 46 grassland plant diversity experiments to test whether
6
biodiversity provides resistance during and resilience after climate events. We show that
7
biodiversity increased ecosystem resistance for a broad range of climate events, including
8
wet or dry, moderate or extreme, and brief or prolonged events. Across all studies and
9
climate events, the productivity of low diversity communities with one or two species
10
changed by approximately 50% during climate events, while that of high diversity
11
communities with 16 to 32 species was more resistant, changing only approximately 25%.
12
By a year after each climate event, ecosystem productivity had often fully recovered, or
13
overshot, normal levels of productivity in both high and low diversity communities, leading
14
to no detectable dependence of ecosystem resilience on biodiversity. Our results suggest
15
that biodiversity mainly stabilizes ecosystem productivity, and productivity-dependent
16
ecosystem services, by increasing resistance to climate events. Anthropogenic
17
environmental changes that drive biodiversity loss thus seem likely to decrease ecosystem
18
stability14, and restoration of biodiversity to increase it, mainly by changing the resistance
19
of ecosystem productivity to climate events.
20
Biodiversity stabilizes ecosystem productivity over time9,14-23; however, it remains
21
unclear whether it does so by providing resistance during climate events, resilience (sensu rapid
22
recovery24) after climate events, or both (Extended Data Fig. 1). Two decades ago, a seminal
23
study reported that the ecosystem productivity of diverse grassland plant communities was more
24
resistant and more resilient to a major drought than that of depauperate communities2. However,
25
this study had not experimentally manipulated biodiversity, which confounded variation in
26
biodiversity with variation in species composition and resource availability25. Hundreds of
27
biodiversity experiments were subsequently conducted26,27, but few of these studies revisited this
28
important question, and those that did so found mixed results3-13. Further analysis of the original
29
data also produced mixed results28. Thus, it remains unclear whether biodiversity buffers
30
ecosystems against climate extremes, which are becoming increasing frequent worldwide1.
31
We combined data from 46 experiments that manipulated grassland plant diversity and
32
measured productivity across Europe and North America (Extended Data Fig. 2; Extended Data
33
Table 1). We classified each year of each experiment as extremely dry, moderately dry, normal,
34
moderately wet, or extremely wet (Extended Data Figs 2 and 3) (Methods). To do this in a
35
globally consistent manner, we used a drought index that quantifies month-by-month variations
36
in water balance over the last century on 0.5 x 0.5 degree grids globally, based on measurements
37
at more than 4000 weather stations worldwide29,30 (Extended Data Figs 2 and 3). We defined
38
climate extremes (extremely dry or extremely wet) as events occurring less frequently than once
39
per decade, based on the historic climate at each site over the past century (Methods).
40
Moderately dry and wet events were defined as those that have historically occurred between
41
once in four years and once per decade. Normal years include the inter-quartile range of
42
observed water balances. Given these cutoffs, there were 18 extremely dry, 32 moderately dry,
43
87 normal, 37 moderately wet, and 21 extremely wet experiment years that occurred during these
44
biodiversity experiments (Extended Data Figs 2 and 3). Unsurprisingly, productivity tended to be
45
lower than normal during dry events and higher than normal during wet events (Extended Data
Fig. 4), though there were exceptions to this general trend (Extended Data Fig. 5). Productivity
47
overshot normal levels when recovering during the year after extreme (but not moderate) dry and
48
wet events (Extended Data Fig. 4), which is consistent with damped oscillations, rather than
49
monotonic recovery, of productivity following climate extremes (Extended Data Fig. 1).
50
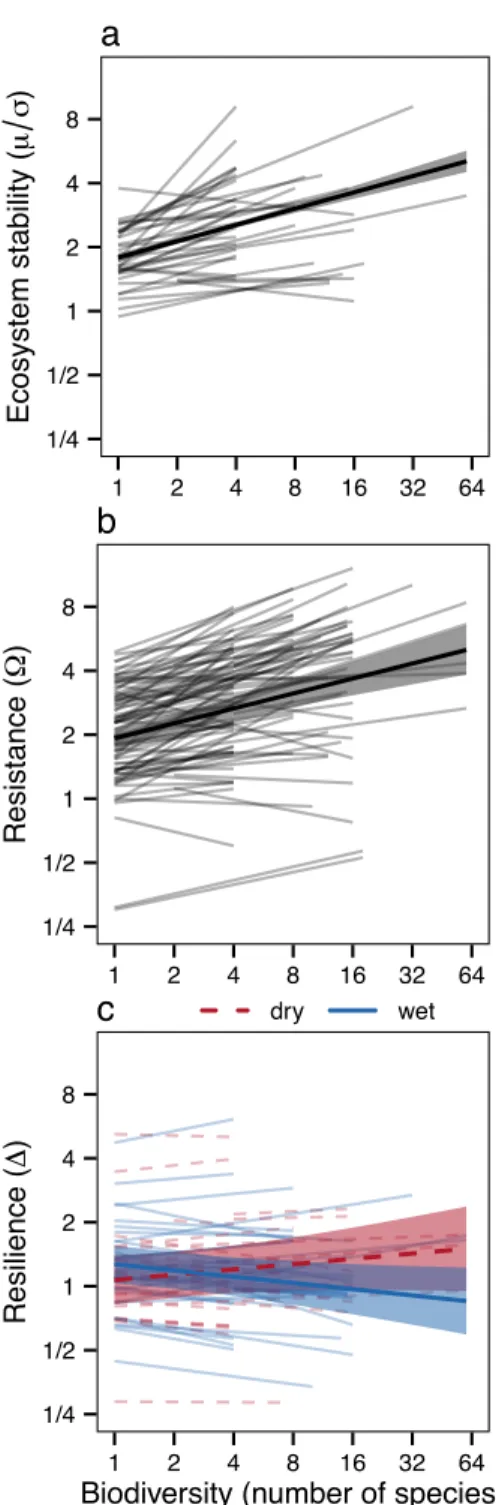
Consistent with previous studies9,14-23, biodiversity increased ecosystem stability (Fig. 1a; F1,37.4
51
= 28.74, P < 0.001).
52
We quantified resistance and resilience, here using proportional changes in productivity
53
from one year to the next, within each experimental unit (plot) for each observed climate event
54
(Methods). Linear mixed effects models were used to test whether resistance and resilience
55
depend on biodiversity, and how these biodiversity effects depend on climate event properties,
56
such as the direction (wet or dry), intensity (moderate or extreme), or duration (3 – 24 months) of
57
climate events, while accounting for repeated measurements (Methods).
58
Biodiversity increased the resistance of ecosystem productivity to a broad range of
59
climate events (Biodiversity main effect in Table 1; Fig. 1b). That is, more diverse communities
60
exhibited smaller proportional changes in productivity during climate events. On average, across
61
all studies and climate events, the productivity of low diversity communities with one or two
62
species changed by approximately 50% (Ω≈ 2, Fig. 1b), while that of high diversity
63
communities with 16 to 32 species changed by approximately 25% (Ω≈ 4, Fig. 1b), during
64
climate events. Biodiversity increased resistance irrespective of the direction (wet or dry) or
65
intensity (moderate or extreme) of climate events (all interactions were non-significant P > 0.05;
66
Table 1). There was, however, one marginally significant interaction: biodiversity may have
67
increased resistance more during moderate climate events than during extreme ones
68
(Biodiversity × Intensity interaction in Table 1; Extended Data Fig. 6). There was substantial
69
variability in the effect of biodiversity on resistance among studies and among years within
70
studies (see variance components in Table 1; Fig. 1b, Extended Data Fig. 7); however,
71
biodiversity increased resistance similarly in long-term studies that were conducted for at least
72
nine years, and in short-term studies (Methods).
73
Examination of the dynamics of recovery shows that, at both low and high diversity,
74
productivity had often returned to, or overshot, its normal level during the year after a climate
75
event (Extended Data Fig. 4). Given this rapidity of recovery for both low and high diversity
76
communities, biodiversity may not have a major impact on the recovery of ecosystem
77
productivity following climate events, at least over the time scales and climate event intensities
78
considered. Indeed, we were unable to detect strong and consistent effects of biodiversity on our
79
measure of ecosystem resilience (Table 1; Fig. 1c). Biodiversity decreased resilience after wet
80
events, and increased, though nonsignificantly (see confidence intervals for 12-month events
81
shown in Fig. 2), resilience after dry events (Biodiversity × Direction interaction in Table 1; Fig.
82
1c). That is, less diverse communities recovered closer to normal levels of productivity during
83
the year after wet events. On average, across all studies, climate events, and levels of
84
biodiversity, productivity moved approximately 10% closer to normal levels (Δ≈ 1.1; Fig. 1c)
85
during the year after climate events; however, this was often due to greatly overshooting, rather
86
than failing to reach, normal levels of productivity (Extended Data Fig. 4). The effect of
87
biodiversity on resilience did not vary substantially among studies or among years within studies
88
(see relatively small point estimates with large standard errors for Biodiversity variance
89
components in Table 1; Extended Data Fig. 8).
90
Next, we tested how our results depended on the duration over which climate events were
91
defined. To do so, we considered multiple versions of the drought index, which aggregate water
balances over different time scales, ranging from seasonal (3-months) to multi-year (24-months)
93
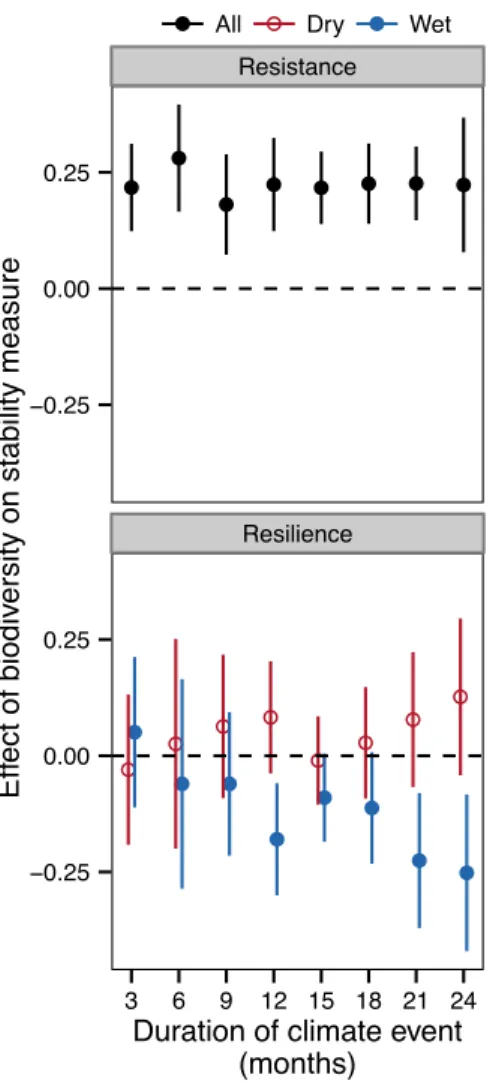
events30 (Methods). We found that biodiversity consistently increased the resistance of
94
ecosystem productivity during climate events, irrespective of the duration (3 – 24 months) of the
95
climate event (Fig. 2). Biodiversity had no significant effect on the resilience of ecosystem
96
productivity after brief, intra-annual wet or dry climate events (Fig. 2). Biodiversity decreased
97
resilience only after prolonged, wet climate events that lasted one year or more (Fig. 2). The
98
magnitudes of biodiversity effects on resistance were substantially larger than those on resilience
99
for all but the longest durations (Fig. 2).
100
It is difficult, or perhaps impossible, to fully disentangle the resistance and resilience
101
components of empirical time series, especially when there are frequent perturbations. For
102
example, resilience to the first of two consecutive climate events could bias estimates of
103
resistance to the second event. Similarly, resistance to the second of two consecutive climate
104
events could bias estimates of resilience to the first event. To explore how this might have
105
affected our results, we tested whether biodiversity effects on resistance differed between climate
106
events that were preceded either by normal or by other climate event years, and whether
107
biodiversity effects on resilience differed between climate events that were succeeded either by
108
normal or by climate event years (Methods). We found that biodiversity increased resistance,
109
especially during climate events that were preceded by climate event years (Biodiversity × 110
Consecutive interaction: F1,64.8 = 7.21, P < 0.01) (Extended Data Fig. 9), and that biodiversity did
111
not significantly impact resilience, regardless of whether a climate event was succeeded by a
112
normal year or another climate event (Biodiversity × Consecutive interaction: F1,39.6 = 2.42, P =
113
0.13). We also tested whether biodiversity significantly influenced resilience when considering
114
only climate events that were succeeded by multiple normal years in long-term studies that were
115
conducted for at least nine years, and with resilience quantified two, rather than one, year after
116
climate events (Methods). We again found no detectable effect of biodiversity on resilience
117
(F1,10.6 = 0.20, P = 0.66). Thus, biodiversity did not influence resilience after one or two years of
118
unperturbed recovery.
119
Our results suggest that greater biodiversity generally provides greater resistance. We
120
focused on dimensionless, proportional measures of resistance and resilience to allow
121
comparisons of communities with different levels of productivity. However, absolute measures
122
of resistance and resilience might be of interest for some applications within particular
123
communities, and do not necessarily depend on biodiversity in the same manner (Fig. 3;
124
Extended Data Figs 4 and 5). Given that biodiversity increases productivity, more productivity
125
could be lost during dry events, and gained back after dry events, in diverse than in depauperate
126
communities3,10. In this case, it is important to also note that our analyses show that biodiversity
127
increased productivity not only during normal years, but also during climate events (Fig. 3).
128
Our results suggest that biodiversity stabilizes ecosystem productivity, and likely also
129
productivity-dependent ecosystem services, during climate events that are moderate or extreme.
130
Anthropogenic environmental changes that drive biodiversity loss will likely decrease ecosystem
131
stability14 by decreasing the resistance of ecosystem productivity to climate events. Restoring
132
biodiversity will likely increase ecosystem resistance to climate extremes, which are forecast to
133
become increasingly frequent as the global climate continues to change.
134 135 136
Methods
137 138
Defining ecosystem stability measures. We define measures of resistance and resilience that
139
are: (1) dimensionless, and thus directly comparable between studies and communities with
140
different levels of productivity; (2) symmetric, and thus directly comparable between positive
141
and negative perturbations, such as wet and dry climate events; (3) applicable to dynamic
142
systems that exhibit either monotonic recovery or damped oscillations after a perturbation
143
(Extended Data Fig. 1). We define resistance as:
144
Ω≡ !!!
!!!!,
(M1) and resilience as:
∆≡ !!!!!! !!!!!!
, (M2)
where 𝑌!, Ye, and Ye+1 are respectively the expected ecosystem productivity during normal years
145
(mean across all non-climate event years), during a climate event, and during the year after a
146
climate event. Resistance indicates the proximity of productivity to normal levels during a
147
climate event. For example, if productivity is reduced during a drought to half its normal level,
148
then Ω = 2 (Extended Data Fig. 1). Resilience indicates the rate of return toward normal
149
productivity levels after a climate event. If a climate event lowers productivity, greater biomass
150
growth rates during recovery lead to greater resilience up until they are sufficiently rapid to lead
151
to full recovery of normal levels of productivity during the subsequent year. Any biomass growth
152
rates greater than this lead to progressively lower resilience because productivity overshoots its
153
normal level. Thus, consistent with stability measures used in theoretical biodiversity-stability
154
studies, this measure of resilience has a low value, indicating instability, when the deviation of
155
the system from normal productivity levels exponentially decays at a slow rate, either via
156
monotonic recovery or damped oscillations (Extended Data Fig. 1). For example, if during the
157
year following a climate event productivity recovers either from 50 to 75 % or from 50 to 125 %
158
of normal productivity levels, then productivity will have returned half way from perturbed to
159
normal levels, and Δ = 2 (Extended Data Fig. 1).The same is true for recovery in the opposite
160
direction after a positive deviation: that is, recovery from 150 to 125 % or from 150 to 75 % of
161
normal productivity levels would also give Δ = 2 (Extended Data Fig. 1).The points shown in
162
Extended Data Figure 1 are given by: yt=0 = 100, yt=1 = 100 - 100/ Ω, yt=11 = 100 + 100/ Ω, and,
163
for all other t, yt = 100 - (100 - yt-1)/ Δ for monotonic recovery or yt = 100 + (100 - yt-1)/ Δ for
164
damped oscillations, where y is productivity. We use a common measure of ecosystem stability,
165
quantified as the ratio of the mean to the standard deviation of productivity across years (µ/ σ).
166
This measure of ecosystem stability is dimensionless, and thus directly comparable between
167
studies and communities with different levels of productivity.
168 169
Identifying wet and dry climate events. Drought occurs when water availability remains below
170
normal levels over some period of time30. Identifying and quantifying droughts requires
171
consideration of water inputs (precipitation) and water losses (potential evapotranspiration).
172
Furthermore, doing so in a globally consistent manner requires standardization of spatially
173
explicit historical trends for water balances, to ensure that ‘normal’ and ‘extreme’ conditions are
174
consistently defined across sites. Finally, given that ecosystems need not similarly respond to
brief or prolonged droughts, it is often useful to consider water balances aggregated over a range
176
of short to long time scales.
177
We used the Standardized Precipitation-Evapotransporation Index (SPEI) to consistently
178
identify and quantify wet and dry climate events across field experiments over durations ranging
179
from 3 – 24 months. SPEI is a standard normal variable for water balances aggregated over a
180
given number of months at a particular location. SPEI values are based on month-by-month
181
variations in climate over the last century (January 1901 to December 2011), based on monthly
182
means of measurements made at more than 4000 weather stations worldwide, and provided on
183
0.5 x 0.5 degree grids globally. For example, a value of SPEI-12 = -1.28 for August 2005 at a
184
particular location would correspond to a level of annual (as indicated by the value of 12)
185
drought (as indicated by the negative value) that has historically occurred (between 1901 and
186
2011) once per decade at that location during the months of September to August (Extended
187
Data Figs 2 and 3). Similarly, SPEI-3 = 0.67 for August 2005 at a particular location would
188
correspond to a level of seasonal wetness that has historically occurred once every four years at
189
that particular site during the months of June to August (Extended Data Figs 2 and 3).
190
We extracted SPEI values from SPEIbase29 raster files for each peak biomass harvest at
191
each study site (Extended Data Figs 2 and 3). First, we considered annual water balances:
SPEI-192
12. Previous results suggest that primary productivity responds to approximately annual water
193
balances in temperate grasslands30. We classified experiment years as extremely dry, moderately
194
dry, normal, moderately wet, and extremely wet (Extended Data Figs 2 and 3). Extreme events
195
(extremely dry or extremely wet) were defined as those that historically occurred less frequently
196
than once per decade. Moderate events were defined as those that historically occurred between
197
once in four years and once per decade. Normal years were defined as those within the
inter-198
quartile range of historical water balances. Given these cutoffs, there were 18 extremely dry, 32
199
moderately dry, 87 normal, 37 moderately wet, and 21 extremely wet experiment years that
200
occurred during these biodiversity experiments (Extended Data Figs 2 and 3). Thus, 20% of the
201
experiment years (18 + 21 = 39 out of 195) were identified as extreme events, which corresponds
202
to extremely dry events that occur less than once per decade (10% of observations) plus
203
extremely wet events that occur less than once per decade (10% of observations). Note that there
204
is an unavoidable shifting baseline for comparisons when defining extreme climate events. If we
205
had defined climate extremes based only on data from the early (or late) 1900s, then we would
206
likely have identified more (or fewer) extreme climate events.
207
Next, we considered how the effects of biodiversity on resistance and resilience depended
208
on the duration over which water balances were aggregated. Specifically, we re-classified each
209
experiment year as extremely dry, moderately dry, normal, moderately wet, and extremely wet
210
years based on other versions of SPEI that aggregate water balances over shorter (3,
SPEI-211
6, SPEI-9) or longer (SPEI-15, SPEI-18, SPEI-21, SPEI-24) periods of time preceding peak
212
biomass harvests, and then re-fit mixed effects models.
213 214
Statistical analyses. We used linear mixed effects models to test whether resistance and
215
resilience depend on biodiversity, and how these biodiversity effects depend on climate event
216
properties, such as the direction (wet or dry), intensity (moderate or extreme), or duration (3 – 24
217
months) of climate events, while accounting for repeated measurements. Models were first fit for
218
annual (12-month) climate events (Table 1; Fig. 1), and then subsequently fit for shorter or
longer durations (Fig. 2). Fixed effects were included for Biodiversity, quantified as the
220
log2(treatment species richness); Direction, quantified as a binary variable: 0 = dry or 1 = wet;
221
and Intensity, quantified as a binary variable: 0 = moderate or 1 = extreme. All interactions were
222
initially included, and non-significant interactions (P > 0.1) were subsequently excluded.
223
Random effects were included for a Study factor; a Study × Biodiversity interaction; a Study × 224
Year interaction; a Study × Biodiversity × Year interaction, and a Plot (within Study) term. The
225
error structure accounted for repeated measurements within experimental units (plots) across
226
years. A first order autoregressive covariance structure provided a better fit than a compound
227
symmetry (split-plot-in-time) covariance structure, according to the Akaike Information
228
Criterion (AIC). For all models, the response variable was log2-transformed to meet model
229
assumptions.
230
Models were fit with the asreml function in the asreml package in R, and results were
231
extracted with the test.asreml function in the pascal package
(https://github.com/pascal-232
niklaus/pascal) in R. After model simplification, as described above based on significance of
233
fixed effects and AIC comparisons of random effect and covariance structures, fixed effects were
234
specified as: ~Biodiversity+Direction+Intensity+interaction (where interaction =
235
Biodiversity:Intensity for resistance and interaction = Biodiversity:Direction for resilience),
236
random effects as: ~Study/(Biodiversity*Year)+Plot, and the error structure as:
237
rcov=~id(Plot):ar1(Year). These mixed effects models were fit for annual resistance and
238
resilience (Fig. 1, Extended Data Figs 7 and 8), and for all eight durations of resistance and
239
resilience (Fig. 2). The model for productivity only differed in the specification of fixed effects,
240
with a factor for climate Event (levels of 'extreme dry', 'moderate dry', 'normal', 'moderate wet',
241
and 'extreme wet') instead of the Direction and Intensity terms (Fig. 3; Extended Data Figs 4 and
242
5). The Biodiversity × Event interaction was significant and retained in the productivity model
243
(Fig. 3).
244
Models were fit for resistance for all studies for which there were observations of
245
productivity during both normal and climate event years (Extended Data Figs 3 and 7). Models
246
for resilience were fit for all studies for which there were observations during normal, climate
247
event, and climate event years, except where the only normal year was also the only
post-248
event year because in this case 𝑌! = Ye+1 and resilience is undefined (Extended Data Figs 3 and
249
8).
250
Species richness treatments were randomly assigned to experimental units (plots).
251
Sample sizes were chosen within individual experiments (Extended Data Table 1) to ensure
252
adequate power to detect an effect of richness on productivity.
253 254
Testing whether biodiversity effects differed between short- and long-term studies. Given
255
that many of these studies were conducted for only a few years, we tested whether our results
256
differed between short- and long-term studies. We did so by adding a two-way Biodiversity × 257
Study Duration interaction, and a Study Duration main effect, to the models shown in Table 1,
258
where Study Duration was a binary variable with a value of one for the six studies conducted for
259
at least nine years (Extended Data Table 1), and a value of zero for all other studies. We found
260
similar results between short- and long-term studies, as indicated by non-significant interactions
261
between Biodiversity and Study Duration for both Resistance (F1,16.5 = 0.02, P = 0.90) and
262
Resilience (F1,23.7 = 0.66, P = 0.42).
264
Testing whether biodiversity effects differed between categorical versus continuous
265
measures of climate event intensity. We used a categorical specification of climate intensity
266
(moderate or extreme) throughout our manuscript because there were often complex nonlinear
267
relationships between biomass production and SPEI within sites (Extended Data Fig. 5).
268
However, our categorical specification incurs some information loss, and so we also tested
269
whether results were similar when the models shown in Table 1 were fit using the absolute value
270
of the SPEI-12 index in place of the binary Intensity variable. We found similar results when we
271
considered this continuous measure of climate event intensity. That is, biodiversity increased
272
resistance (F1,28.0 = 20.38, P < 0.001) and did not affect resilience (F1,8.5 = 0.66, P = 0.44).
273 274
Disentangling resistance and resilience. It is difficult, or perhaps impossible, to fully
275
disentangle the resistance and resilience components of empirical time series, especially when
276
there are frequent perturbations. For example, resilience to the first of two consecutive climate
277
events could bias estimates of resistance to the second event, and resistance to the second of two
278
consecutive climate events could bias estimates of resilience to the first event. To explore how
279
this affected our results, we added a two-way Biodiversity × Consecutive interaction to the
280
models shown in Table 1, and a main effect of Consecutive, where Consecutive was a binary
281
variable with a value of one indicating non-consecutive climate events (i.e., normal year before
282
event for resistance, normal year after event for resilience), and zero otherwise. We also tested
283
whether biodiversity significantly influenced resilience when considering only climate events
284
that were succeeded by multiple normal years in long-term studies that were conducted for at
285
least nine years, and with resilience quantified two, rather than one, year after climate events. To
286
do so, we re-fit the model shown in Table 1, but with resilience quantified using Ye+2rather than
287
Ye+1 in Equation M2.
288 289
Robustness of results to monoculture exclusion. Given that monocultures are rare in nature,
290
we tested whether our results depended on inclusion of monoculture plots. We found similar
291
results when we excluded monocultures. That is, biodiversity increased resistance and did not
292
significantly affect resilience when we refit the models shown in Table 1 after excluding
293
monocultures (Biodiversity effect on Resistance: F1,20.2 = 7.25, P = 0.014; Biodiversity effect on
294 Resilience: F1,4.4 = 0.21, P = 0.665). 295 296 References 297
1. Stocker, T. F. et al. IPCC 2013: Summary for Policy Makers. (Cambridge Univ Press, Cambridge, UK and New
298
York, NY, USA, 2013).
299
2. Tilman, D. & Downing, J. A. Biodiversity and stability in grasslands. Nature 367, 363-365 (1994).
300
3. Pfisterer, A. B. & Schmid, B. Diversity-dependent production can decrease the stability of ecosystem
301
functioning. Nature 416, 84-86 (2002).
302
4. Caldeira, M. C., Hector, A., Loreau, M. & Pereira, J. S. Species richness, temporal variability and resistance of
303
biomass production in a Mediterranean grassland. Oikos 110, 115-123 (2005).
304
5. Kahmen, A., Perner, J. & Buchmann, N. Diversity-dependent productivity in semi-natural grasslands following
305
climate perturbations. Funct. Ecol. 19, 594-601 (2005).
306
6. Steiner, C. F., Long, Z. T., Krumins, J. A. & Morin, P. J. Population and community resilience in multitrophic
307
communities. Ecology 87, 996-1007 (2006).
7. Wang, Y., Yu, S. & Wang, J. Biomass-dependent susceptibility to drought in experimental grassland
309
communities. Ecol. Lett. 10, 401-410 (2007).
310
8. Ives, A. R. & Carpenter, S. R. Stability and diversity of ecosystems. Science 317, 58-62 (2007).
311
9. Griffin, J. N. et al. in Biodiversity, Ecosystem Functioning, & Human Wellbeing: an ecological and economic
312
perspective (eds S. Naeem et al.) Ch. 6, 78-93 (Oxford University Press, 2009).
313
10. van Ruijven, J. & Berendse, F. Diversity enhances community recovery, but not resistance, after drought. J.
314
Ecol. 98, 81-86 (2010).
315
11. Vogel, A., Scherer-Lorenzen, M. & Weigelt, A. Grassland resistance and resilience after drought depends on
316
management intensity and species richness. PLoS ONE 7, e36992-e36992 (2012).
317
12. Grossiord, C. et al. Tree diversity does not always improve resistance of forest ecosystems to drought. Proc.
318
Natl. Acad. Sci. U. S. A. 111, 14812-14815 (2014).
319
13. Wright, A. J. et al. Flooding disturbances increase resource availability and productivity but reduce stability in
320
diverse plant communities. Nat. Commun. 6 (2015).
321
14. Hautier, Y. et al. Anthropogenic environmental changes affect ecosystem stability via biodiversity. Science 348,
322
336-340 (2015).
323
15. McNaughton, S. J. Diversity and stability of ecological communities: a comment on the role of empiricism in
324
ecology. Am. Nat. 111, 515-525 (1977).
325
16. Naeem, S. & Li, S. Biodiversity enhances ecosystem reliability. Nature 390, 507-509 (1997).
326
17. Bai, Y. F., Han, X. G., Wu, J. G., Chen, Z. Z. & Li, L. H. Ecosystem stability and compensatory effects in the
327
Inner Mongolia grassland. Nature 431, 181-184 (2004).
328
18. Tilman, D., Reich, P. B. & Knops, J. M. H. Biodiversity and ecosystem stability in a decade-long grassland
329
experiment. Nature 441, 629-632 (2006).
330
19. Balvanera, P. et al. Quantifying the evidence for biodiversity effects on ecosystem functioning and services.
331
Ecol. Lett. 9, 1146-1156 (2006).
332
20. Hector, A. et al. General stabilizing effects of plant diversity on grassland productivity through population
333
asynchrony and overyielding. Ecology 91, 2213-2220 (2010).
334
21. de Mazancourt, C. et al. Predicting ecosystem stability from community composition and biodiversity. Ecol.
335
Lett. 16, 617-625 (2013).
336
22. Polley, H. W., Isbell, F. I. & Wilsey, B. J. Plant functional traits improve diversity-based predictions of
337
temporal stability of grassland productivity. Oikos 122, 1275-1282 (2013).
338
23. Gross, K. et al. Species richness and the temporal stability of biomass production: A new analysis of recent
339
biodiversity experiments. The American Naturalist 183, 1-12 (2014).
340
24. Pimm, S. L. The complexity and stability of ecosystems. Nature 307, 321-326 (1984).
341
25. Huston, M. A. Hidden treatments in ecological experiments: re-evaluating the ecosystem function of
342
biodiversity. Oecologia 110, 449-460 (1997).
343
26. Cardinale, B. J. et al. The functional role of producer diversity in ecosystems. Am. J. Bot. 98, 572-592 (2011).
344
27. Tilman, D., Isbell, F. & Cowles, J. M. Biodiversity and ecosystem functioning. Annual Review of Ecology,
345
Evolution, and Systematics 45, 471-493 (2014).
346
28. Tilman, D. Biodiversity: population versus ecosystem stability. Ecology 77, 350-363 (1996).
347
29. Begueria, S., Vicente-Serrano, S. M. & Angulo-Martinez, M. A multiscalar global drought dataset: The
348
speibase a new gridded product for the analysis of drought variability and impacts. Bulletin of the American
349
Meteorological Society 91, 1351-1354 (2010).
350
30. Vicente-Serrano, S. M. et al. Response of vegetation to drought time-scales across global land biomes. Proc.
351
Natl. Acad. Sci. U. S. A. 110, 52-57 (2013).
352 353
Acknowledgements This project was supported by a grant from the Synthesis Centre for Biodiversity Sciences (sDiv) at the German Centre for Integrative Biodiversity Research (iDiv) Halle-Jena-Leipzig, funded by the German Science Foundation (FZT 118). F.I. was supported by Cedar Creek Ecosystem Science Reserve. M.L. was supported by the TULIP Laboratory of Excellence (ANR-10-LABX-41). B.S. and P.A.N. were supported by the URPP Global Change and Biodiversity of the University of Zurich.
Author Contributions: F.I. and N.E. conceived the project; F.I., D.C., J.C., M.L., H.B., A.E., J.N.G., Y.H., A.H., P.M., S.T.M., A.M., K.E.M., S.N., C.R., E.S., M.P.T., J.vR., A.W., W.W., B.W., and N.E. developed the project at a workshop; F.I. and M.L. defined dimensionless measures of resistance and resilience; F.I., D.C., J.C., B.S., C.B., M.B., C.B., H.B., E.dL., Q.G., A.H., A.J., J.K., V.L., S.T.M., H.W.P., P.B.R., C.R., D.T., B.T., W. vdP., J.vR., A.W., W.W., B.W., and N.E. contributed experimental data; D.C. assembled data; F.I. analyzed data, with substantial input from J.C. and B.S.; and F.I. wrote the paper, with substantial input from all authors.
Author Information: Reprints and permissions information is available at
www.nature.com/reprints. The authors declare no competing financial interests. Readers are welcome to comment on the online version of the paper. Correspondence and requests for materials should be addressed to F.I. ([email protected]).
Table 1 | Fixed effect tests and variance component estimates (standard error) for linear mixed effects models.
Resistance Resilience Fixed effects Biodiversity (B) F1,27.8 = 20.68*** F1,8.5 = 0.67 Direction (D) F1,81.7 = 0.53 F1,56.9 = 0.15 Intensity (I) F1,85.6 = 1.40 F1,57.7 = 2.36 B × I F1,82.3 = 3.02^ B × D F1,46.1 = 6.52* Variance components Study 0.37 (0.15) 1.4 × 10⁻⁶ (3.5 × 10⁻⁸) Study × Biodiversity 0.041 (0.022) 0.0067 (0.0096) Study × Year 0.32 (0.074) 0.68 (0.15) Study × Biodiversity × Year 0.033 (0.011) 0.018 (0.012) Plot 0.25 (0.038) 9.6 × 10⁻⁷ (2.3 × 10⁻⁸) Plot × Year 2.1 (0.051) 4.1 (0.099)
Temporal autocorrelation
ρAR1 0.12 (0.025) -0.41 (0.020)
^P < 0.1; *P < 0.05; **P < 0.01; ***P < 0.001; D = direction (0 = dry, 1 = wet); I = intensity (0 = moderate, 1 = extreme); B = biodiversity: log2(number of species); Study = factor; Year = factor; Plot is defined within studies; both response variables were log2 transformed;
non-significant (P > 0.1) interactions were excluded from the model; Kenward Rogers approximation is given for denominator degrees of freedom.
Figure 1 | Biodiversity consistently increases ecosystem stability (a) and resistance (b), but
inconsistently affects the resilience (c), of ecosystem productivity. Lines are mixed effects model fits for each study (a), or each climate event within each study (b, c) (thin lines), or across climate events and studies (thick lines with bands indicating 95% c.i.). Thick lines and bands in (c) indicate trends averaged across both moderate and extreme events for either dry (dashed red lines) or wet (solid blue lines) events. Values on the y-axis are unitless. Axes are logarithmic. See Table 1 for test statistics and Extended Data
Table 1 for sample sizes.
1/4 1/2 1 2 4 8 1 2 4 8 16 32 64 Ecosystem stability ( µ σ ) a 1/4 1/2 1 2 4 8 1 2 4 8 16 32 64 Resistance ( Ω ) b 1/4 1/2 1 2 4 8 1 2 4 8 16 32 64
Biodiversity (number of species)
Resilience (
∆
)
Figure 2 | Effects of biodiversity on stability measures with climate events defined over shorter or longer durations. Biodiversity consistently increases resistance; however, the strength and direction of biodiversity effects on resilience depend on the direction (wet or dry) and duration of climate events. Values shown are parameter estimates and 95% c.i. for biodiversity effects from mixed effects models, with the 12-month values corresponding to the results shown in Table 1 and Figure 1. For clarity, values in lower panel are slightly offset on the x-axis. See Extended Data Table 1 for sample sizes.
● ● ● ● ● ● ● ● ● ● ● ● ● ● ● ● ● ● ● ● ● ● ● ● Resistance Resilience −0.25 0.00 0.25 −0.25 0.00 0.25 3 6 9 12 15 18 21 24
Duration of climate event (months)
Eff
ect of biodiv
ersity on stability measure
Figure 3 | Biodiversity effects on productivity during climate events or normal years. Lines are mixed effects model fits for each year within each study (thin lines) or across all years and studies (thick lines with bands indicating 95% c.i.). See Extended Data Fig. 5 for results within studies. There was a significant effect of biodiversity on productivity (F1,30.6 = 202.4, P < 0.001), a significant effect of Event
(F4,139.5 = 6.86, P < 0.001), and a significant Biodiversity × Event interaction (F4,124.3 = 3.23, P = 0.015).
Axes are logarithmic. See Extended Data Table 1 for sample sizes.
16 64 256 1024 1 2 4 8 16 32 64 Number of species Productivity (g m − 2 y − 1 ) moderate dry extreme dry normal moderate wet extreme wet
Extended Data Table 1.Study details.
Study Years # Years
Month of peak
biomass harvest # Plots
Levels of species richness Agrodiversity Belgium 2003-2005 3 11 30 1,4 Agrodiversity Canada 2005-2007 3 8 30 1,4 Agrodiversity France 2004-2006 3 10 30 1,4 Agrodiversity Germany a 2005-2006 2 10 30 1,4 Agrodiversity Iceland a 2003-2005 3 8 30 1,4 Agrodiversity Iceland b 2004-2006 3 8 30 1,4 Agrodiversity Ireland a 2004-2006 3 11 29 1,4 Agrodiversity Italy 2003-2005 3 12 30 1,4 Agrodiversity Lithuania a 2003-2005 3 10 30 1,4 Agrodiversity Lithuania b 2004-2006 3 10 30 1,4 Agrodiversity Lithuania c 2004-2006 3 10 30 1,4 Agrodiversity Netherlands 2004-2006 3 10 30 1,4 Agrodiversity Norway a 2004-2006 3 8 30 1,4 Agrodiversity Norway b 2003-2005 3 9 30 1,4 Agrodiversity Norway c 2003-2005 2 10 30 1,4 Agrodiversity Norway d 2004-2006 3 8 30 1,4 Agrodiversity Poland a 2004-2006 3 10 30 1,4 Agrodiversity Spain a 2004-2006 3 7 30 1,4 Agrodiversity Sweden a 2003-2005 3 9 30 1,4 Agrodiversity Sweden b 2004-2006 3 9 30 1,4 Agrodiversity Sweden c 2004-2006 3 9 30 1,4 Agrodiversity Switzerland 2003-2005 3 10 30 1,4 Agrodiversity Wales a 2003-2006 4 10 30 1,4 Agrodiversity Wales b 2004-2006 3 11 30 1,4 BIODEPTH Germany 1996-1998 3 8 60 1,2,4,8,16 BIODEPTH Greece 1997-1999 3 5 52 1,2,4,8,18 BIODEPTH Ireland 1996-1998 3 8 70 1,2,3,4,8 BIODEPTH Portugal 1997-1999 3 5 56 1,2,4,8,14 BIODEPTH Sheffield UK 1996-1998 3 9 54 1,2,4,8,12 BIODEPTH Silwood UK 1996-1998 3 9 66 1,2,4,8,11 BIODEPTH Sweden 1996-1998 3 8 58 1,2,4,8,12 BIODEPTH Switzerland 1995-1997 3 8 64 1,2,4,8,32 Cedar Creek BioCON 1998-2011 14 8 74 1,4,9,16 Cedar Creek Biodiversity 1996-2011 16 8 168 1,2,4,8,16
Czech Republic 2003-2005 3 6 96 1,3,6,12 EVENT 2005-2010 6 9 15 2,4 Iowa BioGEN 2007-2009 3 8 64 1,4 Jena 2003-2011 9 9 82 1,2,4,8,16,60 North Dakota a 2003-2005 3 8 15 2,8,16 North Dakota b 2003-2005 3 8 15 2,8,16 North Dakota c 2003-2005 3 8 15 2,8,16 Texas Evenness 2001-2010 10 10 75 1,2,4,8 Texas MEND 2008-2010 3 10 52 1,9 Virginia 2008-2011 4 8 64 1,2,4,6,10 Wageningen Biodiversity 2000-2010 11 8 102 1,2,4,8 Wageningen CLUE 1996-2007 12 8 10 4,15
Extended Data Figure 1 | Contrasting ecosystem productivity responses to climate
events for low or high levels of resistance (Ω)
and resilience (Δ). In these stylized examples,
productivity is decreased by a dry climate event during year one, is increased by a wet climate event during year 11, and is otherwise
recovering back toward normal productivity levels either monotonically (black dashed lines and open triangles) or via damped oscillations (solid grey lines and filled circles). Ecosystem stability (µ / σ) depends on both resistance and resilience. See Methods for definitions of resistance and resilience.
lower resistance Ω=2 higher resistance Ω=4
● ● ● ● ● ● ● ● ● ● ● ● ● ● ● ● ● ● ● ● ● ● ● ● ● ● ● ● ● ● ● ● ● ● ● ● ● ●● ● ● ● ● ● ● ● ● ● ● ● ● ● ● ● ● ● ● ● ● ● ● ● ● ● ● ● ● ● ●● ● ● ● ● ● ● ● ● ● ● ● ● ● ● 50 75 100 125 150 50 75 100 125 150 lo w er resilience ∆ = 1.2 higher resilience ∆ = 2 0 5 10 15 20 0 5 10 15 20 Year Productivity (arbitr ar y units) µ σ= 3.5 µ σ= 6.9 µ σ= 5.3 µ σ= 10.7
Extended Data Figure 2 | Map of study site locations (top) and frequency of climate events (bottom).Top: Locations for all 46 studies (yellow triangles) and an example of spatial variation in water
balance, where SPEI-12 was classified as in the bottom panel. August 2005 was chosen for this example because many experiments were underway and harvested during this particular month of this particular year (Extended Data Table 1). The spatial patterns of wet and dry climate events
shown on this map would differ at other times (i.e., during a different month or year) and for climate events defined over other durations (i.e., based on water balances aggregated over more or fewer than the preceding 12 months). There were multiple experiments at some sites (Extended Data Table 1), and thus some symbols completely overlap on this map. Bottom: Cutoffs for bins correspond to events occurring every one in four years (± 0.67) or every one in ten years (± 1.28). 20 40 60 −80 −40 0 Longitude Latitude
extreme dry moderate dry normal moderate wet extreme wet
0 25 50 75
−1.28 −0.67 0.67 1.28
Drought index (SPEI−12)
Exper
iment y
ears
Extended Data Figure 3 | Classification of extreme dry, moderate dry, normal, moderate wet, and extreme wet years for each year of the 46 experiments. The 12-month version of the standardized
precipitation-Evapotranspiration Index (SPEI) is shown, where positive values indicate wetter than normal water balances (precipitation minus potential
evapotranspiration) during the 12-month time interval preceding and including the month of peak biomass harvest. For example, if peak biomass was harvested in September, then SPEI-12 accounts for the water balance from the previous October to September. Drought index values are based on month-by-month variations in climate
over the last century (January 1901 to December 2011), based on monthly means of measurements made at more than 4000 weather stations worldwide, and provided on 0.5 x 0.5 degree grids globally. Dashed lines show cutoffs for one in four (± 0.67) or one in ten (± 1.28) year events. Seven
experiments that included only normal years (Agrodiversity Germany a, Agrodiversity Ireland a, Czech Republic) or that did not include any normal years (Agrodiversity Poland a, Agrodiversity Spain a, Iowa BioGEN, North Dakota a) were excluded from subsequent analyses because it was not possible to compare perturbed to normal productivity levels for these studies.
● ● ● ● ● ● ● ●● ●● ● ● ● ● ●● ● ● ● ● ●● ● ● ● ● ●● ● ●● ● ●● ● ● ● ●● ● ● ● ● ● ● ●● ● ● ● ● ● ● ● ● ● ● ● ● ● ● ● ● ● ● ● ● ● ● ● ● ● ● ● ●● ● ● ● ● ● ● ● ● ● ●● ● ● ● ● ● ●● ●● ● ● ● ● ●●● ● ● ● ● ● ● ● ●● ● ● ● ● ●●● ● ● ● ● ● ● ● ● ● ● ● ●● ● ● ●● ● ●● ● ● ● ● ● ● ● ● ● ● ● ● ● ● ● ● ● ● ● ● ● ● ● ● ● ● ● ● ● ●● ● ●● ● ● ● ● ● ●● ● ● ● ● ● ● ●● ● ● ● ● ● ●
Agrodiversity Belgium Agrodiversity Canada Agrodiversity France Agrodiversity Germany a Agrodiversity Iceland a Agrodiversity Iceland b Agrodiversity Ireland a Agrodiversity Italy
Agrodiversity Lithuania a Agrodiversity Lithuania b Agrodiversity Lithuania c Agrodiversity Netherlands Agrodiversity Norway a Agrodiversity Norway b Agrodiversity Norway c Agrodiversity Norway d
Agrodiversity Poland a Agrodiversity Spain a Agrodiversity Sweden a Agrodiversity Sweden b Agrodiversity Sweden c Agrodiversity Switzerland Agrodiversity Wales a Agrodiversity Wales b
BIODEPTH Germany BIODEPTH Greece BIODEPTH Ireland BIODEPTH Portugal BIODEPTH Sheffield UK BIODEPTH Silwood UK BIODEPTH Sweden BIODEPTH Switzerland
Cedar Creek BioCON Cedar Creek Biodiversity Czech Republic EVENT Iowa BioGEN Jena North Dakota a North Dakota b
North Dakota c Texas Evenness Texas MEND Virginia Wageningen Biodiversity Wageningen CLUE −2 −1 0 1 2 −2 −1 0 1 2 −2 −1 0 1 2 −2 −1 0 1 2 −2 −1 0 1 2 −2 −1 0 1 2 1995 2000 2005 2010 1995 2000 2005 2010 1995 2000 2005 2010 1995 2000 2005 2010 1995 2000 2005 2010 1995 2000 2005 2010 Year Drought inde x (SPEI − 12)
Extended Data Figure 4 | Productivity during and after both climate events and normal years for monocultures and mixtures of 16 species. Values shown are predicted means and 95% c.i. from the mixed effects model. Productivity tends to be decreased during dry events and
increased during wet events. This trend is reversed during the year after climate events. This pattern of overshooting normal levels of productivity during recovery one year after climate events is consistent with damped oscillations, rather than monotonic recovery (Extended Data Fig. 1). Relatively high productivity following extreme
droughts could be due to increased nutrient availability and/or decreased abundance of herbivores as a result of reduced plant
productivity during the drought. This might be especially true for low diversity
communities, which have the lowest productivity during drought, possibly explaining why biodiversity increases resilience after extremely dry years (Fig. 1c). Similarly, relatively low productivity following extremely wet years might be due to decreased nutrient availability and/or increased abundance of enemies as a result of increased plant productivity during the wet event. This might be especially true for high diversity communities, which have the highest productivity during wet years, possibly explaining why biodiversity decreases resilience after extremely wet years (Fig. 1c). Dashed horizontal lines show normal productivity levels.
during event
one year after event 0 250 500 750 0 250 500 750 1 16 1 16 1 16 1 16 1 16
Biodiversity (number of species)
Productivity (g m
−
2 y
−
1 )
Extended Data Figure 5 | Biodiversity– productivity relationships for each year of each study, including normal years and
climate events. Points are plot-level values and lines are mixed model fits (Fig. 3).
Agrodiversity Belgium Agrodiversity Canada Agrodiversity France Agrodiversity Iceland a Agrodiversity Iceland b Agrodiversity Italy Agrodiversity Lithuania a Agrodiversity Lithuania b
Agrodiversity Lithuania c Agrodiversity Netherlands Agrodiversity Norway a Agrodiversity Norway b Agrodiversity Norway c Agrodiversity Norway d Agrodiversity Sweden a Agrodiversity Sweden b
Agrodiversity Sweden c Agrodiversity Switzerland Agrodiversity Wales a Agrodiversity Wales b BIODEPTH Germany BIODEPTH Greece BIODEPTH Ireland BIODEPTH Portugal
BIODEPTH Sheffield UK BIODEPTH Silwood UK BIODEPTH Sweden BIODEPTH Switzerland Cedar Creek BioCON Cedar Creek Biodiversity EVENT Jena
North Dakota b North Dakota c Texas Evenness Texas MEND Virginia Wageningen Biodiversity Wageningen CLUE 0 200 400 0 100 200 300 0 100 200 300 400 500 0 100 200 300 0 100 200 0 50 100 150 200 250 0 100 200 300 0 100 200 300 0 100 200 300 0 300 600 900 0 100 200 300 400 500 100 200 300 400 500 100 200 300 100 200 300 400 0 100 200 300 0 100 200 300 0 100 200 300 400 500 0 50 100 150 0 100 200 300 400 0 100 200 400 800 1200 1600 0 300 600 900 0 300 600 900 1200 0 300 600 900 0 300 600 900 1200 0 500 1000 0 250 500 750 250 500 750 1000 1250 0 500 1000 0 250 500 750 100 200 300 400 500 0 500 1000 1500 0 100 200 300 0 100 200 300 400 0 500 1000 1500 2000 0 500 1000 1500 0 1000 2000 3000 4000 0 250 500 750 250 500 750 1000 1250 1 2 3 4 1 2 3 4 1 2 3 4 1 2 3 4 1 2 3 4 1 2 3 4 1 2 3 4 1 2 3 4 1 2 3 4 1 2 3 4 1 2 3 4 1 2 3 4 1 2 3 4 1 2 3 4 1 2 3 4 1 2 3 4 1 2 3 4 1 2 3 4 1 2 3 4 1 2 3 4 4 8 12 16 5 10 15 2 4 6 8 5 10 2.5 5.0 7.5 10.0 12.5 3 6 9 2.5 5.0 7.5 10.0 12.5 0 10 20 30 4 8 12 16 4 8 12 16 2.0 2.5 3.0 3.5 4.0 0 20 40 60 4 8 12 16 4 8 12 16 2 4 6 8 2.5 5.0 7.5 2.5 5.0 7.5 10.0 2 4 6 8 6 9 12 15 Number of species Productivity (g m − 2 y − 1)
Extended Data Figure 6 | A marginally significant interaction between Biodiversity and Intensity (moderate or extreme) is shown (Table 1), which indicates that productivity was marginally more resistant
to moderate than to extreme climate events, especially at high biodiversity. All other interactions were non-significant (P > 0.10). Axes are logarithmic.
1/4 1/2 1 2 4 8 1 2 4 8 16 32 64 Number of species Resistance ( Ω ) moderate extreme
Extended Data Figure 7 | Biodiversity effects on the resistance of productivity to climate extremes for each study for which there were observations of productivity
during both normal (𝑌!) and climate event
(Ye) years (Extended Data Fig. 3). Points are
plot-level values and lines are mixed model fits (Fig. 1b). Axes are logarithmic.
Agrodiversity Belgium Agrodiversity Canada Agrodiversity France Agrodiversity Iceland a Agrodiversity Iceland b Agrodiversity Italy Agrodiversity Lithuania a Agrodiversity Lithuania b
Agrodiversity Lithuania c Agrodiversity Netherlands Agrodiversity Norway a Agrodiversity Norway b Agrodiversity Norway c Agrodiversity Norway d Agrodiversity Sweden a Agrodiversity Sweden b
Agrodiversity Sweden c Agrodiversity Switzerland Agrodiversity Wales a Agrodiversity Wales b BIODEPTH Germany BIODEPTH Greece BIODEPTH Ireland BIODEPTH Portugal
BIODEPTH Sheffield UK BIODEPTH Silwood UK BIODEPTH Sweden BIODEPTH Switzerland Cedar Creek BioCON Cedar Creek Biodiversity EVENT Jena
North Dakota b North Dakota c Texas Evenness Texas MEND Virginia Wageningen Biodiversity Wageningen CLUE 4 1 4 1/4 1 4 1/4 1 4 16 1 4 16 1/4 1 4 16 1 4 16 1 4 16 64 1 4 16 64 256 1/4 1 4 16 64 4 1 4 16 1 4 16 1 4 16 64 1/4 1 4 16 1/4 1 1 4 1/4 1 4 4 4 1/4 1 4 16 64 256 1/256 1/64 1/16 1/4 1 4 16 1 4 16 64 1/4 1 4 1 4 16 64 1/16 1/4 1 4 16 64 256 1/16 1/4 1 4 16 1/4 1 4 16 64 1/16 1/4 1 4 16 64 256 1 4 16 64 256 1024 4 16 1/4 1 4 16 64 256 1/4 1 4 1 4 16 64 1/16 1/4 1 4 16 64 256 1024 1/16 1/4 1 4 16 64 1/16 1/4 1 4 16 64 256 1/4 1 4 16 64 256 4 16 64 1 2 4 8 16 32 64 1 2 4 8 16 32 64 1 2 4 816 32 64 1 2 4 816 32 64 1 2 4 816 32 64 1 2 4 8 16 32 64 1 2 4 8 16 32 64
Biodiversity (number of species)
Resistance (
Ω
)
Extended Data Figure 8 | Biodiversity effects on the resilience of productivity to climate extremes for each of the studies for which there were observations during normal (𝑌!), climate event (Ye), and
post-climate event (Ye+1) years. Quantifying
resilience requires more information (i.e.,
Ye+1) than quantifying resistance, and thus
we were unable to quantify resilience for eight of the studies shown in Extended Data Fig. 7. Specifically, we were unable to
quantify resilience for studies where the only climate event occurred during the last year of the study (Extended Data Fig. 3) because in this case Ye+1 is unknown, and for
studies where the only normal year was also the only post-event year (Extended Data Fig. 3) because in this case 𝑌! = Ye+1 and
resilience is undefined. Points are plot-level values and lines are mixed model fits (Fig. 1c). Axes are logarithmic.
Agrodiversity Belgium Agrodiversity Canada Agrodiversity France Agrodiversity Iceland a Agrodiversity Iceland b Agrodiversity Italy Agrodiversity Lithuania b Agrodiversity Lithuania c
Agrodiversity Netherlands Agrodiversity Norway a Agrodiversity Norway b Agrodiversity Norway d Agrodiversity Sweden a Agrodiversity Sweden b Agrodiversity Switzerland Agrodiversity Wales a
BIODEPTH Germany BIODEPTH Greece BIODEPTH Ireland BIODEPTH Portugal BIODEPTH Silwood UK BIODEPTH Switzerland Cedar Creek BioCON Cedar Creek Biodiversity
EVENT Jena Texas Evenness Texas MEND Virginia Wageningen Biodiversity Wageningen CLUE 1/4 1 1/4 1 4 1/4 1 4 1/4 1 4 16 1 4 16 1/16 1/4 1 1/16 1/4 1 4 16 1/16 1/4 1 4 1 4 16 1 4 16 1/16 1/4 1 4 1/64 1/16 1/4 1 1/16 1/4 1 4 4 16 1 4 16 64 256 1 1/64 1/16 1/4 1 4 16 64 1/4 1 4 1/16 1/4 1 4 16 1/4 1 4 16 1/64 1/16 1/4 1 4 16 1/16 1/4 1 4 16 64 256 1024 1/256 1/64 1/16 1/4 1 4 16 64 1/1024 1/256 1/64 1/16 1/4 1 4 16 64 256 1024 1/4 1 4 16 64 1/64 1/16 1/4 1 4 16 64 256 1024 1/1024 1/256 1/64 1/16 1/4 1 4 16 64 256 1/16 1/4 1 4 16 1/256 1/64 1/16 1/4 1 4 16 64 1/64 1/16 1/4 1 4 16 64 1/16 1/4 1 4 16 64 1 2 4 8 16 32 64 1 2 4 8 16 32 64 1 2 4 8 16 32 64 1 2 4 8 16 32 64 1 2 4 8 16 32 64 1 2 4 8 16 32 64 1 2 4 8 16 32 64 Biodiversity (number of species)
Resilience (
∆
)
Extended Data Figure 9 | Biodiversity effects on the resistance of productivity to climate events that were preceded by either a climate event (green lines) or a normal year (black lines). The significant interaction shown here indicates that biodiversity
increased resistance more during climate
events preceded by years with climate events than during climate events preceded by normal years (F1,64.8 = 7.21, P < 0.01). Axes are logarithmic. The sequence of climate events at each site is shown in Extended Data Fig. 3.
1/4 1/2 1 2 4 8 1 2 4 8 16 32 64 Number of species Resistance ( Ω ) preceded by event preceded by normal