University of Wollongong
Research Online
Faculty of Business - Papers Faculty of Business
2013
Measuring the technical efficiency of Thai
manufacturing SMEs: A comparison of parametric
and non-parametric approaches
Teerawat Charoenrat
Khon Kaen University, [email protected] Charles Harvie
University of Wollongong, [email protected] Wannapa Naburana
Central Queensland University
Research Online is the open access institutional repository for the University of Wollongong. For further information contact the UOW Library: [email protected]
Publication Details
Charoenrat, T., Harvie, C. & Naburana, W. (2013). Measuring the technical efficiency of Thai manufacturing SMEs: A comparison of parametric and non-parametric approaches. 2013 Cambridge Business & Economics Conference (pp. 1-24). Cambridge, United Kingdom: Cambridge University.
Measuring the technical efficiency of Thai manufacturing SMEs: A
comparison of parametric and non-parametric approaches
Abstract
This study applies stochastic frontier analysis (SFA) and data envelopment analysis (DEA) approaches to measure and explain the technical efficiency of Thai manufacturing SMEs in 2007. The empirical results from both SFA and DEA revealed that the overall simple average technical efficiency in 2007 is relatively low, which can potentially reduce their output contribution. Therefore, specific policies are required to improve the technical efficiency of SMEs and these include easier access to financial services, credit facilities, equity in terms of the political operation, educational system, extensive infrastructural development, and technological upgrading, marketing and management.
Keywords
manufacturing, thai, comparison, measuring, parametric, non, efficiency, smes, approaches, technical
Disciplines
Business
Publication Details
Charoenrat, T., Harvie, C. & Naburana, W. (2013). Measuring the technical efficiency of Thai manufacturing SMEs: A comparison of parametric and non-parametric approaches. 2013 Cambridge Business & Economics Conference (pp. 1-24). Cambridge, United Kingdom: Cambridge University.
Measuring the Technical Efficiency of Thai Manufacturing SMEs: A Comparison of Parametric and Non-parametric Approaches
Teerawat Charoenrat Lecturer, Director,
Centre for Entrepreneurship and Innovation for SME Development in ASEAN Region, Khon Kaen University, Nong Khai Campus, Nong Khai, 4300, Thailand,
Phone: +66 4241 5600, Fax: +66 4241 5699,
Ema
Charles Harvie Associate Professor,
Director, Centre for Small Business and Regional Research School of Economics
University of Wollongong, NSW, 2522, Australia Phone: +61 2 42 213702, Fax: +61 2 42 213725
Wannapa Naburana
Research Higher Degree Candidate in Doctor of Professional Studies Central Queensland University, Australia
Ema
ABSTRACT
This study applies stochastic frontier analysis (SFA) and data envelopment analysis (DEA) approaches to measure and explain the technical efficiency of Thai manufacturing SMEs in 2007. The empirical results from both SFA and DEA revealed that the overall simple average technical efficiency in 2007 is relatively low, which can potentially reduce their output contribution. Therefore, specific policies are required to improve the technical efficiency of SMEs and these include easier access to financial services, credit facilities, equity in terms of the political operation, educational system, extensive infrastructural development, and technological upgrading, marketing and management.
Keywords: Technical Efficiency; Stochastic Frontier Analysis (SFA) Data Envelopment Analysis (DEA); Small and Medium sized Enterprises (SMEs); Manufacturing
July 2-3, 2013
1. INTRODUCTION
Small and Medium sized Enterprises (SMEs)1 Dhanani & Scholtès 2002
play a pivotal role in accelerating Thai economic development
( ; Wiboonchutikula 2002; Ha 2006; Sahakijpicharn 2007; OSMEP 2009). SMEs
provide backward linkages for large enterprises through supply of goods, services, information and knowledge (Regnier 2000; Huang 2003; Buranajarukorn 2006; OSMEP 2009). The number of Thai SMEs was 1,835,873 enterprises, representing 99 per cent of all enterprises in the country and employ more than seven million workers, accounting for 73 per cent of total employment during the period 19942
Despite their obvious significance Thai SMEs face a number of disadvantages that act as barriers to their development. These barriers comprise: financial constraints, lack of technical and innovation skills, lack of integration in domestic and international markets, lack of export knowledge among others (
to 2009. The value of exports by SMEs was THB 1,311,493 million or 33.02 per cent of total exports on overage over the period 2000 to 2009 (Office of Small and Medium Enterprises Promotion (OSMEP), 2001-2009). The contribution of SMEs to GDP, at current prices, was approximately 38.84 per cent of total GDP over the period 1999-2009 (Office of Small and Medium Enterprises Promotion, 2001-2009). The average number of manufacturing SMEs was approximately 460,002, or 27.14 per cent of total SMEs over the period 1994 to 2009. The employment contribution of manufacturing SMEs is around 2,630,800 workers during 1994 to 2009 which, on average, is equivalent to about 27.13 per cent of total employment in the private sector in this period. The contribution of manufacturing SMEs to total SME GDP is about THB 748,749 million, or 28.68 per cent of total SME output in 1994 - 2009 (OSMEP, 2001-2009).
Sarapaivanich 2003; Punyasavatsut 2007; OSMEP 2008, 2009). However, there is a dearth of evidence on Thailand’s manufacturing SMEs particularly in terms of their technical efficiency and their determinants. The primary motivation of this study is to identify the under-performance of Thai manufacturing SMEs in terms of their output and technical efficiency, and investigate factors that influence their relatively poor performance. This paper is the first
1 The definition of manufacturing SMEs in Thailand is generally based upon the number of employees, or the value of assets. The
definition of manufacturing SMEs in Thailand is generally based upon the number of employees, or the value of assets. Refer to Office of Small and Medium Enterprises Promotion (2002), Mephokee (2003), Sahakijpicharn (2007) for a taxonomy of SMEs in Thailand.
empirical study to use SFA and DEA to estimate and explain the technical efficiency of Thai manufacturing SMEs in 2007. Therefore, the major aim of this study is to estimate the level of technical efficiency of Thai manufacturing SMEs in 2007. The estimation is performed by the size of manufacturing SMEs (small and medium) and by sub-manufacturing sectors of operation classified by the Standard International Trade Classification (SITC): Revision 4. We also identify appropriate policies to improve Thai manufacturing SMEs.
The paper is structured as follows. Section 2 explains the methodology and a brief concept of efficiency. Section 3 outlines data and key variables for SFA and DEA approaches. The analytical framework is shown in Section 4. The empirical results from SFA and DEA are discussed in Section 5. Section 6 compare and discuss the results obtained from the SFA and DEA approaches. Policy implications and conclusions are presented in Section 7.
2. METHODOLOGY
A firm’s performance is measured by its technical and allocative efficiencies3
Coelli 1996b
. Technical efficiency can be estimated by either Stochastic Frontier Analysis (SFA) or Data Envelopment Analysis (DEA) approaches ( ; Herrero & Pascoe 2002; Coelli et al. 2005; Kontodimopoulos et al. 2010). SFA is a parametric approach where the form of the production function is assumed to be known and is estimated statistically (Coelli 1996a; Coelli et al. 2005). (Admassie & Matambalya 2002; Coelli et al. 2005; Arunsawadiwong 2007; Zahid & Mokhtar 2007). On the other hand, DEA is a non-parametric approach that involves the use of linear programming to construct a frontier. It does not require assumptions concerning the form of the production function. Instead, the best practice production function is created empirically from observed inputs and outputs. (Admassie & Matambalya 2002; Vu 2003; Coelli et al. 2005; Arunsawadiwong 2007; Zahid & Mokhtar 2007). However, the SFA and DEA approaches each have their advantages as well as disadvantages, and that there is no specific set of criteria to select the best method for estimating technical efficiency (Murillo-Zamorano 2004; Coelli et al. 2005; Seelanatha 2007; Kontodimopoulos et al. 2010; Amornkitvikai 2011). Thus, it is quite
3
Technical efficiency refers to a firm’s ability to produce the maximum level of output from a given combination of inputs. The output of a firm is the level of production in terms of value added, while inputs are factors of production, such as labour and capital. Allocative efficiency is the firm’s ability to utilise inputs in optimal proportions given their respective prices (Admassie and Matambalya, 2002, Vu, 2003; Coelli et al., 2005; Zahid and Mokhtar, 2007).
July 2-3, 2013
reasonable to estimate the technical efficiency performance of Thai manufacturing SMEs utilising both methods in an attempt to validate the results, as recommended in many empirical studies such as Kalaitzandonakes and Dunn (1995); Sharma et al. (1997); Wadud (2003); Minh et al.(2007); O'Donnell et al. (2009); Amornkitvikai and Harvie (2010) and Kontodimopoulos et al. (2010).
3. DATA AND VARIABLES
We use firm-level data from industrial census4
NSO 2011a
in 2007 compiled by the National Statistical Office (NSO) of Thailand. The scope of this census consists of enterprises engaged in manufacturing industry activities (Category D International Standard Industrial Classification of all Economic Activities, ISIC: Rev.3) (
, 2011b). The 2007 industrial census is based upon large samples of firms in the manufacturing industry, consisting of small, medium and large enterprises. This thesis, however, only focuses on data for Thai manufacturing SMEs. The total number of Thai manufacturing SMEs in 2007 industrial census is 56,441. The key variables are output value added (Y), labour input (L), capital input (K). Output value added (Y) is defined as the value of gross output minus intermediate consumption. Labour input (L) includes the number of workers in the enterprise, including owner or partner, unpaid workers, skilled and unskilled labour. Capital input (K) is measured by the net value of fixed assets less depreciation at the end of the year.
4. THE ANALYTICAL FRAMEWORK
This section consists of two sections: (1) the stochastic frontier production function (SFA), and (2) the DEA model
4.1. A stochastic frontier production function (using SFA)
In empirical research a Cobb-Douglas production function is the most commonly used functional form for SFA to estimate technical efficiency. The two-factor Cobb-Douglas production function in logarithmic form utilising cross-sectional data can be expressed as follows:
i = 1,…, N, (1)
Where:
= value added of firm ;
= the net value of fixed assets of firm ;
= the total number of employees of firm ;
= a random variable which is assumed to be an independently and identically distributed normal
variable with zero mean and variance ,and is assumed to be independently
distributed of ; and
= a non-negative random variable assumed to account for technical inefficiency in the production
function, and is assumed to be independently distributed as truncations at zero of the normal
distribution, .
4.2. The DEA model
The output-orientated VRS4F 5
model assumes that firms are not operating at optimal scale efficiency due to government regulations, imperfect competition and financial restrictions (Coelli et al. 2005; Cooper et al. 2006; Amornkitvikai 2011). It is used assuming fixed input quantities and maximized output production. Thus, the output-orientated DEA model under the assumption of VRS can be expressed as follows (Coelli et al. 2005; McDonald 2009; Amornkitvikai 2011):
5 This study uses the VRS DEA model for a comparison between the DEA and SFA approaches, since these model estimated by
DEAP 2.1 for the DEA approach is equivalent to pure technical efficiency scores predicted by FRONTIER 4.1 for the SFA approach (Minh and Long, 2005; Minh et al., 2007; Amornkitvikai, 2011).
July 2-3, 2013 , Maxφ λ φ, Subject to −φyi+Yλ
≥
0, i x −Xλ≥
0, j = 1, 2,..., I, 1 I ′λ≤
1, λ≥
0. (2) Where:φ is a scalar (an efficiency parameter). 1≤ < ∞φ and φ−1 represents the proportional increase in output (yi) that can be obtained by the i-th firm, while holding input quantities (xi) constant (Coelli et al. 2005;
Minh & Long 2005; Minh et al. 2007; Amornkitvikai 2011); 1
φ is the technical efficiency score that varies between zero and unity and defines a technical efficiency
score for the i-th firm;
i
x is an input vector for the i-th firm;
λ is a vector of constants; and 1
I ′λ represents non-increasing returns to scale (NIRS).
5. EMPIRICAL RESULTS
This section compares and discusses the empirical results obtained from the SFA and DEA approaches for Thai manufacturing SMEs.
5.1. Empirical results from the SFA approach
The maximum likelihood estimates (MLE) for the parameters of the stochastic frontier production function, as specified by Equations (1), was estimated using the FRONTIER Version 4.1 developed by Coelli (1996a). The Coelli estimation technique is a three-step procedure (Coelli 1996a). In step 1, OLS is applied to obtain
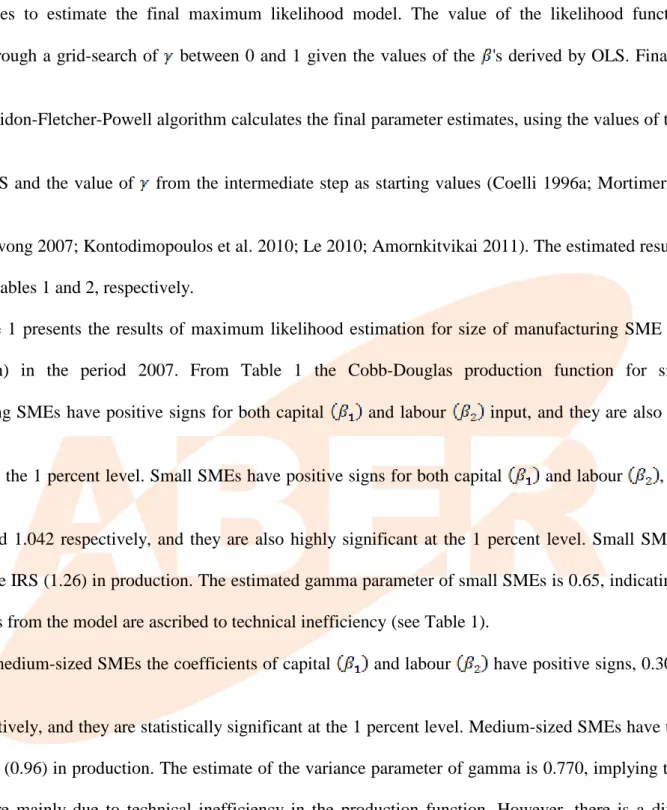
unbiased estimates of the parameters of the production function. In step 2, the OLS estimates are used as starting values to estimate the final maximum likelihood model. The value of the likelihood function is estimated through a grid-search of between 0 and 1 given the values of the 's derived by OLS. Finally, an
iterative Davidon-Fletcher-Powell algorithm calculates the final parameter estimates, using the values of the s
from the OLS and the value of from the intermediate step as starting values (Coelli 1996a; Mortimer 2002;
Arunsawadiwong 2007; Kontodimopoulos et al. 2010; Le 2010; Amornkitvikai 2011). The estimated results are reported in Tables 1 and 2, respectively.
Table 1 presents the results of maximum likelihood estimation for size of manufacturing SME (small and medium) in the period 2007. From Table 1 the Cobb-Douglas production function for size of manufacturing SMEs have positive signs for both capital and labour input, and they are also highly
significant at the 1 percent level. Small SMEs have positive signs for both capital and labour , which
are 0.219 and 1.042 respectively, and they are also highly significant at the 1 percent level. Small SMEs are found to have IRS (1.26) in production. The estimated gamma parameter of small SMEs is 0.65, indicating that all deviations from the model are ascribed to technical inefficiency (see Table 1).
For medium-sized SMEs the coefficients of capital and labour have positive signs, 0.307 and
0.653 respectively, and they are statistically significant at the 1 percent level. Medium-sized SMEs have tended to have CRS (0.96) in production. The estimate of the variance parameter of gamma is 0.770, implying that all deviations are mainly due to technical inefficiency in the production function. However, there is a different elasticity by size of SME. The contribution of labour in the production function is higher than capital, irrespective of the size of the SME, showing that small- and medium-sized enterprises were labour-intensive in 2007 (see Table 1).
July 2-3, 2013
Table 1: Maximum likelihood estimates of the parameters for the stochastic frontier model and technical inefficiency effects model by size of manufacturing SMEs (small and medium)
Variables Small Enterprises Medium Enterprises Number of Observations 49835 6606
Coefficients Coefficients
Stochastic Frontier Model
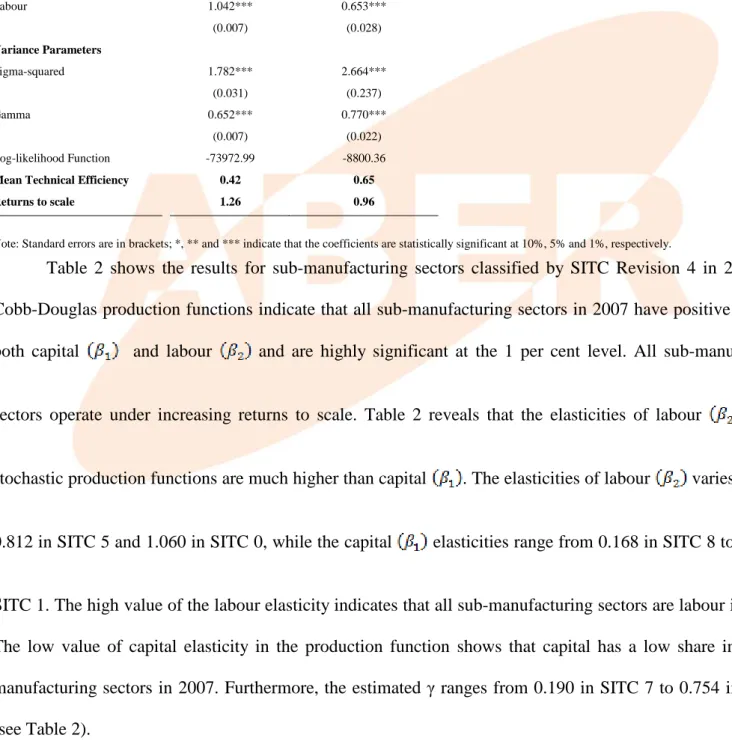
Constant 5.407*** 5.956*** (0.039) (0.144) Capital 0.219*** 0.307*** (0.003) (0.007) Labour 1.042*** 0.653*** (0.007) (0.028) Variance Parameters Sigma-squared 1.782*** 2.664*** (0.031) (0.237) Gamma 0.652*** 0.770*** (0.007) (0.022) Log-likelihood Function -73972.99 -8800.36
Mean Technical Efficiency 0.42 0.65
Returns to scale 1.26 0.96
Note: Standard errors are in brackets; *, ** and *** indicate that the coefficients are statistically significant at 10%, 5% and 1%, respectively.
Table 2 shows the results for sub-manufacturing sectors classified by SITC Revision 4 in 2007. The Cobb-Douglas production functions indicate that all sub-manufacturing sectors in 2007 have positive signs for both capital and labour and are highly significant at the 1 per cent level. All sub-manufacturing
sectors operate under increasing returns to scale. Table 2 reveals that the elasticities of labour in the
stochastic production functions are much higher than capital . The elasticities of labour varies between
0.812 in SITC 5 and 1.060 in SITC 0, while the capital elasticities range from 0.168 in SITC 8 to 0.316 in
SITC 1. The high value of the labour elasticity indicates that all sub-manufacturing sectors are labour intensive. The low value of capital elasticity in the production function shows that capital has a low share in all sub-manufacturing sectors in 2007. Furthermore, the estimated γ ranges from 0.190 in SITC 7 to 0.754 in SITC 2 (see Table 2).
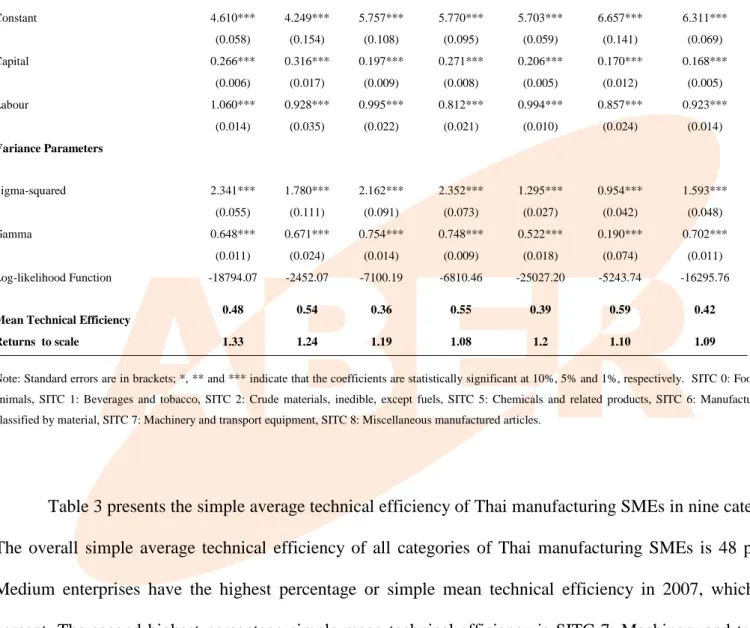
Table 2: Maximum likelihood estimates for parameters of the stochastic frontier model and technical inefficiency effects model by standard international trade classification (SITC), revision 4
Note: Standard errors are in brackets; *, ** and *** indicate that the coefficients are statistically significant at 10%, 5% and 1%, respectively. SITC 0: Food and live animals, SITC 1: Beverages and tobacco, SITC 2: Crude materials, inedible, except fuels, SITC 5: Chemicals and related products, SITC 6: Manufactured goods classified by material, SITC 7: Machinery and transport equipment, SITC 8: Miscellaneous manufactured articles.
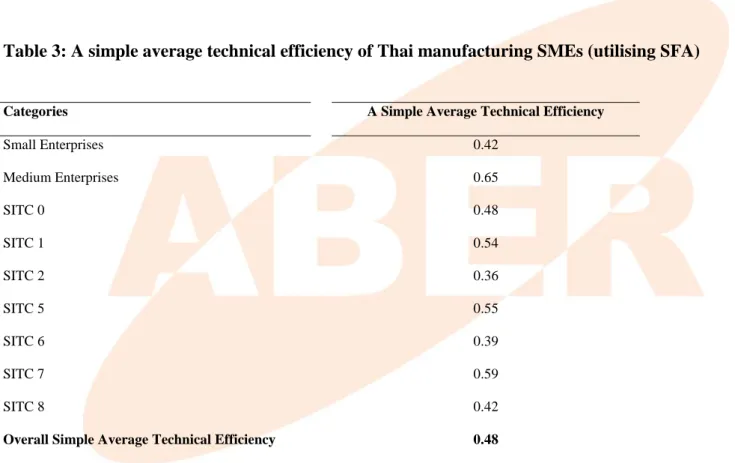
Table 3 presents the simple average technical efficiency of Thai manufacturing SMEs in nine categories. The overall simple average technical efficiency of all categories of Thai manufacturing SMEs is 48 percent. Medium enterprises have the highest percentage or simple mean technical efficiency in 2007, which is 65 percent. The second highest percentage simple mean technical efficiency is SITC 7: Machinery and transport equipment, having 59 percent. SITC 5: Chemicals and related products ranked third at 55 percent simple mean technical efficiency. The fourth ranked technical efficiency is SITC 1: Beverages and tobacco, with 54 percent. SITC 0: Food and live animals ranked fifth at 48 percent simple mean technical efficiency (see Table 3).
Variable SITC 0 SITC 1 SITC 2 SITC 5 SITC 6 SITC 7 SITC 8
Number of Observations 12080 1765 4608 4833 17541 3892 11646
Coefficients Coefficients Coefficients Coefficients Coefficients Coefficients Coefficients
Stochastic Frontier Model
Constant 4.610*** 4.249*** 5.757*** 5.770*** 5.703*** 6.657*** 6.311*** (0.058) (0.154) (0.108) (0.095) (0.059) (0.141) (0.069) Capital 0.266*** 0.316*** 0.197*** 0.271*** 0.206*** 0.170*** 0.168*** (0.006) (0.017) (0.009) (0.008) (0.005) (0.012) (0.005) Labour 1.060*** 0.928*** 0.995*** 0.812*** 0.994*** 0.857*** 0.923*** (0.014) (0.035) (0.022) (0.021) (0.010) (0.024) (0.014) Variance Parameters Sigma-squared 2.341*** 1.780*** 2.162*** 2.352*** 1.295*** 0.954*** 1.593*** (0.055) (0.111) (0.091) (0.073) (0.027) (0.042) (0.048) Gamma 0.648*** 0.671*** 0.754*** 0.748*** 0.522*** 0.190*** 0.702*** (0.011) (0.024) (0.014) (0.009) (0.018) (0.074) (0.011) Log-likelihood Function -18794.07 -2452.07 -7100.19 -6810.46 -25027.20 -5243.74 -16295.76
Mean Technical Efficiency 0.48 0.54 0.36 0.55 0.39 0.59 0.42
July 2-3, 2013
Small enterprises and SITC 8: Miscellaneous manufactured articles each achieved 42 and 42 percent simple mean technical efficiency. The simple average technical efficiency of SITC 6: Manufactured goods classified chiefly by material is 39 percent (see Table 3). Finally, SITC 2: Crude materials, inedible, except fuels has 36 percent simple mean technical efficiency. The biggest concern relates to small enterprises which predominate in the Thai economy. Thus, it will be essential for SME policy makers to focus upon this component of the SME sector if a major improvement in technical efficiency is to be achieved and this will be discussed in more detail in conclusions.
Table 3:A simple average technical efficiency of Thai manufacturing SMEs (utilising SFA)
Categories A Simple Average Technical Efficiency
Small Enterprises 0.42 Medium Enterprises 0.65 SITC 0 0.48 SITC 1 0.54 SITC 2 0.36 SITC 5 0.55 SITC 6 0.39 SITC 7 0.59 SITC 8 0.42
Overall Simple Average Technical Efficiency 0.48
5.2. Empirical results from the DEA model The output-orientated DEA model6
6 The output-orientated VRS DEA model assumes that firms are not operating at the optimal scale efficiency due to government
regulations and imperfect competition in financial markets and capital structure (Coelli et al., 2005; Cooper et al., 2006; Amornkitvikai, 2011).
under the assumption of variable return to scale (VRS) is utilised assuming fixed input quantities and maximized output production. Two inputs (capital and labour) and one output (value added), are also used to estimate the DEA technical efficiency scores. The technical efficiency scores are
predicted by the output-orientated VRS DEA model, as defined by Equation (2). The multi-stage DEA in DEAP Version 2.1, is the method used to measure VRS technical efficiency scores for the first-stage DEA approach (Coelli 1996b; Coelli et al. 2005; Amornkitvikai 2011). DEAP Version 2.1 provides three types of returns to scale: (1) constant returns to scale (CRS), (2) decreasing returns to scale (DRS), and (3) increasing returns to scale (IRS). The DEA results using DEAP 2.1 are reported in Tables 4 and 5, respectively.
From Table 4, small manufacturing SMEs operated under DRS in 2007, accounting for 83.20 percent of all firms. Medium-sized manufacturing SMEs revealed modest DRS at 52.68 percent of the total firms in 2007.
Table 4: Number and percentage of size of manufacturing SMEs (small and medium), classified by types of returns to scale
Categories Number of Firms Percentage (%)
Size of Manufacturing SMEs
Small Enterprises
Constant Returns to Scale (CRS) 8373 16.80
Decreasing Returns to Scale (DRS) 41462 83.20
Increasing Returns to Scale (IRS) N/A N/A
Total 49835 100.00
Medium Enterprises
Constant Returns to Scale (CRS) 82 1.24
Decreasing Returns to Scale (DRS) 3480 52.68
Increasing Returns to Scale (IRS) 3044 46.08
Total 6606 100.00
As presented in Table 5, it can be seen that all sub-manufacturing sectors experienced highly DRS in 2007. DRS of sub-manufacturing sectors start from 77.62 percent in SITC 0 to 96.21 percent in SITC 5 in 2007.
July 2-3, 2013
Table 5: Number and percentage of SITC: revision 4, classified by types of returns to scale
Categories Number of Firms Percentage (%)
Sub-manufacturing Sectors
SITC 0: Food and live animals
Constant Returns to Scale (CRS) 2704 22.38
Decreasing Returns to Scale (DRS) 9376 77.62
Increasing Returns to Scale (IRS) N/A N/A
Total 12080 100.00
SITC 1: Beverages and tobacco
Constant Returns to Scale (CRS) 261 14.79
Decreasing Returns to Scale (DRS) 1504 85.21
Increasing Returns to Scale (IRS) N/A N/A
Total 1765 100.00
SITC 2: Crude materials, inedible, except fuels
Constant Returns to Scale (CRS) 806 17.49
Decreasing Returns to Scale (DRS) 3802 82.51
Increasing Returns to Scale (IRS) N/A N/A
Total 4608 100.00
SITC 3: Mineral fuels and lubricants
Constant Returns to Scale (CRS) 11 14.47
Decreasing Returns to Scale (DRS) 65 85.53
Increasing Returns to Scale (IRS) N/A N/A
Total 76 100.00
SITC 5: Chemicals and related products
Constant Returns to Scale (CRS) 182 3.77
Decreasing Returns to Scale (DRS) 4650 96.21
Increasing Returns to Scale (IRS) 1 0.02
Table 5: (continued) Number and percentage of SITC: revision 4, classified by types of returns to scale
Categories Number of Firms Percentage (%)
SITC 6: Manufactured goods classified by material
Constant Returns to Scale (CRS) 2204 12.56
Decreasing Returns to Scale (DRS) 15337 87.44
Increasing Returns to Scale (IRS) N/A N/A
Total 17541 100.00
SITC 7: Machinery and transport equipment
Constant Returns to Scale (CRS) 363 9.33
Decreasing Returns to Scale (DRS) 3517 90.36
Increasing Returns to Scale (IRS) 12 0.31
Total 3892 100.00
SITC 8: Miscellaneous manufactured articles
Constant Returns to Scale (CRS) 1849 15.88
Decreasing Returns to Scale (DRS) 9797 84.12
Increasing Returns to Scale (IRS) N/A N/A
Total 11646 100.00
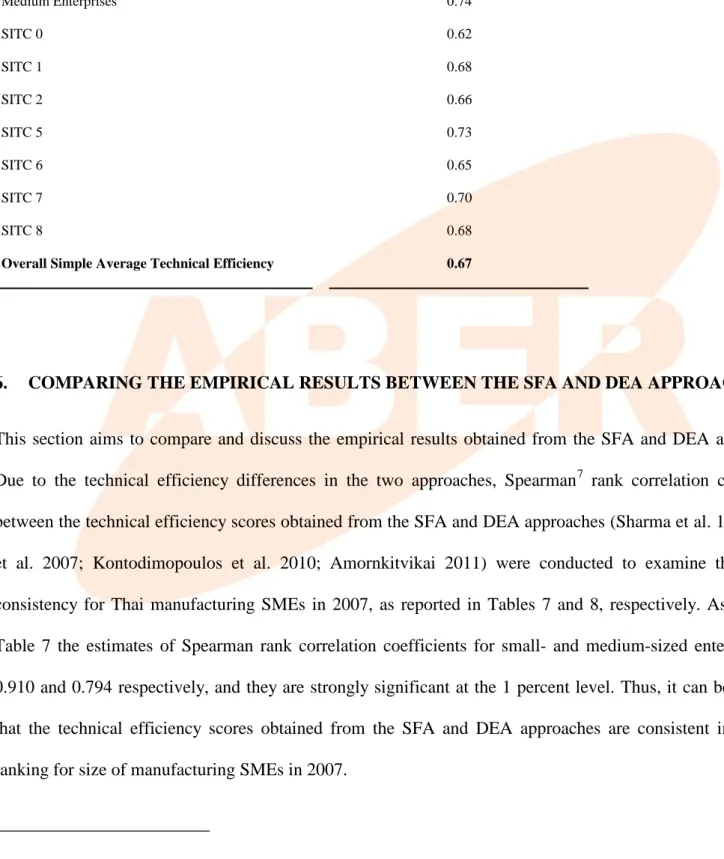
Table 6 summarises the simple average technical efficiency of Thai manufacturing SMEs in 2007. The simple average technical efficiency ranges from 74 percent in medium enterprises to 62 percent in SITC 0: Food and live animals. The overall simple average technical efficiency of all categories of manufacturing SMEs is 67 per cent. Thai manufacturing SMEs experienced a high level of technical inefficiency in their production process in 2007, an inefficiency which did not show any signs of abating. This presents major challenges to SME owners operating in the manufacturing sector, as well as government policy makers, that need to be urgently addressed. This will be discussed in the subsequent section of this chapter.
July 2-3, 2013
Table 6: The simple average technical efficiency levels of Thai Manufacturing SMEs (using DEA)
Categories Simple Average Technical Efficiency
Small Enterprises 0.62 Medium Enterprises 0.74 SITC 0 0.62 SITC 1 0.68 SITC 2 0.66 SITC 5 0.73 SITC 6 0.65 SITC 7 0.70 SITC 8 0.68
Overall Simple Average Technical Efficiency 0.67
6. COMPARING THE EMPIRICAL RESULTS BETWEEN THE SFA AND DEA APPROACHES
This section aims to compare and discuss the empirical results obtained from the SFA and DEA approaches. Due to the technical efficiency differences in the two approaches, Spearman7
Sharma et al. 1997
rank correlation coefficients
between the technical efficiency scores obtained from the SFA and DEA approaches ( ; Minh
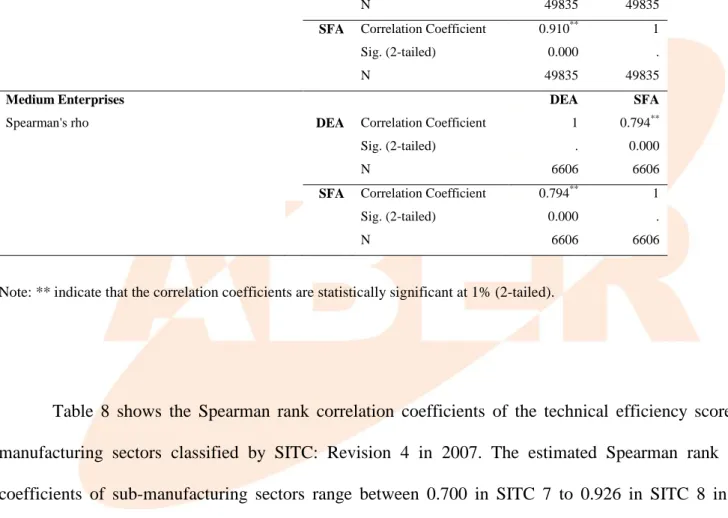
et al. 2007; Kontodimopoulos et al. 2010; Amornkitvikai 2011) were conducted to examine the ranking consistency for Thai manufacturing SMEs in 2007, as reported in Tables 7 and 8, respectively. As shown in Table 7 the estimates of Spearman rank correlation coefficients for small- and medium-sized enterprises are 0.910 and 0.794 respectively, and they are strongly significant at the 1 percent level. Thus, it can be specified that the technical efficiency scores obtained from the SFA and DEA approaches are consistent in terms of ranking for size of manufacturing SMEs in 2007.
7 The Spearman rank correlation coefficient is a non-parametric correlation test (Minh et al., 2007; Kontodimopoulos et al., 2010;
Table 7: Spearman rank correlation coefficients of the technical efficiency scores from the SFA and DEA approaches, classified by size of manufacturing SMEs (small and medium)
Categories
Size of Manufacturing SMEs
Small Enterprises DEA SFA
Spearman's rho DEA Correlation Coefficient 1 0.910**
Sig. (2-tailed) . 0.000
N 49835 49835
SFA Correlation Coefficient 0.910** 1
Sig. (2-tailed) 0.000 .
N 49835 49835
Medium Enterprises DEA SFA
Spearman's rho DEA Correlation Coefficient 1 0.794**
Sig. (2-tailed) . 0.000
N 6606 6606
SFA Correlation Coefficient 0.794** 1
Sig. (2-tailed) 0.000 .
N 6606 6606
Note: ** indicate that the correlation coefficients are statistically significant at 1% (2-tailed).
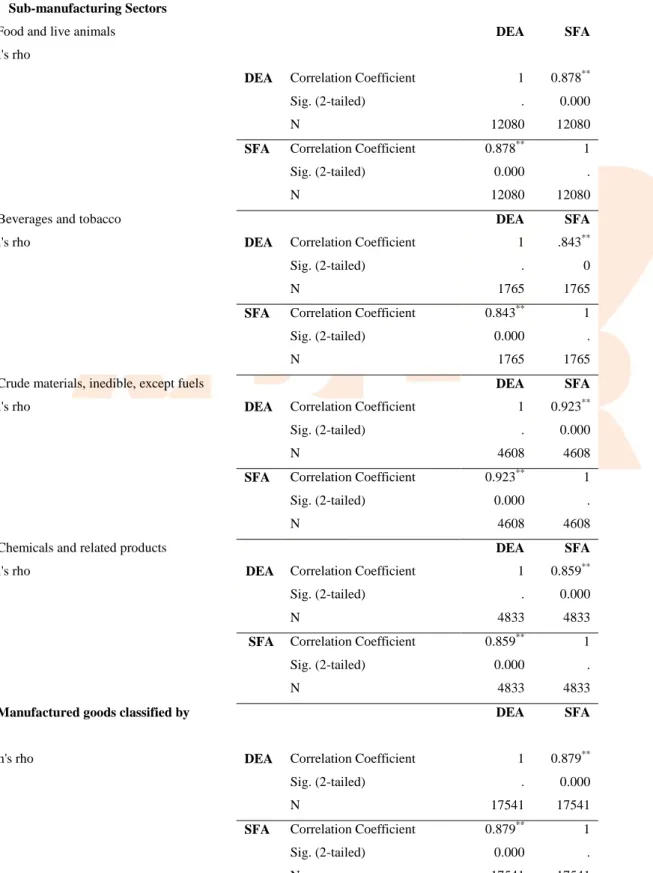
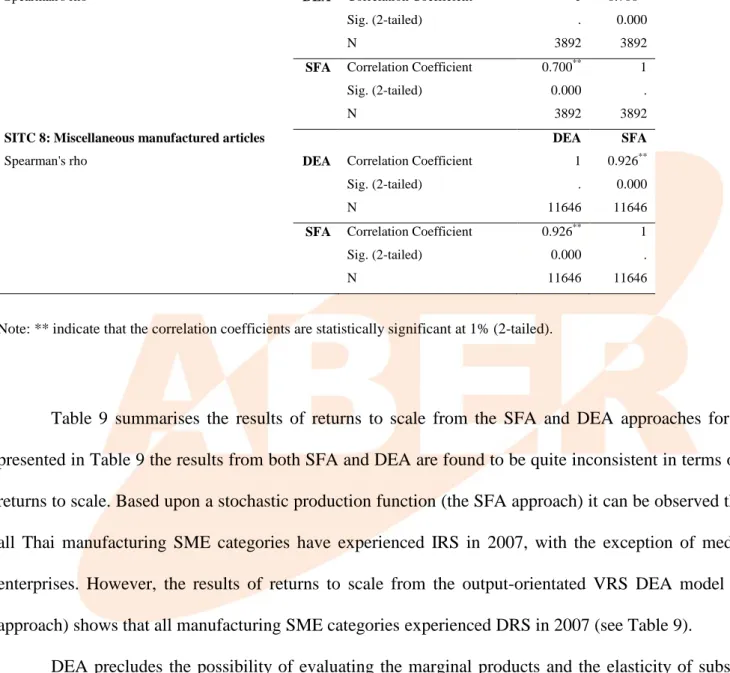
Table 8 shows the Spearman rank correlation coefficients of the technical efficiency scores for sub-manufacturing sectors classified by SITC: Revision 4 in 2007. The estimated Spearman rank correlation coefficients of sub-manufacturing sectors range between 0.700 in SITC 7 to 0.926 in SITC 8 in 2007. All estimated correlation coefficients are highly significant at the 1 percent level in all sub-manufacturing sectors for both periods. Thus, it can be stated that the results from the SFA and DEA approaches for sub-manufacturing sectors are consistent in terms of technical efficiency rankings in 2007.
July 2-3, 2013
Table 8: Spearman rank correlation coefficients of the technical efficiency scores from the SFA and DEA approaches, classified by SITC: revision 4
Categories
Sub-manufacturing Sectors SITC 0: Food and live animals Spearman's rho
DEA SFA
DEA Correlation Coefficient 1 0.878**
Sig. (2-tailed) . 0.000
N 12080 12080
SFA Correlation Coefficient 0.878** 1
Sig. (2-tailed) 0.000 .
N 12080 12080
SITC 1: Beverages and tobacco DEA SFA
Spearman's rho DEA Correlation Coefficient 1 .843**
Sig. (2-tailed) . 0
N 1765 1765
SFA Correlation Coefficient 0.843** 1
Sig. (2-tailed) 0.000 .
N 1765 1765
SITC 2: Crude materials, inedible, except fuels DEA SFA
Spearman's rho DEA Correlation Coefficient 1 0.923**
Sig. (2-tailed) . 0.000
N 4608 4608
SFA Correlation Coefficient 0.923** 1
Sig. (2-tailed) 0.000 .
N 4608 4608
SITC 5: Chemicals and related products DEA SFA
Spearman's rho DEA Correlation Coefficient 1 0.859**
Sig. (2-tailed) . 0.000
N 4833 4833
SFA Correlation Coefficient 0.859** 1
Sig. (2-tailed) 0.000 .
N 4833 4833
SITC 6: Manufactured goods classified by material
DEA SFA
Spearman's rho DEA Correlation Coefficient 1 0.879**
Sig. (2-tailed) . 0.000
N 17541 17541
SFA Correlation Coefficient 0.879** 1
Sig. (2-tailed) 0.000 .
N 17541 17541
Table 8: (continued) Spearman rank correlation coefficients of the technical efficiency scores from the SFA and DEA approaches, classified by SITC: revision 4
Categories
SITC 7: Machinery and transport equipment DEA SFA
Spearman's rho DEA Correlation Coefficient 1 0.700**
Sig. (2-tailed) . 0.000
N 3892 3892
SFA Correlation Coefficient 0.700** 1
Sig. (2-tailed) 0.000 .
N 3892 3892
SITC 8: Miscellaneous manufactured articles DEA SFA
Spearman's rho DEA Correlation Coefficient 1 0.926**
Sig. (2-tailed) . 0.000
N 11646 11646
SFA Correlation Coefficient 0.926** 1
Sig. (2-tailed) 0.000 .
N 11646 11646
Note: ** indicate that the correlation coefficients are statistically significant at 1% (2-tailed).
Table 9 summarises the results of returns to scale from the SFA and DEA approaches for 2007. As presented in Table 9 the results from both SFA and DEA are found to be quite inconsistent in terms of types of returns to scale. Based upon a stochastic production function (the SFA approach) it can be observed that almost all Thai manufacturing SME categories have experienced IRS in 2007, with the exception of medium-sized enterprises. However, the results of returns to scale from the output-orientated VRS DEA model (the DEA approach) shows that all manufacturing SME categories experienced DRS in 2007 (see Table 9).
DEA precludes the possibility of evaluating the marginal products and the elasticity of substitution of the production technology. DEA produces no standard errors with deviations from a frontier treated as technical inefficiency, leaving no provision for random shocks of any type (Coelli et al. 2005; Cooper et al. 2006; Arunsawadiwong 2007; Assaf 2007). On the other hand SFA is employed because of its superior conceptual treatment of noise. This approach takes into account measurement errors as well as other random factors, such as the effect of weather, and luck on the value of output variables, together with the combined effects of unspecified input variables in the production function (Coelli 1996a; Wadud 2003; Coelli et al. 2005).
July 2-3, 2013
Table 9: Results of returns to scale from the SFA and DEA approaches
Categories SFA DEA
Small Enterprises IRS DRS
Medium Enterprises DRS DRS SITC 0 IRS DRS SITC 1 IRS DRS SITC 2 IRS DRS SITC 5 IRS DRS SITC 6 IRS DRS SITC 7 IRS DRS SITC 8 IRS DRS
Note: CRS is Constant Returns to Scale, DRS is Decreasing Returns to Scale, IRS is Increasing Returns to Scale
As presented in Table 10 the overall simple average technical efficiency scores8
Coelli et al. 2005
obtained from the SFA approach are slightly lower than those obtained from the DEA approach in both 1997 and 2007, due to SFA making adjustments for a statistical noise variance ( ; O'Donnell et al. 2009). There may be no measurement error as well as other random factors in cross-sectional firm-level data from the 2007 industrial census. Thus, the cause of a statistical noise may arise from the misspecification of a stochastic production function (Coelli et al. 2005; O'Donnell et al. 2009). Unlike the DEA approach, the SFA approach does not guarantee that a firm will select a riskless production plan (O'Donnell et al. 2009).
Furthermore, the empirical results from both SFA and DEA suggest that the technical efficiency performance of most Thai manufacturing SMEs is relatively low in 2007, and that the government’s first SME promotion plan, covering the period 2002-2006, aimed at improving the efficiency and capacity of SMEs has proven to be largely ineffective9
8 The SFA and DEA approaches report a similar conclusion: that the weighted technical efficiency scores in all SME categories is
relatively low in 2007.
. Thus, specific policy recommendations are essential to improve the technical
9 The first SME promotion plan from 2002 to 2006 aimed to provide a strategic direction for developing SMEs. The objective of the
plan was to develop more entrepreneurs and facilitate SMEs in meeting international quality standards. The plan also aimed to enhance the efficiency and capacity of SME operators with the objective of enhancing the international competitiveness of SMEs
efficiency of all categories of manufacturing SMEs. Policy will also require the provision of more skilled workers, in conjunction with greater access to capital and technology by SMEs.
Table 10: The Simple Average Technical Efficiency Scores from the SFA and DEA Approaches
Categories Simple Average SFA Simple Average DEA
Small Enterprises 0.42 0.62 Medium Enterprises 0.65 0.74 SITC 0 0.48 0.62 SITC 1 0.54 0.68 SITC 2 0.36 0.66 SITC 5 0.55 0.73 SITC 6 0.39 0.65 SITC 7 0.59 0.70 SITC 8 0.42 0.68
Overall Simple Average Technical Efficiency 0.48 0.67
7. POLICY IMPLICATIONS AND CONCLUSIONS
Thai manufacturing SMEs have played a crucial role in the Thai economy in terms of business numbers, employment and economic growth over the period 1994 to 2009 (OSMEP 2007b, 2008, 2009). They contribute greatly to the social and economic development of the country (Regnier 2000; Brimble et al. 2002; Wiboonchutikula 2002; Sahakijpicharn 2007; OSMEP 2009). This paper has conducted a comprehensive study of the technical efficiency performance of Thai manufacturing SMEs in 2007, by using the SFA and DEA approaches to test for the robustness of the results. Its findings are important as manufacturing SMEs remain vital to future growth and employment generation in Thailand.
(Mephokee, 2003; OSMEP, 2003; Punyasavatsut, 2007). However, the plan was not accomplished, as it was not implemented effectively and lacked a powerful driving force from the policy level to the operational level. Government agencies were also not well-integrated to be capable of supporting SMEs in accordance with the promotion plan (Punyasavatsut, 2007; Sahakijpicharn, 2007; OSMEP, 2008).
July 2-3, 2013
The empirical results from SFA and DEA approaches highlight that the overall simple average technical efficiency of all categories of Thai manufacturing SMEs in 2007 is relatively low. From these results, it is specified that manufacturing SMEs have a high degree of technical inefficiency in the operation in 2007. Therefore, specific policy recommendations are required to improve the technical efficiency of Thai manufacturing SMEs. The basic law and first SME promotion Act were declared in 2000. The first SME promotion plan from 2002 to 2006 provided a strategic direction for developing SMEs. The objective of this plan is to develop more entrepreneurs and facilitate SMEs in meeting international quality standards. This plan aimed to enhance the efficiency and capacity of SME operators with the objective of enhancing their international competitiveness (Mephokee 2003; OSMEP 2003; Punyasavatsut 2007).
However, the results of the first plan were not accomplished because the SME promotion plan was not implemented in unity and lacked a powerful driving force from the policy level to the operational level. Government agencies are not well integrated to support Thai SMEs in accordance with the SME promotion plan(Punyasavatsut 2007; Sahakijpicharn 2007; OSMEP 2008). Thus, the Thai government should formulate policies to promote and support SMEs, such as managerial and technical assistance, and training programme and provide financial assistance to avoid management risks and financial problems, promote efficiency in logistics management and in marketing facilities (Harvie & Lee 2005b; OSMEP 2007b; Amornkitvikai & Harvie 2010).
Furthermore, it is imperative that relevant government agencies have to be well equipped to play an effective role in order to promote and improve the quality of manufacturing SMEs both qualitatively and quantitatively. This involves improving coordination at both the national and sub-national levels, improving the procedure and structure of government agencies and developing the qualifications of human resources in the public sector (OSMEP 2007a, 2007b; OSMRJ 2008). Furthermore, the Thai government should place more emphasis on policies concerning a durable collaboration between public and private sectors, such as the promotion of manufacturing SME growth and integration, cross-border linkages, on-going learning and innovation (Hallberg 2000; Asasen et al. 2003; Harvie & Lee 2005b; OSMRJ 2008; Hussain et al. 2009).
REFERENCES
Admassie, A. & Matambalya, F. A. S. T. (2002), 'Technical Efficiency of Small-and Medium-Scale Enterprises: Evidence from a Survey of Enterprises in Tanzania', Eastern Africa Social Science Research Review, vol. 18, no. 2, 1-29.
Amornkitvikai, Y. (2011), 'Technical Efficiency Performance of Thai Listed Manufacturing Enterprises', PhD Thesis, School of Economics, Faculty of Commerce, University of Wollongong.
Amornkitvikai, Y. & Harvie, C. (2010), 'Identifying and Measuring Technical Inefficiency Factors: Evidence from Unbalanced Panel Data for Thai Listed Manufacturing Enterprises', University of Wollongong Economics Working Paper Series 2010.
Arunsawadiwong, S. (2007), 'Productivity Trends in the Thai Manufacturing Sector: The Pre- and Post-Crisis Evidence Relating to the 1997 Economic Crisis', PhD Thesis, School of Economics and Finance, University of St. Andrews.
Asasen, C., Asasen, K. & Chuangcham, N. (2003), A Proposed Policy Blueprint for the ASEAN SME Development Decade 2002-2012, REPSF Project 02/005, Bangkok.
Assaf, A. G. (2007), 'Modelling the Efficiency of Health Care Foodservice Operations: A Stochastic Frontier Approach', PhD Thesis, University of Western Sydney.
Brimble, P., Oldfield, D. & Monsakul, M. (2002), Policies for SME Recovery in Thailand, The Role of SMEs in National Economies in East Asia, Charles Harvie and Boon-Chye Lee (eds), Edward Elgar, Cheltenham. Brooks, A., Collings, S. & Gonzales, P. (1990), Accounting for Small Business: A Single entry Approach, VCTA Publishing, Collingwood.
Buranajarukorn, P. (2006), 'Human Aspects of Quality Management in Development Countries: A Case Study and Model Development for Thai Manufacturing SMEs', PhD thesis, School of Mechanical, Materials and Mechatronic Engineering, University of Wollongong.
Coelli, T. J. (1996a), A Guide to FRONTIER Version 4.1: A Computer Program for Stochastic Frontier Production and Cost Function Estimation, Working paper 96/07, Centre for Efficiency and Productivity Analysis, Armidale, University of New England.
Coelli, T. J. (1996b), A Guide to DEAP Version 2.1: A Data Envelopment Analysis (Computer) Program, Working paper 96/08, Centre for Efficiency and Productivity Analysis, Armidale, University of New England.
July 2-3, 2013
Coelli, T. J., Rao, D. S. P., O'Donnell, C. J. & Battese, G. E. (2005), An Introduction to Efficiency and Productivity Analysis, 2nd edn, Springer, New York.
Cooper, W. W., Seiford, L. M. & Tone, K. (2006), Introduction to Data Envelopment Analysis and Its Uses with DEA-Solver Software and References, Springer, New York.
Dhanani, S. & Scholtès, P. (2002), Thailand's Manufacturing Competitiveness: Promoting Technology, Productivity and Linkages, 8, United Nations Industrial Development Organization (UNIDO), Vienna.
Ha, T. T. (2006), 'Entrepreneurial Orientation, Business Strategies and Firm Performance: A Comparative Study of Small and Medium-Scale Enterprises in Vietnam and Thailand', PhD Thesis, Asian Institute of Technology.
Hallberg, K. (2000), A Market-oriented Strategy for Small and Medium-scale Enterprises, IFC Discussion Paper No. 40, World Bank, Washington DC.
Harvie, C. & Lee, B. C. (eds) (2005b), Public Policy and SME Development, Sustaining Growth and Performance in East Asia: The Role of Small and Medium sized Enterprises, Edward Elgar, Cheltenham.
Herrero, I. & Pascoe, S. (2002), 'Estimation of Technical Efficiency: A Review of Some of the Stochastic Frontier and DEA Software', CHEER Virtual Edition, vol. 15, no. 1, 1-13.
Huang, I.-W. (2003), 'Importance of SMEs Development in Thailand', Forum of International Development Studies, vol. 23, 159-176.
Hussain, I., Hussain, M., Hussain, S. & Si, S. (2009), 'Public Private Partnership and SMEs Development; The Case of Azad Jammu and Kashmir (AJ&K) Pakistan', International Review of Business Research Papers, vol. 5, no. 5, 37-46.
Kalaitzandonakes, N. G. & Dunn, E. G. (1995), 'Technical Efficiency, Managerial Ability and Farmer Education in Guatemalan Corn Production: A Latent Variable Analysis', Agricultural Resource Economic Review, vol. 24, 36-46.
Kontodimopoulos, N., Papathanasiou, N. D., Flokou, A., Tountas, Y. & Niakas, D. (2010), 'The Impact of Non-Discretionary Factors on DEA and SFA Technical Efficiency Differences', Journal of Medical Systems, vol. DOI 10.1007/s10916-010-9521-0, 1-9.
Le, C. L. V. (2010), 'Technical Efficiency Performance of Vietnamese Manufacturing Small and Medium Enterprises', PhD Thesis, School of Economics, Faculty of Commerce, University of Wollongong.
McDonald, J. (2009), 'Using Least Squares and Tobit in Second Stage DEA Efficiency Analyses', European Journal of Operational Research, vol. 197, 792-798.
Mephokee, C. (2003), The Thai SMEs Development Policies: Country Report, Thammasat University, Bangkok.
Minh, N. K. & Long, G. T. (2005), 'Efficiency of Construction Firms in Vietnam', Munich Personal RePEc Archive (MPRA) Paper No. 2872, 44-59.
Minh, N. K., Long, G. T. & Thang, B. N. (2007), 'Technical Efficiency of Small and Medium Manufacturing Firms in Vietnam: Parametric and Non-Parametric Approaches', The Korean Economic Review, vol. 23, no. 1, 187-221.
Mortimer, D. (2002), 'Competing Methods for Efficiency Measurement: A Systematic Review of Direct DEA vs SFA/DFA Comparisons', Working Paper 136, 1-19.
Murillo-Zamorano, L. R. (2004), 'Economic Efficiency and Frontier Techniques', Journal of Economic Surveys, vol. 18, no. 1, 33-77.
NSO (2011a), The 1997 Industrial Census, National Statistical Office of Thailand, accessed
13/05/
NSO (2011b), The 2007 Industrial Census, National Statistical Office of Thailand, accessed
13/05/
O'Donnell, C. J., Chambers, R. G. & Quiggin, J. (2009), 'Efficiency Analysis in the Presence of Uncertainty ', Journal of Productivity Analysis vol. 33, no. 1, 1-17.
OSMEP (2003), The White Paper on Small and Medium Enterprises of Thailand in 2003 and Trends 2004, Office of Small and Medium Enterprises Promotion, Bangkok.
OSMEP (2007a), The White Paper on Small and Medium Enterprises of Thailand in 2007 and Trends 2008, Office of Small and Medium Enterprises Promotion, Bangkok.
OSMEP (2007b), The 2nd SME Promotion Plan (2007-2011), Office of Small and Medium Enterprises Promotion, Bangkok.
OSMEP (2008), The White Paper on Small and Medium Enterprises of Thailand in 2008 and Trends 2009, Office of Small and Medium Enterprises Promotion, Bangkok.
July 2-3, 2013
OSMEP (2009), The White Paper on Small and Medium Enterprises of Thailand in 2009 and Trends 2010, Office of Small and Medium Enterprises Promotion, Bangkok.
OSMRJ (2008), Small & Medium Enterprise Development Policies in Thailand, Organisation for Small & Medium Enterprises and Regional Innovation Japan, Tokyo.
Punyasavatsut, C. (2007), SMEs in the Thai Manufacturing Industry: Linking with MNEs, accessed 15/05/2009,
http
Regnier, P. (2000), Small and Medium Enterprises in Distress: Thailand, The East Asian Crisis and Beyond, Ashgate Publishing, Burlington.
Sahakijpicharn, K. (2007), 'Guanxi Network and Business Performance of Sino-Thai SMEs', PhD Thesis, School of Economics, Faculty of Commerce, University of Wollongong.
Sarapaivanich, N. (Year) of Conference, The Use of Financial Information in Financial Decisions of SMEs in Thailand, The Small Enterprise Association of Australia and New Zealand 16th Annual Conference, Ballarat, Australia, 28 September - 1 October.
Seelanatha, S. L. (2007), 'Efficiency, Productivity Change and Market Structure of the Banking Industry in Sri Lanka'School of Accounting, Economics and Finance, Faculty of Business, University of Southern Queensland. Sharma, K. R., Leung, P. & Zaleski, H. M. (1997), 'Productive Efficiency of the Swine Industry in Hawaii: Stochastic Frontier vs. Data Envelopment Analysis', Journal of Productivity Analysis, vol. 8, 447-459.
Vu, Q. N. (2003), 'Technical Efficiency of Industrial State-Owned Enterprises in Vietnam', Asian Economic Journal, vol. 17, no. 1, 87-101.
Wadud, M. A. (2003), 'Technical, Allocative, and Economic Efficiency of Farms in Bangladesh: A Stochastic Frontier and DEA Approach', The Journal of Developing Areas, vol. 37, no. 1, 109-126.
Wiboonchutikula, P. (2002), 'Small and Medium Enterprises in Thailand: Recent Trends ', Small Business Economics, vol. 18, 213-226.
Zahid, Z. & Mokhtar, M. (Year) of Conference, Estimating Technical Efficiency of Malaysian Manufacturing Small and Medium Enterprises: A Stochastic Frontier Modelling, The 4th SMEs in a Global Economy Conference, University of Wollongong, 9-10 July.