Boston University
OpenBU http://open.bu.edu
Global Economic Governance Initiative (GEGI) GEGI Working Papers Series
2014-05
Regulating capital flows in
emerging markets: the IMF and the
Global Financial Crisis
Gallagher, Kevin P.
Boston University Global Economic Governance Initiative
https://hdl.handle.net/2144/23663
Regulating Capital Flows in Emerging Markets:
the IMF and the Global Financial Crisis
Kevin P. Gallagher and Yuan Tian1
Abstract
In the wake of the financial crisis the International Monetary Fund (IMF) began to publicly express support for what have traditionally been referred to as ‘capital controls’. In addition to public statements, the IMF underwent a systematic re-‐ evaluation of Fund policy on the matter, and published an official view on the economics of capital flows. In this view the IMF concluded that capital account liberalization is not always the most optimal policy and that there are situations where capital controls—rebranded as ‘capital flow management measures’—are appropriate. This paper empirically examines the extent to which the change in IMF discourse on these matters has resulted in significant changes in IMF policy advice. To answer this question we create a database of IMF Article IV reports and examine whether the financial crisis had an independent impact on IMF support for capital controls. We find that the IMF’s level of support for capital controls has increased as a result of the crisis and as the vulnerabilities associated with capital flows
accentuate.
Keywords: International Monetary Fund, development macroeconomics, capital flows
1 Respectively Associate Professor, Pardee School of Global Studies and co-‐director Global Economic Governance Initiative, Boston University; research fellow, Global Economic Governance Initiative and Department of Economics, Boston University. The authors wish to thank the following students in the Boston University Global Development Program for preparing the initial database and background research for this paper: Katherine Gordon, Rie Namiki, Ana Maria Santillana, and Yangling Yu. The authors would also like to thank Vivek Arora, Sarah Sanya, and Joseph Joyce for helpful comments on an earlier version of this paper. In the end, any mistakes are the responsibility of the authors. The authors wish to thank the Ford Foundation and the Center for Finance, Law, and Policy for support of this research.
May 2014 Paper 5
1. Introductory Framework and Literature Review
Sometimes financial crises make policy-‐makers stop and rethink whether they know what they think they know about how economies work and what the proper
economic policy responses should be to prevent and mitigate such crises. Was this time different? It has been well established that the International Monetary Fund (IMF), though no longer wholly opposed, was generally skeptical for the regulation of cross-‐border financial flows from the 1980s to the run up to the global financial crisis (Abdelal, 2007; Chweiroth, 2009; Moschella, 2010). In the wake of the crisis the IMF surprised many observers by openly embracing capital controls to both prevent and mitigate financial crises. The IMF supported the use of capital controls on inflows in a number of countries such as Brazil and South Korea. Most surprising to many was the IMF’s strong support of the use of capital controls on outflows in Iceland as part of that country’s post crisis stand-‐by-‐agreement (Sigurgeirsdottir and Wade, 2014). A burgeoning literature has explained the role the crisis played in the shift of discourse at the IMF on this matter (Grabel, 2011; Chweiroth, 2013; Gallagher, 2014). It is clear that the crisis played an independent part in at least accelerating an incremental level of ideational change at the fund on this issue, though the seeds of change were planted after the wave of crises that ended the century. This paper takes such analyses one step further by analyzing the extent to which such changes in discourse related to the crisis were also associated with changes in official IMF advice on managing capital flows.
A strand of theory in the international political economy literature postulates that during episodes of financial crises that firmly held ideas can be challenged by a rival set ideas about how economies work and should be managed. Under the
uncertainty that is rife in such episodes, certain key agents can be open to
alternative ideas that help manage such uncertainty. The conduits for such change can be ‘norm entrepreneurs’’ that cultivate ‘pervasive struggles’ to legitimize previously unaccepted views (Blyth 2002; Seabrooke 2007; Schmidt 2008;
Widmeier et al 2007). In the global uncertainty following the global financial crisis a significant amount of research demonstrates that the IMF changed the way it talked about global capital flows and their benefits and risks.
In the 1990s the IMF underwent a paradigm shift and began to see capital account liberalization as an optimal policy for all countries, and thus saw capital controls as an unadvisable policy. Indeed, in the 1990s the IMF went so far as to introduce a formal change to its Articles of Agreement that would have mandated open capital accounts for its membership. As a result of the financial crises of the 1990s, and actions by the United States Congress, that proposal did not come to fruition. Subsequently, the IMF became more tolerant of the gradual liberalization of the capital account and of temporary, price-‐based capital controls as a last resort for emerging market and developing countries (Independent Evaluation Office, 2005; Abdelal, 2007; Chweiroth, 2009; Moschella, 2010).
A significant shift in mainstream economic thinking regarding the regulation of capital flows occurred around the time of the crisis as well. Mainstream economic thought generally saw capital account liberalization as an optimal policy in the long run for all countries and saw the regulation of capital flows as inherently distortionary from that optimum. Certain strands of economics from the Keynes, Minsky, and Lewis traditions had long seen the regulation of capital as necessary for maintaining monetary policy autonomy, preventing financial fragility, and as levers for structural transformation. These perspectives had fallen out of the mainstream by the 1980s (Gallagher, 2014).
Around the time of the global financial crisis a consensus among mainstream began to emerge on both the theory and the econometric evidence related to capital account liberalization and the regulation of capital flows. A number of theorists began to question the extent to which capital account liberalization is optimal, especially in the presence of information externalities. According to this research, externalities are generated by capital flows because individual investors and borrowers do not know (or ignore) what the effects of their financial decisions will be on the level of financial stability in a particular nation. This is a classic market failure argument and calls for what is referred to as a Pigouvian tax that will correct for the market failure and make markets work more efficiently. These theoretical breakthroughs were further substantiated given that the vast majority of
econometric analyses of capital account liberalization find no rigorous link between capital account liberalization and growth in emerging market and developing countries, and that liberalization is often linked to banking crises (Jeanne et al, 2012). Finally, meta-‐reviews of the literature on the effectiveness as capital controls found that capital controls consistently had the desired effects of their policy-‐
makers (Magud et al, 2011; Jeanne et al, 2012). An authoritative review of the literature on these matters concluded the following:
“The international community should not seek to promote totally free trade in assets—even over the long run—because (as we show in this book) free capital mobility seems to have little benefit in terms of long-‐run growth and because there is a good case to be made for prudential and other non-‐ distortive capital controls.” (Jeanne et al, 2012, 5).
The IMF took an even larger step in accepting gradual capital account liberalization and the use of capital controls in the wake of the global financial crisis of 2008. First, it is important to note that the crisis was associated with significant surges and sudden stops in cross-‐border capital flows as Figure 1 shows, there was a sudden stop in capital flows to emerging market and developing countries as a result of the crisis—with investors flocking to the ‘safety’ of industrialized markets.
Figure 1 All Emerging Market: Gross Capital Inflows 1998-‐2012
Source: IMF, International Financial Statistics, 2014
However, as nations such as the United States engaged in expansionary monetary policy, investors again began to surge into emerging markets. It is under this turbulent period that then managing director Dominique Strauss Kahn ignited a sense of new thinking within the Fund in hopes that it would revive interest in the IMF, given that global regard for the institution had waned significantly. Norm entrepreneurs within the research department seized that moment and published articles that found that those countries that deployed capital controls going into the crisis were among the least hard hit (Ostry, et al, 2010). These findings were
supported and promoted by the managing director and led to an eventual official re-‐ evaluation of the IMF position on capital account liberalization and capital controls. This re-‐evaluation was hotly contested within the board of the IMF, with the BRICS countries leading an efforts to grant the most policy space possible for emerging markets to regulate capital flows (Chwieroth, 2013; Gallagher, 2014). In December 2012, IMF adopted a ‘New Institutional View’ on capital flow management (IMF, 2012). In the new view, the IMF now recognizes that capital flows carry risks and that the liberalization of capital flows before nations reach a certain threshold of financial and institutional development can accentuate those risks. The IMF also now acknowledges that under certain circumstances, cross-‐border capital flows should be regulated to avoid the worst effects of capital flow surges and sudden stops. These tenets were incorporated into a Staff Guidance note in 2013 and since that time are intended to guide official IMF policy advice on the matter (Grabel 2011; Chwieroth, 2013; Gallagher, 2014).
While there is an emerging literature on the extent to which the IMF has changed its policy and discourse with respect to managing capital flows, there is yet systematic research that quantitatively examines the extent to which the IMF has actually changed its policy advice. There is a significant literature that attempts to quantify
-‐10 -‐5 0 5 10 15 20 25 30 1998q1 1999q1 2000q1 2001q1 2002q1 2003q1 2004q1 2005q1 2006q1 2007q1 2008q1 2009q1 2010q1 2011q1 2012q1 % of G DP Median 25th percentile 75th percentile
the extent to which the IMF has changed its behavior in other issues. Vreeland (2003), Pop Ecles (2008), Thacker (2009), Bird and Rowlands (2009), and
Presbitero and Zazzaro (2012) have all examined the quantitative determinants of IMF lending programs in different settings.
There is also one article that empirically examines the relationship between the IMF and policy on capital flows. Joyce and Noy (2008) empirically examine the extent to which IMF country programs in the 1980s and 1990s were associated with policies to liberalize the capital account. The authors do indeed find evidence that IMF programs were correlated with capital account liberalization. Roy and Ramos (2012) examine Article IV reports to identify whether the IMF has changed its policy advice after the crisis. For their paper they read 26 reports in 2010 and did not see much of a change in IMF behavior. In the spirit of Joyce and Noy, our paper is the first to our knowledge that econometrically examines the extent to which the IMF has demonstrably changed its advisory behavior as manifest in official Article IV reports both before and after the global financial crisis.
2. Data and Methodology
The specific research questions for this paper are: To what extent has the IMF changed the way it views capital flows, and to what extent has the IMF increased its level of support for capital controls in the wake of the financial crisis? This section of the paper describes the mechanics of the database that was created to answer our research question and outlines the econometric model and methodology for the research as a whole.
2.1 Database
Our study is based on a unique dataset created from IMF annual Article IV reports since 1998. We built a database focusing on capital flow management and related policies for 31 emerging markets covering Asia, Latin America and Caribbean, Europe and Africa. This database includes coding IMF Article IV Consultation Reports and Public Information Notice well as collecting country-‐specific macroeconomic data from the World Bank World Development Indicators database (IMF, 2013; World Bank, 2014).
Our coding method is derived from a 2005 IMF Evaluation Report prepared by the
Independent Evaluation Office titled The IMF's Approach to Capital Account
Liberalization (IMF, 2005). In that report, through in a more qualitative manner and with a smaller set of countries, the IMF’s Independent Evaluation Office (IEO) assessed the level of IMF support for capital account liberalization and capital controls in the wake of the financial crises in the 1990s. Juxtaposed with the new data we derive from IMF Article IV reports, we include macroeconomic data such as current account balance, domestic credit of the banking sector and external debt
payments. Overall, our database includes 528 observations of 33 countries in 16 years (1998-‐2013).
2.1.1 Coding Criteria
Figure 1 shows the coding process and the coding manual is in the online appendix. For each Article IV report, we first code the IMF initial diagnosis by examining whether the IMF deems capital flows as an area of concern for a country undergoing an Article IV consultation. Key words were searched and read for were those such as ‘capital flow measures,’ ‘capital controls,’ ‘financial stability,’ ‘surge,’ ‘sudden stop,’ ‘unremunerated reserve requirement,’ ‘capital account deficit,’ ‘inflows/outflows,’ ‘exchange rate risk,’ ‘debts denominated in foreign currency,’ and others.
Keywords of a capital flow issues include ‘external shock,’ ‘external instability,’ ‘adverse shocks related to global stress,’ ‘adverse spillovers arising from the global turmoil,’ ‘contagion,’ ‘foreign exchange pressures,’ ‘rising external imbalance’, ‘external financial environment,’ ‘balance of payment pressure.’
Secondly, we code the IMF’s policy recommendations to remedy concerns related to capital flows. We code each policy recommendation separately, corresponding with the measures coded by the IEO in their 2005: Tighten Fiscal Policy, Exchange Rate Flexibility, Sterilization/Intervention in the currency market, Trade Liberalization, Tighten Prudential Regulation, Capital Flows Management/Capital Controls.
Finally, if the IMF has a policy recommendation with respect to Capital Flow Management measures or capital controls, we code the IMF’s level of support for such measures. A common response to managing capital flows is to tighten fiscal policy. Any recommendation to engage in fiscal tightening is in response to macroeconomic factors. Key words in tightening fiscal policy include overheating economy, risk, ease burden on monetary policy, cushion to weather shock, response to a possible surge in capital inflows, inflation resulting from an external situation. Exchange rate flexibility is also advocated by the IMF and others as tool to temper swings in capital flows. A flexible exchange rate can be a shock absorber in the event of capital inflow surge. For sterilization /intervention in the foreign exchange markets, we read for endorsements of a reserve build-‐up, higher reserve levels would help guard against capital account shocks, intervention in FX markets to smooth volatility and enhance liquidity, reserve accumulation, purchases of foreign exchange.
Tighten macro prudential policy key words are capital requirements for banks, bank soundness, systemic risk, Basel III, improve supervision and regulation, guard against risk, measures to prevent liquidity crisis in banking system, raising capital adequacy ratio, reinforcing financial soundness, promoting financial sector deepening.
We also code IMF recommendations with respect to CFMs. The key words includes: capital controls2, capital flow measures, CFM, unremunerated reserve requirement, impact of capital controls/ ineffectiveness, capital account regulation of a prudential nature, and so forth.
There are numerous kinds of CFMs or capital controls, such as taxes on the inflow or outflow of capital, quantitative measures on the repatriation of portfolio investments, exit levies,; prohibition of foreign purchase or holding of domestic assets; requirements to obtain administrative permission for a foreign bond issue; minimum maturity period for foreign bond issues;; taxes on purchases of domestic assets by foreigners or on investment income earned by foreigners; reserve requirements on deposits held by foreigners and others (see Gallagher, 2014). Level of support for capital controls are divided into four groups: not supportive (phase out controls, controls are ineffective, drawbacks, elimination of controls as a positive step, negative effects of capital controls), not mentioned, partially supportive (management of temporary surge, could be an option, part of a transitory response) and fully supportive. We code these as -‐1, 0, 1, and 2, respectively. Figure 1 outlines our coding methodology in greater detail.
2 If controls are mentioned in the context of FDI, we still code it as a mention and add comments in separate column, specifying the type of capital flow (inflows or outflows) and the type of capital control.
Figure 2 Coding Process
Reconciliation and Merge: Coders discuss discrepancies and make correponding modimications to create a minal dataset
Final Coding: coders code independently and cover the full set of article IVs.
Reliability check and Oinal codebook revision: coders discuss issues case by case and point out continuing coding discrepancies. Coding manual is modimied to account for discrepancies.
Entire set: team of coders is assigned countries in different categories.
Codebook ModiOication: discuss and modify problematic codes. Modimied code manual is given back to coders.
Bias Control Test: inter coder statistics are calculated on the coding sample. Compare results and test reliability.
Random Sample Coding: given the same coding sample from database , coders code independently.
Coding Manual Creation: develop codebook based on initial reading of IEO evalution report and IMF institutional views. Loop until pass the test Entire Dataset Coding Random Sample Coding
2.1.2 Tests on Bias Control
To control the coding bias among different coders, we apply the kappa and concordance methods. These methods are widely used in survey and coding literature, especially medical science. The estimators are an inter-‐coder agreement measure describing the reliability of the coding. What all inter-‐coder agreement measures do is adjust for this level of chance in some way.
The standards for what suffices in terms of an acceptable 'threshold' (e.g. 60% inter-‐ coder agreement) are well defined based on specific cases and not fixed. The higher the agreement estimators are, the more consistent the coding is. They give feedback on whether and how to adjust the coding. In addition, this helps the team of coders to be on the same page and make precise quantitative coding.
The process of coding at its initial stage is an iterative process. After adapting the codebook and communicating together as a group to perfect the procedure of coding, we reach an inter-‐coder reliability scores of 88.7%.
To measure the inter coder variation so that two or more independent coders are evaluation the same thing, we use kappa statistic as a numerical rating of the degree to which the coding is consistent. First, five coders are coding independently on the same country-‐-‐-‐ Columbia 1998-‐2012 Article IVs. Each coder codes 15 observations on policy indicators and capital control measures. Second, coders discuss the differences and compare each coding results with the corresponding sources. Disagreements are settled on specific issues and the team comes up with the first draft of coding manual. Then, coders are re-‐coding again based on the manual. After several rounds of discussion and review, the coding results are pooled together and kappa statistics are calculated.
The calculation is based on the difference between how much agreement is actually present compared to how much agreement would be expected to be present by chance alone. Kappa is a measure of the difference between the observed and expected agreement, standardized to lie on a -‐1 to 1 scale.
Table 1: Inter Coder Variation on Level of Supports in Capital Controls
Outcome Kappa Statistic Z Prob>Z
0 0.5076 5.31 0.0000 1 0.3647 3.45 0.0003 2 0.4663 6.08 0.0000 3 0.0119 0.16 0.5617 Combined 0.4280 6.58 0.0000
Table 1 indicates the average outcomes obtained from the pool of five coders. Based on the general criteria as shown in Graph 1, the kappa statistic scores for 0 and 2 are moderate, 1 is fair while 3 is poor. The kappa-‐statistic measure of agreement is scaled to be 0 when the amount of agreement is what would be expected to be observed by chance and 1 when there is perfect agreement.
Figure 3 Interpretation of Kappa
The estimated kappa itself could be due to chance. The P value and z statistics of kappa reports the variance of kappa. We eliminate the case of estimated kappa due to chance with statistically significant kappa above 0.
To evaluate the quality of coders’ coding, we also calculate the correlation and apply the concord commend in STATA for any two coders. Concordance correlation coefficient (Lin, 1989, 2000) reflects a statistic comparison between different coders. This helps to find the difference between two coders. Here we report the correlation coefficient of 5 coders on coding Columbia Article IVs in Table 2. We find coder1 and coder 3 has the highest correlation while there are disagreements among coder 2 and coder 4. Coder 2’s coding has the relative poor quality and the group discussion solves the disagreement term by term.
Almost Perfect 1.0 Substantial . 80 Moderate .60 Fair .40 Slight .20 Poor 0.0 Agreement Kappa:
Table 2: Correlation between raters on all coding observations Correlation Coder0 Coder1 Coder2 Coder3 Coder4
Coder0 1.0000 Coder 1 0.6035 1.0000 Coder 2 0.3671 0.1364 1.0000 Coder 3 0.7493 0.8870 0.3155 1.0000 Coder 4 0.6187 0.5581 0.1527 0.6954 1.0000
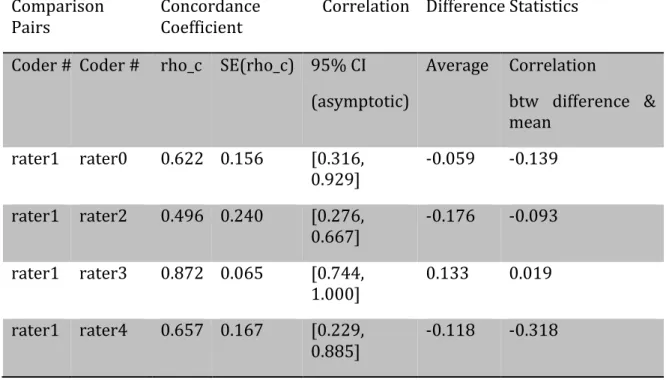
After recoding the disagreement term together, we calculate the concordance correlation between coders again. The reason to introduce Lin’s concordance method is that it is robust on as few as 10 pairs of data, which is more suitable in our coding situation. The results are summarized in Table 3. We reach an agreement with concordance correlation coefficient (>0.8: substantial; >0.6: moderate). The average of differences between coders is controlled under 0.2.
Tests on bias control are helpful in amendments and give suggestions on revising. It’s important to detect the difference before generating to other countries. On the other hand, case study also plays an important role in the coding process. It provides efficient coding process.
In sum, the final coding manual passes the moderate level of inter coder agreement statistically. Our coding results among all countries across time are consistent and the team has the unified criteria on quantifying the policy factors. The level of supports on capital controls are coded neutrally according the reports sentence by sentence. The evaluation from 5 coders is on the same level statistically, taking into consideration the variation by chance.
Table 3: Concordance Correlation Coefficient Comparison
Pairs Concordance Coefficient Correlation Difference Statistics
Coder # Coder # rho_c SE(rho_c) 95% CI (asymptotic) Average Correlation btw difference & mean rater1 rater0 0.622 0.156 [0.316, 0.929] -‐0.059 -‐0.139 rater1 rater2 0.496 0.240 [0.276, 0.667] -‐0.176 -‐0.093 rater1 rater3 0.872 0.065 [0.744, 1.000] 0.133 0.019 rater1 rater4 0.657 0.167 [0.229, 0.885] -‐0.118 -‐0.318
After several rounds of kappa and concordance tests, we improve the coding manual and come up with a consistent result. At the end of the coding, we go through all the coding results to check and correct for consistency, taking into account the structural relationship between each element of every observations. We also fill 0 to the blank cells to complete the data set based on the related report reference.
2.2 Econometric Methodology
Given the dataset coded from Article IV Reports, we apply OLS regression in a reduced-‐form econometric model to examine the extent to which the IMF has changed its diagnoses of the role of capital flows and whether the IMF has significantly changed its level of support for CFMs as a result of the crisis. Thus, our model is built to analyze whether the IMF’s view on capital flows is affected by the financial crises and the vulnerability of the economy. It also takes the country fixed effect into consideration and runs the robust regression on the panel dataset from 2000 to 2013.
The reasons for choosing the time period after 2000 in the regressions are: on one hand, IMF policy response to capital flows for the 1998-‐2000 periods is influenced by the Asian Financial Crises; on the other hand, during the 1998-‐2000 periods, most of the data is based on Public Information Notice while after 2000 most are full Article IV reports. Thus, to have a more reliable data information pre and post 2008 Financial Crises, it makes sense to choose the analysis period after 2000.
2.2.1 Model Equations
The research question is to examine the extent to which the IMF policy advice on capital flows after the financial crises. In other words, did the 2008 global financial crises change the IMF initial diagnosis of capital flows issues for emerging markets? Are the Capital Flow Management measures mentioned more frequently after the crises happened? If the emerging market has a capital flow issue, how does the IMF’s level of support for CFMs vary?
Based on these research questions, the regression models are built on the following equations in the reduced forms:
𝐼𝑀𝐹𝑑𝑖𝑎𝑔𝑛𝑜𝑠𝑖𝑠!" =𝛼!"+𝛽!"𝐶𝑟𝑖𝑠𝑒𝑠!+𝛾!"𝑋!"+𝜖!"
𝑀𝑒𝑛𝑡𝑖𝑜𝑛𝐶𝐹𝑀!" =𝛼!"+𝛽!"𝐶𝑟𝑖𝑠𝑒𝑠!+𝛾!"𝑋!"+𝜖!"
𝐿𝑒𝑣𝑒𝑙𝑜𝑓𝑠𝑢𝑝𝑝𝑜𝑟𝑡!" =𝛼!"+𝛽!"𝐶𝑟𝑖𝑠𝑒𝑠!+𝛾!"𝑋!"+𝜖!"
𝐼𝑀𝐹𝑑𝑖𝑎𝑔𝑛𝑜𝑠𝑖𝑠!" is coded from the Article IV report of country 𝑖 at year 𝑡 on whether
there is a mentioned issue of capital flows. 𝑀𝑒𝑛𝑡𝑖𝑜𝑛𝐶𝐹𝑀!" is coded on the
appearance of CFMs after there is an initial diagnosis from the
report. 𝐿𝑒𝑣𝑒𝑙𝑜𝑓𝑠𝑢𝑝𝑝𝑜𝑟𝑡!" measures quantitatively the attitude of IMF towards the
CFM policies. 𝐶𝑟𝑖𝑠𝑒𝑠! is the dummy variable which takes 1 after 2008 and 0
otherwise.
𝑋!" is the macroeconomic fundamentals that measures the capital vulnerability of
the emerging markets. Since different emerging markets have different economic situations, we include a list of macro fundamental measures as the fixed effects in the econometric regression. Our selection of macro variables is based on the Economist 2013 Capital Freeze Index (Economist, 2013). We make a modified selection of the variables and pick first three key elements: current-‐account balance as % of GDP (CAB), short-‐term gross external debt plus external debt payments as % of foreign-‐exchange reserves (EDP), and domestic banking-‐sector credit as % of GDP (DBC).
Current-‐account balance is defined by the sum of the value of imports of goods and services plus net returns on investments abroad, minus the value of exports of goods and services. When a country's current account balance is positive (surplus), the country is a net lender to the rest of the world. When a country's current account balance is negative (deficit), the country is a net borrower, making the domestic economy more vulnerable and dependable on the global economy.
For example, South Africa’s current account deficit is high relative to that of other EMEs and is financed by relatively volatile capital inflows. Foreign direct investment has typically been smaller than in other emerging markets, averaging just over 1 percent of GDP in the past ten years compared to around 3 percent of GDP for the median of EMEs. Instead, South Africa has been more reliant on portfolio flows,
important mitigating factors. External debt is low (26 percent of GDP at end-‐2008), over 40 percent of which is denominated in rand. Banks, corporations, and households have limited foreign currency balance sheet exposure. Capital inflows are predominantly in the form of equity, and hence denominated in rand, while the exchange rate floats. Should capital outflows reemerge, foreign investors would share the adjustment burden—as they did in late 2008 when the stock market declined and the rand depreciated sharply.
External debt is that part of the total debt in a country that is owed to creditors outside the country. The more debt the country owes the outside markets, the higher risk the economy bears and the less reliable the economy is. Domestic credit provided by the financial sector includes all credit to various sectors on a gross basis. The banking sector includes monetary authorities and deposit money banks, as well as other banking institutions where data are available. Examples of other banking institutions are savings and mortgage loan institutions and building and loan associations. It’s a measure of the health of the banking sector of the economy and highly related with the vulnerability of the capital markets.
Here we first use current account balance, domestic banking-‐sector credit, and external debt payment separately. Second, we generate a composite of these three components called Capital Vulnerability Measure (CVM) following the rule of Capital Freeze Index (CFI). Then use CVM as one single independent variable in our regressions. Third, we add the multiplication term of the control variables and the crises dummy in the regression. This aims at investigating the response reasons of the IMF changes after the crises.
The regression equation is
𝑌!" =𝛼!"+𝛽!"𝐶𝑟𝑖𝑠𝑒𝑠!+𝛾!"𝑋!"+𝛿!"𝑋!"∙𝐶𝑟𝑖𝑠𝑒𝑠!+𝜖!"
Where 𝑌!" stands for capital flow diagnosis, CFM mention or support for capital
controls. 𝛿!" measures how likely IMF is to respond to the specific economic
indicator 𝑋!" with 𝑌!" after the 2008 crises.
The reason we exclude financial openness (Chin and Ito, 2008) in our measure CVM is that there exists a co-‐linearity between CAB/EDP and financial openness. As a measure of financial openness, Chin-‐Ito index is a summary of IMF’s questions on countries about their capital accounts which includes the current account balance of the country and other related variables. Without loss of generality, we also adopt the Chinn-‐Ito capital openness index separately as an indicator of the economy’s capital openness to see the impacts on IMF’s institutional view.
Last but not least, we run the regression for different regions separately. We divide the emerging markets into four groups: emerging Asia, emerging Latin America and Caribbean, emerging Europe and emerging others. Cross-‐border capital flows are easier and more frequent inside the group than between groups. This region separation can be regarded as the regional effects in capital flow liberalization.
2.2.2 Expected Results
The model is to test whether the crises had an effect on IMF advice to emerging markets. If the IMF had changed its advice as a result of the crisis we would expect to observe more diagnoses on capital flow issues after 2008 and IMF’s attitudes towards CFMs are more supportive than before. The 2008 global financial crises have a tremendous influence on the emerging markets, especially for the cross-‐ border capital flows. IMF’s change in CFM advice will result in significant policy changes in the developing countries. Our research results are expected to give solid quantitative evidence on the IMF policy shifts and institutional view switches.
The coefficient of Crises measures not only the direction of the changes but also the magnitude of the effect. We test on whether it’s significantly different from zero and interpret as a shift of regime after the crises. A comparison between whether to include the macro fundamentals is helpful in understanding these changes and seeking the underlying mechanism which causes these changes. In addition, the decision on the choice of macroeconomic variables shed light on how different channels interrupt with each other and which part affects the cross-‐border capital flows more significantly.
Controlling for the vulnerability of the economy improves the fitness of the model though there is a loss on the number of observations. The more vulnerable the emerging market is (the larger the capital freeze index), we would expect a higher chance to be diagnosed of capital flow issues initially, the less likely there is a mention of CFM due to the instability of economy. Otherwise, the coefficients of CVM are insignificantly different from zero. The R-‐square indicates the goodness to fit of the econometric model. Due to the small size of the dataset as well as that crises might not be the major reason for IMF’s change in the capital flow issue; we might expect a small R-‐square.
The regression results will give useful suggestions to analyze the IMF’s institutional view with respect to the capital flow liberalization policy, taking the economy vulnerability index into account. Volatile international capital flows has cross-‐ border financial shocks which influenced the boom-‐and-‐bust cycle as well as domestic banking credit. It’s necessary to keep a consistent record of the capital flow management policies and learn from the history lessons after the financial
3. Results
3.1 Summary Statistics
We present summary statistics for the dataset as a flow chart in figure 4. Figure 5 presents summary statistics for the key variables used in the analysis. Figure 6 and 7 demonstrate the level of supports through a breakdown by region and crises event.
An important issue is the representativeness of the sample. We adopt the country
list posted by IMF authority and compare our coding statistics with the IMF dataset3
between 1998 and 2000. Our dataset mirrors with their summary table by 90%. The results show that our sample is fairly representative in terms of all dimensions (country, region and coding criteria).
3.1.1 Flow Chart
Figure 4 Summary statistics of coding on capital flows
Among all 320 available observation of IMF initial diagnosis during 2001-‐2013, 75.6% of Article IV reports mentioned capital flows as an issue of concern for the country. Besides, CFMs are a major suggestion as 40.5% of the IMF initial diagnosis. Though capital flow management is considered to be an issue, it often comes along with macro prudential policies and sterilization/intervention in foreign exchange markets. Therefore, CFM not mentioned for a diagnosis is not equivalent to the CFM’s ineffectiveness but other policies alone can work out during the current period.
With a mention of CFM, 61 out of 98 cases gain supportive advice from the IMF with 3 special cases of fully support. There are only 8 neutral cases in level of support, which indicates IMF’s CFM policies usually come with a degree of either supportive or not supportive. It’s of interest to see the distribution of level of support in
IMF initial
diagnosis • 78 obs coded 0 as capital mlows not an issue. • 242 obs coded 1 as capital mlows mentioned.
Mention of CFMs
• Among 242 diagnosis, 144 obs have no CFM mention. • 98 out of 242 have CFMs mentioned literally.
Level of Support
• Among 98 CFM cases, 29 (30%) are coded not supportive.
• 58 (60%) are partially supportive. • 8 neutral cases and 3 fully
different years. The changes in the structure of level of support are signals of IMF’s policy switches therefore help understand the global evolvement of capital flow liberalization.
Figure 5 Proportions of level of support in terms of total mention of CFMs
From Figure 5, we can summarize that:
• Mention of CFMs (the total number of all IMF initial diagnosis with CFM
mentioned) became more frequent since 2008.
• The level of support in capital flow liberalization is increasing tremendously,
transferring from not supportive to partially supportive or even fully supportive.
• Neutral cases, which represent no attitude toward capital flows given CFM
mentioned, are rare. (2002-‐2004 Chile, 2009 South Africa, 2011 Venezuela).
• The level of support is more relevant after 2010 when the IMF starts its New
Institutional View. Capital controls are open in 2005 and 2012.
The number of countries that have Article IV reports before and after crisis has been balanced. Before the crisis, 12.2% of the countries observed gain partial support for capital controls from the IMF, 11.6% of the countries observed gain total support, while after the crisis the proportions are 22.3% and 7% respectively.
200 1 2002 2003 2004 2005 2006 2007 2008 2009 2010 2011 2012 2013 Supportive 3 3 2 3 5 2 1 2 2 8 10 12 4 Neutral 0 1 1 1 0 0 0 0 1 1 1 0 0 Not supportive 5 3 3 2 0 4 2 4 2 2 1 0 0 0 2 4 6 8 10 12 14 Men tion of CFMs
Table 4 Correlation between different policy suggestions
Correlation Fiscal
Policy Exchange Rate Sterilization/ Intervention Trade Liberalization Macro-‐prudential
Tighten Fiscal Policy 1.0000
Exchange Rate Flexibility 0.2395 1.0000
Sterilization/Intervention 0.0531 0.2788 1.0000
Trade Liberalization 0.1018 -‐0.0494 -‐0.0774 1.0000
Tighten Macroprudential 0.2480 0.2778 0.2375 0.0267 1.0000
Mention of CFMs 0.1131 0.1909 0.1971 0.0820 0.1981
Table 4 reports correlation coefficients among different types of IMF advice on capital flows. To things stand out that our relevant to this study. First, Exchange rate flexibility comes along with sterilization/intervention in the FX market and tightening prudential regulations. Second, mention of CFMs is most related with macro prudential regulation policy.
3.1.2 Examples from Reports
The major concern about the coding process is the difficulty to narrow down or categorize the IMF’s views as expressed in Article IV reports. For example, the report might make a reference to the “liberalization of the trade and exchange system,” which may or may not include capital account liberalization. On the other hand, the absence of an explicit reference doesn’t mean that the IMF never expressed a view during the policy dialogue meeting process. In this section of the paper we note illustrative examples of diagnosis and support that were coded in the paper.
Capital Flows Mentioned as an Issue:
• Guatemala 2006: "Money and credit expansion has been rapid as a result of
high liquidity associated with strong capital inflows"(2#3); “short-‐term goal is to maintain macroeconomic stability” (13#15).
• South Africa 2009: “The global financial crisis of late 2008 sharply changed
the outlook for an already slowing economy and posed new challenges for macroeconomic policies. Large capital outflows, triggered by investor withdrawal from emerging market assets lowered stock prices and depreciated the rand. South Africa-‐specific factors, such as the high current
account deficit and policy uncertainties created by the upcoming national elections in April 2009, also contributed to an elevated perception of risk” (5#2.1).
• Colombia 2010: “It would be advisable to consider possible responses to a
surge in private capital inflows” (11#16).
• Republic of Korea 2012: “Reflecting swings in global risk aversion, capital
flows into Korea have been highly volatile. Following the August–September 2011 spike in risk aversion, Korea witnessed a surge in capital outflows of around US$15 billion (including outflows from European banks) in the third quarter” (5#7).
• Thailand 2012: “In line with other emerging markets, capital flows became
markedly more volatile and are likely to remain so in the near future” (17#30).
Capital Flows Not Mentioned as an Issue:
• Guatemala 2012: “Capital inflows” are mentioned but “vulnerabilities remain
limited”, no problems are foreseen relating to capital inflows or outflows (2#2).
CAPITAL FLOW MEASURES Mention of CFMs
• Thailand 2010: “Relaxed regulations on capital outflows: The Thai
authorities relaxed regulations for domestic residents to invest in foreign securities in two steps, first in August 2009 and then in February 2010, to encourage capital outflows so as to abate the upward pressure on the baht. While the new ceilings are far from binding, Thai investors continue to accumulate foreign assets, suggesting that the measures have been successful” (BOX 2 p.23).
• South Africa 2011: “Authorities4' Views: Capital Flow Measures. With limited
scope for modifying the monetary and fiscal settings in the near term and the rand on the strong side of fundamentals, there is arguably a case for using either an unremunerated reserve requirement or a small tax on inflows to try to curtail inflows or at least change their composition (18#28.3); As for CFMs, the authorities agreed with staffs that their effectiveness is questionable. Moreover, they stressed the need to take a close look at each country’s
circumstances in deciding on the adoption of CFMs. In South Africa, curtailing inflows while the country is also relying on them to finance domestic consumption and investment would be problematic (20#29).
In the IMF Article IV reports, there are three groups of authors: the authorities, the staffs, and the directors. Basically, the first part of the reports is drafted by the staffs, who specialize in one emerging markets. They quoted authorities’ views from economists of the central bank of the country and gave detailed analysis on country’s economy. The directors gave their opinions on policy and wrote the second part of the reports. We obtain the level of supports for capital controls from the Directors’ view under the assumption that the staffs and directors share a consistent goal in advising the country’s policy decisions. This assumption works for most emerging markets cases with minor fluctuations due to systemic difference between staffs and directors.
Level of Support for Capital Controls Examples of Not Supportive:
• Malaysia 2001: “Directors also welcomed the recent removal of the
remaining levy on profit repatriation of portfolio capital, and a few Directors urged the authorities not to resort to capital controls in the event of a deteriorating external position in the future." (p.3, PIN)
• Malaysia 2003: “They supported the authorities' approach to gradually
liberalize the remaining administrative measures on capital flows" (p.5, PIN)
• Malaysia 2011: “There is also no evident need for capital controls to dampen
the volatility of flows." (7#14)
• Colombia 2007: “[Capital] controls are unlikely to be effective over the longer
term and are at odds with the government’s desire to deepen Colombia’s financial markets through the increased participation of foreign capital. The staff’s preliminary assessment is that in the short run, the controls reduced portfolio inflows and borrowing” (22#34) & in regard to exchange rate, “Staff welcomes the relaxation of capital controls undertaken in December, and recommends that the authorities consider a complete phasing out of the controls in the near term, given their limited effectiveness” (26#45)
• Colombia 2008: “The controls were also associated with a significant
increase in exchange rate volatility. In light of their limited effectiveness and adverse effects on volatility and asset market development, staff saw significant drawbacks to the controls” (23#33)
Examples of Partially supportive:
• Malaysia 2002: “While recognizing that capital controls have played a role in
helping Malaysia to regain financial stability, and that most of the remaining measures are mainly capital account regulations of a prudential nature, a few
Directors5 encouraged the authorities to further relax them.” (p.5, PIN)
• South Africa 2005: “The authorities have continued with their gradual
approach to relaxing capital controls. Staff welcomed the easing that took place over the past year, including the removal of limits on outward foreign direct investment. The main remaining restrictions comprise limits on overseas investments by institutional investors and the prohibition of portfolio investment abroad by non-‐financial firms. The authorities indicated that they were considering moving from exchange controls to a system of prudential regulations for institutional investors. Staff supported this initiative and favored a further easing of restrictions on non-‐financial firms. In its view, all these measures would increase market liquidity and allow greater risk diversification, and could reduce currency volatility (15#29).
• Chile 2006: “In recent years, the domestic bond market has grown steadily,
but it remains characterized by a relatively low level of activity. Staff recommended that liquidity be improved by relaxing some of the investment restrictions on the private pension funds and reviewing the procedures surrounding the taxation of foreign investors. Staff also suggested removing the distortions caused by the stamp tax and considering introducing a system of specialists in public debt with obligations tailored to the needs of the market (p.17#30); improving liquidity in the capital market is a priority. The government is encouraged to develop a medium-‐term public debt strategy, beyond the political cycle, and decide if it will maintain a presence in issuing bonds. Regulations are needed to clarify exemptions from capital gains tax for foreign institutional investors. This may help enhance further the development of the financial sector and contribute to internationalizing the peso.” (p.23#44)
• Thailand 2008: “They welcomed the removal of capital controls, providing a
clear signal of the authorities' intention to support market-‐friendly policies.” (EBA#2).
• Malaysia 2012: “Dealing with capital flows. Malaysia has been exposed to
volatile capital flows, and this is likely to continue in the near term. The policy response so far, characterized by two-‐way exchange rate flexibility while smoothing excessive exchange rate fluctuations, has been successful.