WO R K I N G PA P E R S E R I E S
ISSN 1561081-0N O 6 1 6 / A P R I L 2 0 0 6
GLOBAL FINANCIAL
TRANSMISSION OF
MONETARY POLICY
SHOCKS
by Michael Ehrmann
In 2006 all ECB publications will feature a motif taken from the €5 banknote.
W O R K I N G PA P E R S E R I E S
N O 6 1 6 / A P R I L 2 0 0 6
This paper can be downloaded without charge from http://www.ecb.int or from the Social Science Research Network electronic library at http://ssrn.com/abstract_id=891018
GLOBAL FINANCIAL
TRANSMISSION OF
MONETARY POLICY
SHOCKS
1by Michael Ehrmann
2and Marcel Fratzscher
2© European Central Bank, 2006
Address Kaiserstrasse 29
60311 Frankfurt am Main, Germany
Postal address Postfach 16 03 19
60066 Frankfurt am Main, Germany
Telephone +49 69 1344 0 Internet http://www.ecb.int Fax +49 69 1344 6000 Telex 411 144 ecb d
All rights reserved.
Any reproduction, publication and reprint in the form of a different publication, whether printed or produced electronically, in whole or in part, is permitted only with the explicit written authorisation of the ECB or the author(s).
The views expressed in this paper do not necessarily reflect those of the European Central Bank.
The statement of purpose for the ECB Working Paper Series is available from the ECB website, http://www.ecb.int.
C O N T E N T S
Abstract 4
Non-technical summary 5
1. Introduction 7
2. Related literature and hypothesis formulation 8
2.1 Monetary policy and equity markets 9
2.2 International financial market linkages 10
2.3 Explaining linkages 11
2.4 Hypotheses and contribution 11
3. Data 12
3.1 Financial market data 12
3.2 Monetary policy shocks 13
3.3 Integration and macroeconomic
determinants 14
4. Benchmark model of financial transmission 15
4.1 Benchmark results 15
4.2 Cross-country and cross-sector
heterogeneity 17
5. Transmission channels 18
5.1 Channel 1 – US asset price reactions 18
5.2 Channel 2 – Foreign asset prices 20
6. Determinants of financial transmission 22
6.1 The role of macroeconomic policies 22
6.2 The role of trade and financial integration 24
7. Conclusions 26
References 28
Annex 1: Country and sector coverage,
Datastream stock price indices 31
Annex 2: Variable definitions and sources 32
Figures and tables 33
Abstract
The paper shows that US monetary policy has been an important determinant of global equity markets. Analysing 50 equity markets worldwide, we find that returns fall on average around 3.8% in response to a 100 basis point tightening of US monetary policy, ranging from a zero response in some to a reaction of 10% or more in other countries, as well as significant cross-sector heterogeneity. Distinguishing different transmission channels, we find that in particular the transmission via US and foreign short-term interest rates and the exchange rate play an important role. As to the determinants of the strength of transmission to individual countries, we test the relevance of their macroeconomic policies and the degree of real and financial integration, thus linking the strength of asset price transmission to underlying trade and asset holdings, and find that in particular the degree of global integration of countries – and not a country’s bilateral integration with the United States – is a key determinant for the transmission process.
JEL No.: F36; F30; G15.
Keywords: global financial markets; monetary policy; transmission; financial integration; United States; advanced economies; emerging market economies.
Non-technical summary
How are shocks transmitted through international financial markets? And through which channels does the transmission process take place? The difficulty of answering these questions is that asset prices, domestically as well as internationally, are determined simultaneously, and hence it is difficult and complex to understand the underlying causality in the transmission process. This paper focuses on one particular type of shock – a US monetary policy shock – to analyse the financial transmission across equity markets for a broad set of 50 equity markets, including those in all major advanced economies and emerging market economies.
There are two key advantages to this approach: first, we are able to obtain a truly exogenous shock to financial markets; our measure of US monetary policy shocks is based on the reaction of Federal funds futures in the 30-minute period around the announcement of FOMC decisions. Second, monetary policy is one of the most important drivers of global financial markets and thus understanding the transmission of such shocks is relevant for gauging the overall financial linkages and integration across equity markets.
In our empirical analysis, we find that a 100 bp tightening of US monetary policy reduces equity returns on average by 3.8%. We show that there is a substantial degree of heterogeneity in the effect of US monetary policy on country-specific and sector-specific equity returns. For the cross-country heterogeneity, a few local equity markets – such as those of China, India and Malaysia – change hardly at all while others react substantially to US monetary policy shocks – in particular those in Hong Kong, Indonesia, Korea and Turkey among emerging markets, and Australia, Canada, Finland and Sweden among advanced economies – in some cases by 10% or more in response to a 100 bp change. For the cross-sector heterogeneity, the effects of the transmission vary from a reaction of 1.6% for utilities to 7.4% for the information technology sector.
The paper then analyses the transmission channels of the US monetary policy shocks, distinguishing between two separate channels –via US asset and foreign asset prices respectively. We find that in particular the transmission via US and foreign short-term interest rates as well as the exchange rate play an important role. The transmission of US monetary policy shocks is found to be particularly strong when the US short-term interest rates react strongly, as well as when the reaction of the exchange rate is large. Analysing the macroeconomic determinants for the strength of spillovers, we find particularly strong transmission for countries that have open and relatively liquid financial markets. Moreover, there is substantial evidence that the transmission process is related to the degree of real and financial integration: equity markets in countries that are relatively open to trade and in particular those that hold a large magnitude of cross-border financial assets react two to three times more strongly to US monetary policy shocks than those of less integrated countries. A striking finding is that it is the degree of integration with the entire rest of the world that appears to matter for the financial transmission process, and not the bilateral integration of countries with the United States. This underlines the complexity of the overall transmission process and of financial linkages.
Finally, we find that the transmission of US monetary policy shocks is very similar in strength and nature to the general equity market linkage between the US and foreign markets on days when no monetary policy decisions take place. Furthermore, the paper shows that the same range of macroeconomic determinants is responsible for the strength of international equity responses to the shocks of other macroeconomic announcements, such as US industrial production figures. We interpret this as suggestive evidence that the transmission of US monetary policy to foreign equity markets is representative and similar to the global transmission of other types of macroeconomic shocks.
1. Introduction
There is a strong notion that financial markets have become increasingly globally integrated over the past decade. One important facet of financial integration is that asset prices exhibit substantial co-movements internationally. The nature of this integration and the transmission channels through which shocks dissipate are, however, still not well understood. What are the factors that cause such a co-movement? Are they global in nature or can they be traced to specific developments in individual countries and sectors? The difficulty researchers face in answering these questions is often a lack of identification; since asset prices – both domestically and internationally – are determined simultaneously, it is hard to trace the origin of financial market developments to a single country or event.
A key element of financial markets is the role of monetary policy as a driver of global asset prices. The paper uses the transmission of US monetary policy shocks in order to understand global linkages among asset prices and financial markets. Specifically, we look at the transmission of US monetary policy shocks to 50 equity markets worldwide, covering not only advanced economies but all of the major emerging market economies, over the period 1994-2004. For identification of monetary policy shocks, we use the reaction of Federal funds future rates to Federal Reserve policy decisions on FOMC meeting days. These are the unexpected components of FOMC decisions, in a 30-minute window around the announcement of the FOMC decisions, and thus can be identified as exogenous shocks to global financial markets.
This approach allows us to address two related issues. First, we identify the overall
strength of the transmission of US monetary policy shocks to equity markets and find that global equity markets fall by around 3.8% in response to a 100 basis point (bp) tightening of US monetary policy. Equally importantly, we show that there is a substantial degree of heterogeneity in the reaction across countries and across industry sectors. Some markets fall by more than 10% due to a 100 bp tightening, thus reacting even more strongly than the US equity market itself, while other countries’ stock markets do not react at all to US monetary policy shocks. Moreover, we detect a substantial degree of sector heterogeneity, ranging from a 7.4% response of the information technology sector to 1.6% for the utilities sector.
As to the second issue, we try to identify the transmission channels of US monetary policy shocks and distinguish between two separate channels. For the first channel, we show that the strength of the financial transmission depends on the response of US asset prices – in particular US short-term interest rates – to US monetary policy. The shock transmission to global equity markets is found to be three times larger when US short-term interest rates exhibit a high sensitivity to US monetary policy shocks. The transmission is also significantly larger when US equity markets react more strongly to US monetary policy shocks, but it appears to be unrelated to the reaction of US long-term interest rates. For the second channel, we find that the financial transmission occurs to a substantial degree through foreign asset prices, in particular exchange rates and the reaction of foreign short-term interest rates. Countries that experience a relatively large sensitivity of both their exchange rate and their short-term interest rate to US monetary policy shocks face a two to three times larger response in their equity returns.
Having identified the channels of transmission, we then proceed to study their determinants by explaining the differential effects across countries and over time through macroeconomic policies and the degree of real and financial integration of countries. Countries with open and well developed equity markets and financial sectors react significantly more to US monetary policy shocks than closed ones, as do countries with more volatile exchange rates. However, we find no evidence that countries with fixed or with floating exchange rate regimes react differently to US monetary policy shocks. This difference in the responses between de jure versus de facto exchange rate regimes may be explained through a fear of floating argument, i.e. the fact that de jure exchange rate regimes are rather imprecise, in particular for emerging markets, in describing the true actions of central banks with regard to exchange rate policy.
Finally, we find that the nature and degree of real and financial integration is a key determinant for the transmission of US monetary policy shocks. Our database to test for financial integration is unique in that it contains holdings of capital stocks vis-à-vis the United States as well as the rest of the world for all elements of the capital account – FDI, portfolio equity investment, portfolio debt investment and loans. Thus this database allows us to conduct a thorough and comprehensive analysis of the role in particular of financial integration. We find that stock markets in countries that hold a large amount of foreign financial assets (relative to domestic GDP) and also that owe a large amount of domestic financial assets to foreigners react two to three times more strongly to monetary policy shocks than less financially integrated countries. We show that this holds quite independently of which type of capital is concerned – countries that are more financially integrated either with regard to FDI, portfolio equity investment, portfolio debt investment or with regard to loans all face an equity market response that is at least twice as strong as that of less financially integrated countries. A key finding of the paper is that it is in particular the degree of global integration, i.e. integration of individual countries vis-à-vis all other countries, rather than the degree of bilateral integration with the United States that determines the magnitude of transmission. This underlines the complexity of the channels of the global financial transmission process. It also has important implications for portfolio diversification and risk-sharing through global capital markets.
The paper is structured as follows. Section 2 provides a brief review of the literature and formulates our main hypotheses. The data is described in section 3. Section 4 discusses the empirical methodology employed and presents the benchmark results for the financial transmission process, distinguishing also between the cross-sectional heterogeneity across countries and across sectors. The findings for the role of the two transmission channels are discussed in section 5. Section 6 contains the analysis of the macroeconomic determinants of the strength of transmission, together with several robustness tests of the empirical results. Section 7 summarises the findings and concludes by drawing some implications for policy and future work.
2. Related literature and hypothesis formulation
The paper focuses on the intersection between and attempts to link two strands of the literature on asset market linkages: first, the literature on domestic financial market effects of monetary policy (section 2.1), and second, the literature on international
asset market linkages (section 2.2). It also builds on the literature that tries to explain individual elements of financial linkages and the transmission process (section 2.3).
2.1 Monetary policy and equity markets
The effect of monetary policy on equity markets has been the subject of a long-standing literature, which has received renewed interest in recent years. The topic has attracted considerable attention, on the one hand, because monetary policy can substantially affect stock market valuation, and as such is considered important from a finance perspective, and on the other hand, because the stock market is a central part of the transmission mechanism of monetary policy, and as such is of relevance to monetary economists. A monetary policy shock affects firm investment through its influence on Tobin’s q, which can most conveniently be studied through the response of stock prices to this shock. At the same time, stock price reactions have repercussions on consumer behaviour through wealth effects.
While considered an important topic of analysis, estimates of the strength of the effect have been complicated by a problem of identification, since monetary policy may be endogenous in that central banks might react to developments in stock markets. Various approaches have been followed to address this issue. For instance, a number of studies have resorted to identified monetary policy shocks in the context of VAR models. Thorbecke (1997), for instance, finds that stock returns are responsive to monetary policy shocks in the United States, and that there are substantial differences in the response across industries and across firms of different size. Patelis (1997) arrives at very similar results, but also shows that the overall explanatory power of monetary policy for stock returns is rather low.
As an alternative approach to identification, several papers have conducted event studies. This allows an analysis at higher frequency compared to the VAR literature which is mostly based on quarterly or monthly data. For instance, Thorbecke (1997) also uses an event study at daily frequency, and shows that US equity markets react significantly to changes in the federal funds rate. Jensen and Johnson (1995) show that there are also longer-term effects of changes in the discount rate, in the sense that stock returns following discount rate decreases are higher and less volatile than returns following rate increases for several weeks. Bomfim (2001) finds evidence for low volatility in US stock markets on days preceding regularly scheduled policy announcements, whereas policy decisions increase stock market volatility. Furthermore, Bernanke and Kuttner (2005) find that the effect of US monetary policy on US equity returns is hardly related to real interest rates, but mainly to the effect of US monetary policy on expected future excess returns and expected future dividends. The renewed recent interest in the topic can be ascribed to new tools in the identification of monetary policy surprises. Rigobon and Sack (2003, 2004) develop a methodology that exploits the heteroskedasticity present in financial markets to identify monetary policy shocks, while Ehrmann and Fratzscher (2004) use market expectations as measured by polls among market participants. Finally, Kuttner (2001) and Gürkaynak, Sack and Swanson (2005) derive monetary policy shocks through measures of market expectations obtained from federal funds futures contracts. Overall, there is now a robust conclusion in the literature that monetary policy affects domestic stock markets – not only by altering volatility, but also through its effects on
the mean of stock returns. The decline of US stock markets to a 100 bp tightening in the federal funds target rate is estimated at 5.3% by Bernanke and Kuttner (2005), at 5.5% by Ehrmann and Fratzscher (2004) and at 6.2% by Rigobon and Sack (2004). The primary focus of the literature on stock market effects of monetary policy has been a domestic one. To our knowledge, there are only few exceptions studying the effect of monetary policy in an international context. Conover, Jensen and Johnson (1999) look at 16 industrialized countries and find that equity markets in several of these react to what they label the US “monetary environment”. Their analysis is based on monthly data, and they define a monetary environment to be expansive or restrictive dependent on the direction of the most recent change in discount rates. Stock returns are generally higher in expansive than in restrictive US environments. Ehrmann, Fratzscher and Rigobon (2005) estimate effects of monetary policy on stock markets for the euro area and the United States. They find that euro area stock markets drop by nearly 2% in response to a 100 bp tightening in the United States on the same day. By contrast, euro area monetary policy affects US stock markets to a much smaller extent, at 0.5%.
2.2 International financial market linkages
This paper also relates to the strand of literature that has analysed cross-country asset market linkages. Equity markets, the focus of this paper, have been studied in a large number of contributions. Again, the main difficulty in estimating market linkages is one of identification. Whereas there is clear evidence for positive correlation in stock markets, identifying the causal links is much more difficult. King and Wadhwani (1990) argue that correlation between markets occurs as rational agents try to infer information from price changes in other markets. In an attempt to explain the time variation in stock market correlations, King, Sentana and Wadhwani (1994) analyse volatility spillovers between sixteen national stock markets, and find that changes in correlations between markets are driven mainly by changes in unobservable variables. One possibility to identify directional causality in stock market linkages is to exploit differences in trading times. Using this device, Hamao, Masulis and Ng (1990) find evidence of volatility spillovers from the US to Japan and the UK, as well as from the UK to Japan, but not in the other directions. Extending the focus from pure volatility spillovers to mean returns, Lin, Engle and Ito (1994) show that the returns of US and Japanese markets are interrelated, with effects going in both directions.
Finally, an alternative identification scheme is to study the effects of particular news. Becker, Finnerty and Friedman (1995) show that spillovers between the US and UK stock markets are in part due to US news and information. In a similar vein, Andersen et al. (2005) show that US, German and British stock markets react to US macroeconomic news. Wongswan (2003) finds that macroeconomic announcements in the US and Japan affect equity markets in Korea and Thailand. However, Connolly and Wang (2003) argue that such macroeconomic news can explain only a small share of the equity market spillovers between mature economies.
Overall, the literature has provided clear and robust evidence for international equity market linkages. In the search for causality, US markets in particular have been singled out as a main driver of global developments.
2.3 Explaining linkages
While there is clear evidence for cross-market linkages, these are not identical across countries and vary over time (Bekaert and Harvey 1995). Accordingly, there have been attempts to explain the intensity of spillovers across countries and over time. Differences in industry structure are one potential explanation, whereby countries with more similar industrial composition should see closer co-movements (e.g., Roll 1992). However, the importance of this factor has been debated; for instance, Heston and Rouwenhorst (1994) and Griffin and Karolyi (1998) argue that industrial structure explains very little of the differences in market volatility across countries. By contrast, Campbell et al. (2001) and Griffin and Stulz (2001) find that industry-specific factors are important in understanding international equity market comovements.
The role of trade as a catalyst for market linkages has been highlighted first in applications to currency crises,1 e.g. in Eichengreen and Rose (1999) or Glick and Rose (1999). The hypothesis of that strand of the literature is that larger trade integration increases also financial market linkages; for instance, a devaluation in one country increases temporarily its competitiveness, thus affecting adversely also its trade competitors. Using a common factor model, Forbes and Chinn (2004) test the trade channel also for non-crisis periods, and furthermore expand the potential determinants for international spillovers. They find both trade and financial linkages to be important since the mid 1990s. Furthermore, the paper shows that there are regional spillovers from the largest economy in a given region to nearby countries, yet that US developments are transmitted to all regions.
Finally, some hypotheses are also tested in papers analysing the spillover from US monetary policy shocks to other economies in general or financial markets other than equity markets. Miniane and Rogers (2003) assess whether capital controls manage to insulate countries from US monetary shocks, by estimating their effect on the exchange rate and foreign interest rates. The hypothesis whether countries with less open capital accounts exhibit systematically smaller responses is rejected by the authors, however. Kim (2001), using a VAR framework with low-frequency data, identifies interest rate reactions in other countries as the most important channel of transmission. This conclusion is shared by Canova (2005), who employs a similar methodology and furthermore finds that the strength of countries’ response to US monetary policy depends on exchange rate regimes, even though differences with the de jure classification appear relatively small.
2.4 Hypotheses and contribution
The intended contribution of the present paper is to link these different strands of the literature in order to understand how financial markets are linked internationally. As we will explain in detail in the next section, we are able to use a clean identification of US monetary policy shocks to test for the international transmission of this shock. However, we are focusing on “normal” times, rather than crises, as common in the literature on linkages. The existing literature helps us in formulating our hypothesis and designing our testing framework.
1
These studies attempt to measure contagion rather than interdependence; see Forbes and Rigobon (2002) for a critical assessment of the empirical methodologies generally used in this literature.
As to the transmission channels, several studies have highlighted the importance of the response of other asset prices than equity markets to US monetary policy shocks, with particular importance given to interest rate transmission. Accordingly, we will test whether differences in the effect of US monetary policy shocks – i.e. the dispersion of these effects across countries and over time – is explained by the reaction of US asset prices, as well as whether they are related to the reaction of foreign asset prices such as interest rates and the exchange rate. We also control for differences in sector composition of different stock markets. As to the economic determinants of the transmission process, the main factors singled out in the literature are trade and financial linkages. In line with this, we will analyse and compare the role of a large number of macroeconomic and financial variables.
There are both macroeconomic and microeconomic reasons why we would expect to see equity markets in economies other than the United States respond to US monetary policy. First, there are likely to be macroeconomic repercussions of a US monetary policy shock to foreign economies as the effects within the US might spill over to other countries, particularly if these have a high business cycle correlation, close trade links or high financial integration. Accordingly, stock markets in those economies are likely to be affected, too. Furthermore, there can be microeconomic effects on the individual firms traded in the various national stock markets that go beyond the general macroeconomic linkages, and effects on individual investors. These are mainly threefold. First, stock prices should be affected through a change in firms’ financing costs. This relates most directly to companies that source some of their funds in the US. At the same time, financing costs could be changing globally or in the respective country, depending on interest rate reactions at the global or country level. Second, stock price evaluations of companies that have some business links with the US will be affected through the influence of US monetary policy on real economic activity in the US. Third, for financial investors, a change in US interest rates is likely to trigger a portfolio rebalancing by local, US or global investors. All three factors are most likely magnified in more open economies – be it through trade linkages, or through financial linkages, an issue that we will analyse in detail below.
3. Data
We proceed by first outlining the data for the financial market returns, for the monetary policy shocks as well as for the macroeconomic variables of the transmission channels. In the subsequent section, we will then turn to the empirical methodology and modelling of the financial transmission process.
3.1 Financial market data
The main focus of the paper is on the transmission of US monetary policy shocks to foreign equity markets. A first important choice is therefore what type of equity indices to chose. We decided to take Datastream price indices in national currencies for several reasons. First, they offer a maximum amount of comparability across countries. Second, they are based on a broad sample of stocks, including many small firms in the indices. Third, the indices are available for 50 countries, covering all major advanced economies and major emerging market economies. Fourth, each
national index is furthermore available disaggregated into sector indices. Finally, the choice of currency implies that we are able to calculate national equity returns pure of exchange rate effects. Annex 1 lists the country and sector coverage of the Datastream indices, showing that series are mostly available for the full time sample covered. An important issue is the sector composition of the different equity markets. As discussed above, a potentially relevant determinant for differences in the transmission of shocks to equity markets may be the different sector composition of the overall market indices. For instance, the equity market of a particular country may react more to foreign shocks due to the concentration of firms of a particular sector in that index, rather than due to the other factors of interest here. We use two ways to control for such sector effects in the empirical analysis below. First, we model the transmission on each sector index in each country allowing for sector-specific fixed effects and transmission effects. Second, for the analysis of the determinants of a country’s response to US monetary policy shocks, we construct aggregate indices which are calculated as the unweighted average of the sector returns in each country.
Finally, the analysis and empirical modelling is based on daily financial market data, using closing quotes of the respective equity markets. We choose this frequency due to the fact that several equity markets, i.e. those in Asia but also in Europe, are closed when US monetary policy decisions are announced. Hence, tomorrow’s equity returns for these countries are included to test the effect of a US monetary policy shock today.
3.2 Monetary policy shocks
The second issue is how to measure US monetary policy shocks. To obtain an as clean and exogenous as possible proxy for such shocks, we use the change of the Fed funds future rates in the 30-minute window surrounding FOMC decisions. The data stems from Gürkaynak, Sack, and Swanson (2005).2
FOMC meetings usually take place 8 times per year, about every six weeks. Starting in February 1994, the Federal Reserve announces its decisions on the day of the FOMC meetings, whereas before, markets needed to infer decisions from the open market operations. Accordingly, we start our sample period in February 1994, as from this date monetary policy surprises on the day of the FOMC meetings can be accurately measured. Most FOMC announcements since February 1994 have taken place at 14.15 EST, such that markets in Asia and in Europe were closed and affected only on the subsequent business day. Over the whole period February 1994 – December 2004, we have a total of 93 FOMC meetings. These include also unscheduled FOMC meetings, except for the one on 17 September 2001 following the 11 September attacks.3 Figure 1 plots the US monetary policy surprises over the included 93 FOMC meetings.
2
See Gürkaynak (2005) for a detailed explanation of the methodology for calculating policy expectations based on Fed funds futures of different maturities.
3
Excluding the other four unscheduled meetings from the sample reduces the overall effect of US monetary policy shocks somewhat. However, such an exclusion does not change the results shown below, in particular the cross sectional heterogeneity and the analysis of the channels of determinants in any significant way.
As we model the daily returns of stock markets on all days in our sample, i.e. also for non-FOMC meeting days, our measure of monetary policy shocks is set to zero for these days.
3.3 Integration and macroeconomic determinants
As discussed in the introduction, an important part of the analysis is to understand the channels through which US monetary policy shocks are transmitted to foreign equity markets. As for the transmission through US and foreign asset prices, we use the Datastream equity index also for the United States, and use three-month T-bill rates for short-term interest rates and ten-year yields for long-term rates. For foreign asset prices, we use mostly three-month money market rates and spot exchange rates, taking again daily closing quotes for both.
Moreover, in order to study the role of macroeconomic determinants, we use various measures. One key element we analyse is the degree of financial openness of countries. We use the openness of the capital account, which is a dummy that takes the value zero if a country’s capital account is closed and one if it is open. The source of this data is the IMF’s Annual Report on Exchange Arrangement and Exchange Restrictions (AREAER). For the openness of the domestic equity markets as well as for the openness of the domestic financial sector we take the indicators developed by Kaminsky and Schmukler (2003) and complemented by Bussiere and Fratzscher (2004). All of these openness variables are dummies, being zero if a country’s market is closed and one if it is open.
As to exchange rates, we use both de facto measures of exchange rate flexibility from Reinhart and Rogoff (2004) as well as a de jure classification from the IMF’s AREAER. We also use the actual exchange rate volatility, which is measured as the standard deviation of a country’s daily exchange rate changes against the US dollar over the previous 12-months. Other volatility proxies based on shorter or somewhat longer periods show very similar results to the ones presented below.
Finally, for the degree of real and financial integration, we look at both the current account and the financial account of countries. Trade data are flows of exports and imports and stem from the IMF’s Direction of Trade Statistics. Financial account data are all stocks of assets and/or liabilities for FDI (source: UNCTAD), portfolio investment equity and debt (source: IMF CPIS), and other investment, which are mostly loans (source: BIS ILB). A key strength of this dataset is that it contains a geographic decomposition of trade and financial linkages, so that both real and financial integration can be measured vis-à-vis the rest of the world and, alternatively, vis-à-vis the United States alone.
Most of the integration and macroeconomic variables vary over time and across countries, though there are some exceptions and some variables are not available for the full sample of countries. Annex 2 provides a more detailed summary of the sources and characteristics of all the variables. Table 1 provides some summary statistics of the variables, including the US monetary policy shock.
4. Benchmark model of financial transmission
Our empirical modelling strategy consists of three parts. In the first part, which is presented in this section, we measure the overall transmission of US monetary policy shocks to US and foreign equity markets. We also decompose this transmission process by taking into account the cross-country heterogeneity and the cross-sector heterogeneity as well as possible time variations of the transmission process. In the second part, which is provided in section 5, we then try to explain this heterogeneity by distinguishing between two distinct transmission channels, before we turn to an analysis of the macroeconomic determinants in Section 6.
4.1 Benchmark results
Our first objective is to measure the overall transmission of US monetary policy shocks to foreign equity markets. As the most simple benchmark specification, we model daily equity returns in country i, rit, as follows:
it n t i n r t t i it S Z r =α +β +γ ε US +
∑
δ +ε , (1)Daily equity returns are thus a function of monetary policy shocks in the United States, St, as well as a vector Zt of controls such as past returns, day-of-the-week effects etc. β is our main parameter of interest, which measures the strength of the transmission of the shock to foreign equity markets. As discussed above, one would expect that the coefficient has a negative sign, as a positive monetary policy shock, i.e. higher interest rates than expected, induces negative equity returns. Moreover, the benchmark model includes a variable εrus which allows us to obtain a proxy for the ‘general linkage’ between the US equity market and the foreign equity market in country i. εrus is extracted from the analogous benchmark model for the United States:
US r t n n USt t US t US S Z r , =α +β +
∑
δ , +ε (2)Thus εrus is in essence the US equity market return that is cleaned of the effect of US monetary policy shocks,4 such that we can ensure in model (1) that β is orthogonal to
γ. We speak of γ as measuring merely the “linkage” of the two equity markets because the parameter does not allow us to make any statement about the causality of equity market movements, i.e. it may be that a high and statistically significant γ parameter indicates a transmission from the US stock market to the foreign equity market, but it may equally well imply a transmission in the opposite direction. Hence there is a lack of identification in determining what drives εrus. The key objective for using the transmission of US monetary policy shocks is precisely to enable us to identify the source of the shock and thus the direction of causality in the transmission process. Nevertheless, measuring this general linkage is useful for several reasons. First, γ allows us to get an idea of the overall co-movements of foreign equity markets with the US market, though again this is only a secondary objective as we are primarily
4 In particular, recall that US monetary policy shocks, S
t, occur only on FOMC meeting days, i.e. only about every six weeks, so that St=0 for most days in the sample.
interested in identifying the causality of the transmission, i.e. in the parameter β. Second, γ serves as a robustness check: if the transmission of the US monetary policy shock β is typical for the transmission of other types of shocks from the US to foreign financial markets and if US markets are dominant in explaining the general linkage γ, then it should hold thatβ ≈βUS ⋅γ . We will turn to this issue in detail in section 5 when discussing the different channels of transmission.
As to the specific estimator, we use for all models in this paper, except when indicated otherwise, an OLS estimator with panel-corrected standard errors (PCSE), which corrects for heteroskedasticity and for the correlation of residuals across stock market indices.5 This correction is important as neglecting such heteroskedasticity and cross-correlation leads to a substantial underestimation of the variance-covariance matrix and thus to an overestimation of the significance of the parameters.
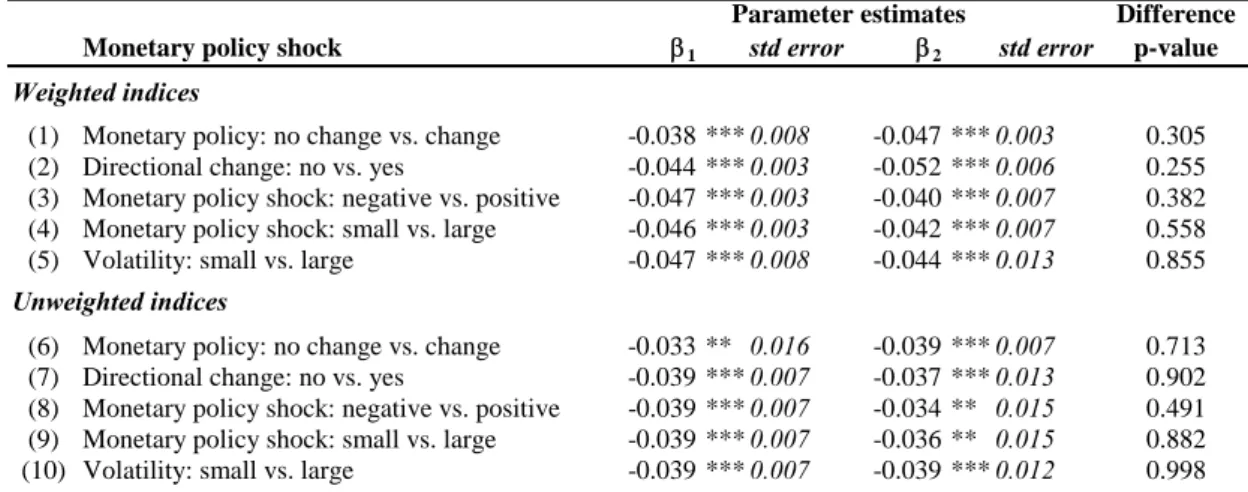
Table 2, row (1), shows the results for the US benchmark model (2) using the weighted equity returns rUS,t, whereas row (2) gives the analogous results when using
the unweighted equity returns, rUSu,t, as explained above in section 3. We find that US stock markets respond significantly to a US monetary policy shocks. The magnitude of this effect is slightly larger than what was found in the papers discussed in Section 2.1, at 7.9% for the weighted index, and at 6.5% for the unweighted index. Rows (3) and (4) show the corresponding results for the international transmission, based on equation (1), i.e. with the inclusion of country-fixed effects αi. The results show that a
100 bp tightening in US monetary policy leads to a drop of the foreign weighted returns by 4.5% and of the unweighted returns by 3.8%. As such, the magnitude of the international stock markets response is more than half of the domestic one within the US. The general linkage for the weighted returns is 0.304, e.g. a 1% increase in US equity returns is on average associated with a 0.30% change in foreign equity returns. A first robustness test is to check whether the strength of the transmission relates to specific characteristics of the interest rate decision, such as whether or not the FOMC changed interest rates, whether there was a directional change in US monetary policy at a particular meeting, whether the surprise was small or large etc. We conduct this test by estimating it n t i n r t t t t t i it S D S D Z r =α +β +β − +γ ε US +
∑
δ +ε , 2 1 (1 ) (3)with Dt =1 e.g. if there was no change in monetary policy at a particular FOMC meeting and Dt=0 otherwise, and analogously for other asymmetries. Table 3 shows the estimates for various specifications of such heterogeneity. Overall, the results
5
This estimator corrects for heteroskedasticity and assumes that residuals are contemporaneously correlated across panels. It estimates the covariance of the OLS coefficients as
1 1 ) ' ( ' ) ' ( ˆ= X X − X ΩX X X −
V where Ω is the covariance matrix of the residuals Ω=Σmxm⊗ITixTi. I is an identity matrix and Σ the m by m panel-by-panel covariance matrix of the residuals, formulated as
ij j i ij=(ε 'ε )/T
Σ) where εi and εj are the residuals for panels i and j from equation (1) and Tij is the number of residuals between the panels that can be matched by time period.
indicate that although there are some differences in the strength of the transmission, none of these differences is statistically significant, neither with weighted nor with unweighted return indices, as indicated by the p-values in the last column of the tables. We take this as evidence that in our further analysis below, we do not need to take such differences into account.
4.2 Cross-country and cross-sector heterogeneity
Table 2 shows the average transmission across all countries and all sectors. To understand the degree of heterogeneity of the transmission process, we therefore now proceed to analyse the differences in the transmission across countries as well as across sectors. For this purpose, we allow for country-specific as well as sector-specific intercepts and interactions with the US monetary policy shock and the general linkage. We therefore estimate the benchmark model by including return indices for each country and each sector, rikt (excluding the national market aggregates used in
the preceding section):
(
)
(
)
[
]
(
)
(
)
[
]
ikt k k r t k k t k i i r t i i t i n n it k i ikt D D S D D S Z r US US ε ε γ β ε γ β δ α α + + + + + + + =∑
∑
∑
, (4)Table 4 indicates that the cross-country variation in the financial transmission from the United States is substantial. Some of the more closed emerging markets – such as China, India, Peru, Sri Lanka and Malaysia – do not react significantly or only very weakly to US monetary policy shocks. By contrast, other emerging markets – for instance Hong Kong, Indonesia, Korea and Turkey – react very strongly to US shocks, with some equity returns falling by 10% or more to a 100 bp tightening in US monetary policy.
There are also substantial differences in the transmission of US shocks to advanced economies.6 Some markets, such as those in Canada and Australia, react relatively strongly, while others, such as Japan’s, are far less responsive. Interestingly, the largest effects of US monetary policy shocks among advanced economies are recorded for Finland and Sweden. These are two economies where the high-tech sector is particularly important. Although model (4) controls for differences in the sector composition of countries’ equity indices, this finding may suggest that there are important sector spillovers within countries, i.e. all sectors react more strongly to US shocks in countries where the high tech sector is particularly important.
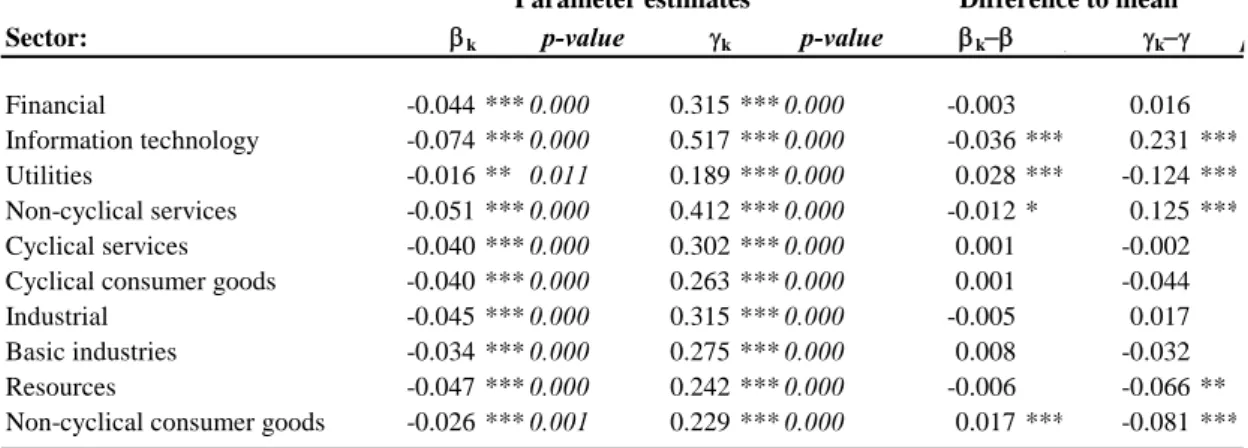
Table 5 gives the sector effects βk and γk. and indeed underlines the importance of
such sector effects. The table confirms that the information/high-tech sector responds
6
Luxembourg is excluded from subsequent model estimations in part due to its special characteristic as financial centre, and in part due to a lack of some macroeconomic and integration data used below.
by far the strongest, with equity returns in this sector declining on average by 7.4% in response to a 100 bp tightening in US monetary policy. Also the financial sector, non-cyclical services and the industrial sector respond relatively more strongly. By contrast, utilities and non-cyclical consumer goods react the least to US monetary policy shocks.
Finally, an inspection of the general linkage parameters, γi for the country-specific
effects and γk for the sector-specific effects, is useful as a robustness check. In
general, larger monetary policy transmission is also associated with higher general linkages and vice versa. In fact, the ranking of the strength of the monetary policy transmission is almost identical to the ranking of the general linkage for the sector effects, and very similar for the country-specific effects.
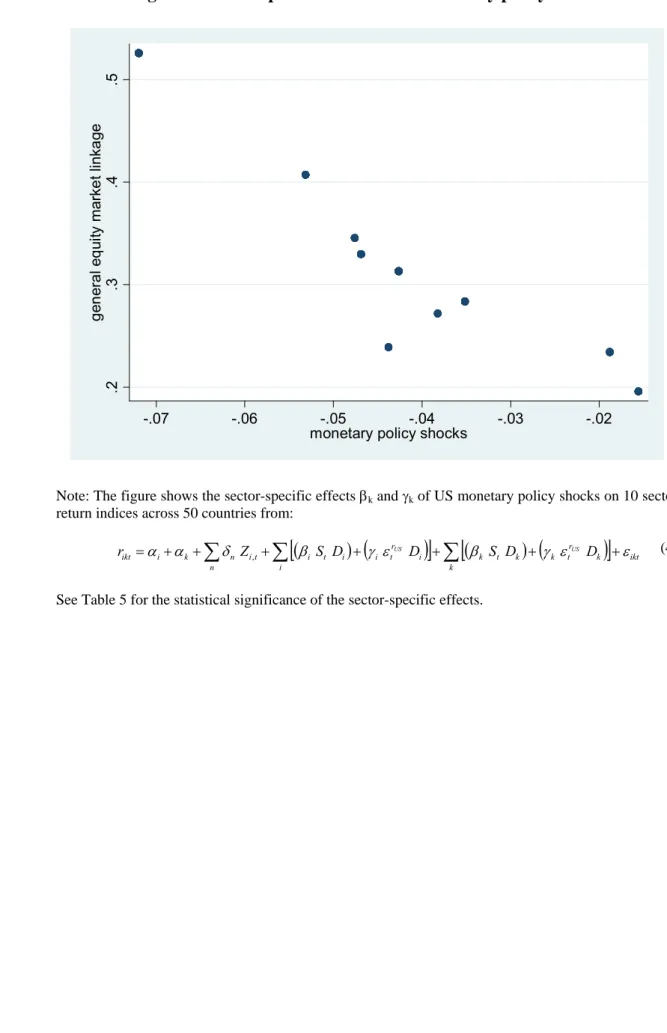
Taking together the sector and country-specific effects, Figure 2 shows the distribution of the effects of monetary policy shocks (horizontal axis) and the general linkage (vertical axis) across countries and sectors, i.e. all available βik and γik. It
emphasises the high degree of dispersion in the shock transmission and the general equity market linkage. The similarity in the ranking of the strength of the monetary policy transmission and of the general linkage is apparent from the clear negative relationship between βik and γik in Figure 2. Figures 3 and 4 then distinguish between
the country-specific and the sector-specific heterogeneity of the parameters.
In summary, there is a substantial transmission of US monetary policy shocks to global equity markets. This transmission moreover exhibits a large degree of heterogeneity, both across countries and across sectors. This heterogeneity ranges from countries and sectors that are basically unaffected by US monetary policy shocks to those that react by 10% or more to a 100 bp change in US monetary policy.
5. Transmission channels
What explains the size and this large degree of heterogeneity in the transmission of US monetary policy shocks to foreign equity markets? We distinguish between two distinct channels of transmission. First, the strength of the transmission of US monetary policy shocks to foreign equity markets over time may depend on the reaction of US asset prices themselves. Second, the transmission may occur through and thus its strength may be related to the response of foreign asset prices, in particular exchange rates and foreign interest rates.
5.1 Channel 1 – US asset price reactions
The strength of the financial transmission of the US monetary policy to foreign financial markets could depend on how US asset prices themselves react to a US monetary policy shock. There are in principal several different reasons why a US monetary policy shock may affect the equity valuation of foreign firms. There may be a direct transmission in that e.g. a rise in US interest rates raises borrowing costs for firms financing themselves directly in US markets, thus lowering their equity value.
Thus the strength of the transmission of the shock may depend on the extent to which short-term and long-term interest rates in the United States respond to monetary policy. The larger the response of US short-term rates, the higher is the expected effect on foreign equity markets, partly due to higher expected future returns and dividends, and possibly due to higher real interest rates.7
The hypothesis is less clear cut for long-term interest rates. First of all, the reaction of long-term rates to monetary policy itself is not clear a priori. For instance, a tightening of monetary policy, leading to an increase in short-term rates, can potentially be compatible with a reduction in long-term interest rates if markets perceive the tightening as a credible step by monetary authorities to reduce inflation in the long run (Thornton, 1998). Furthermore, even conditional on a given reaction of long-term rates, the response of equity markets is also ambiguous. On the one hand, a rise in long-term rates may induce higher real interest rates, thereby tightening financing constraints and lowering the discounted value of future earnings and thus inducing negative equity returns. On the other hand, higher long-term rates may signal expectations of higher economic growth, and thus raise the equity valuation of firms. Finally, the transmission of US monetary policy shocks to foreign equity markets may occur through US equity markets. Thus a tightening in US monetary policy that has a particularly strong effect on US equity returns may also have a larger effect on foreign markets e.g. if foreign firms’ earnings are closely linked to US returns.
For the empirical model, we hence want to analyse whether the strength of the monetary policy shock transmission is a function of US asset price responses. We conduct two tests. First, we estimate the model of equation (3) but with Dt =1 if there is a relatively large US equity market, money market or bond market reaction in response to the US monetary policy shock – i.e. higher than the median value over all FOMC meetings in the sample period – and Dt=0 otherwise.8 In other words, we are testing whether the transmission of the US monetary policy shock to foreign equity markets is related to the magnitude of the response of US asset prices. As a second test, we allow and test for the fact that the different channels through US financial markets may reinforce one another, so that we estimate
(
)
u it n t i n r t l l t l l t t l i u it S D D Z r =α +∑
β +η +γ ε US +∑
δ +ε = , 4 1 (5)where Dl are 0-1 dummies for D1=1 if the reaction of the US equity market is large – i.e. larger than its median over the sample period – and its short-term interest rate response on that day is relatively small – again relative to its median reaction over the whole sample period; D2=1 if the reaction of US interest rates is high and the US equity market response on that day is relatively low; D3=1 if the reaction of US
7
As discussed in section 3, we use three-month money market rates as our instrument for short-term interest rates. A relatively small response of these three-month rates to a monetary policy shock may indicate that market participants are surprised by the precise timing of the change, though not by the change itself, which e.g. may have been expected for the subsequent meeting and thus was already priced into the three-month rates.
8
This categorisation using the median response for FOMC meeting days ensures that each category has roughly the same number of observations. Moreover, we tested and found that the results here and also for other related tests below are robust to the exclusion of outliers.
interest rates is large and the US equity market response on that day is relatively large; D4=1 if the reaction of US interest rates is low and the US equity market response on that day is small; and zero otherwise.
Table 6 shows the results for these tests. Panel A for the individual US financial markets shows that there is a strong asymmetry only with regard to the reaction of US short-term interest rates: the transmission to foreign equity markets is more than twice as high when there is a relatively large change in US short rates – a drop of 7.9% in foreign equity markets due to a 100 bp tightening – as compared when this change is small – a 3.2% decline. There is a higher transmission also when US equity markets react relatively strongly; however, this asymmetry is not statistically significant. Panel B of Table 6 provides the parameter estimates for model (5). The results of Panel A are confirmed in that it is the size of the US interest rate response that is the most important channel for the strength of transmission of US monetary policy shocks. Again, the transmission parameters are more than twice as large when US short-term interest rates react relatively strongly as compared to when they change little in response to US monetary policy shocks.
In summary, the response of US asset prices to US monetary policy shocks plays an important role in determining the strength of the transmission of such shocks to foreign equity returns. It is in particular the magnitude of the reaction of US short-term interest rates that appear to matter for the transmission process.
5.2 Channel 2 – Foreign asset prices
As a second channel, the response of foreign asset prices is a potentially important factor that determines the strength of the transmission of US monetary policy to foreign equity markets. We focus on the reaction of a country’s exchange rate against the US dollar and foreign interest rates.9 In particular, this analysis allows us to distinguish between four types of countries:
• fixer: exchange rate reacts little, interest rate reacts much
• floater: exchange rate reacts much, interest rate reacts little
• dependent country: exchange rate reacts much, interest rate reacts much
• independent country: exchange rate reacts little, interest rate reacts little
The question we want to analyse is whether there is a difference in the financial transmission process according to the type of country. There is no clear-cut hypothesis about which types of countries should be affected the strongest and which ones the least though equity markets in “dependent” countries appear likely to react more to US monetary policy shocks than “independent” countries.
9
A test of the role of foreign bond yields is not conducted due to a lack of comparable data for the 50 countries in the sample.
But the strength of the likely reaction is less apparent when comparing fixers and floaters. If the transmission to foreign equity markets takes place mainly through an adjustment in foreign interest rates, then countries with fixed exchange rate regimes should be affected more strongly. By contrast, if the transmission process is dominated by the exchange rate, then equity markets of those countries with more flexible exchange rates may be more sensitive to US monetary policy shocks. However, it is a priori not clear in which direction the exchange rate channel works. A tightening in US monetary policy should induce an appreciation of the US dollar, which in turn may hurt importers in other countries but benefit exporting firms as they gain competitiveness. Hence, ultimately it is an empirical question of how the financial transmission process is linked to the exchange rate reaction.
We classify each country at each point in time into one of these four categories. This classification is based on the actual, de facto behaviour of a country’s exchange rate and short-term interest rates. For instance, a country whose exchange rate reacts more than the median reaction of all countries and whose interest rates changes relatively less than the median as measured on all FOMC meeting days is classified as a “fixer”, and analogously for the other three types. The distinction between “dependent” and “independent” countries is made because countries that e.g. adopt a flexible exchange rate regime may not necessarily acquire a higher degree of monetary policy autonomy, i.e. domestic interest rates may nevertheless still closely follow those in the United States, as such autonomy depends on a number of factors such as the degree of credibility of domestic monetary authorities.10
The empirical model is formulated as follows:
(
)
u it n t i n r t m m t i m m t i t m i u it S D D Z r =α +∑
β +η +γ ε US +∑
δ +ε = , 4 1 , , (6)where Dm are 0-1 dummies for D1=1 if the country is a “fixer”, i.e. the reaction of the foreign interest rate of country i is relatively large – that is, larger than the median daily interest rate change over all countries and all FOMC meeting days – and its exchange rate response on that day is relatively small – again relative to the median daily exchange rate change of all countries over all FOMC meeting days; D2=1 accordingly if a country is a “floater”; D3=1 if it is a “dependent country”; and D4=1 if it is an “independent country”.
Note that channel 1 explains nothing of the cross-sectional heterogeneity as US asset price responses are the same for all foreign countries. By contrast, the present channel via foreign asset prices contains both a time-series dimension as well as a cross-sectional dimension as a country may not always belong to one of these four groups, but may change its affiliation over time, e.g. if it moves from a fixed exchange rate regime to a floating one.
10
See e.g. Frankel, Schmukler and Serven (2004) for an empirical analysis of the response of exchange rates and interest rates, and their determinants, across a broad set of mostly emerging market economies.
Panel A of Table 7 provides the results analogous to model (3), whereas Panel B shows the reaction to US monetary policy shocks across the four types of countries for model (6). Panel A indicates that the transmission process is indeed related to both exchange rates and interest rates: for both, there is indeed a stronger transmission if they react relatively strongly to a US monetary policy shock, although statistical significance is found only at the 10% level.
For the analysis of the monetary policy/exchange rate regimes of countries, Panel B reveals that the drop of “dependent” countries’ stock markets by 5.2% in response to a 100 bp tightening in US monetary policy is substantially larger than that of the other three types of countries, and statistically significantly so. “Independent” countries react the least to US monetary policy shocks – showing a 2.3% drop to a 100 bp tightening. Finally, floaters appear to respond somewhat more than fixers to such a US monetary policy shock, though this difference is not statistically significant, as indicated by the p-values of the t-test in the last three columns of the table.
A note of caution is in order here. The fact that the transmission process of US monetary policy shocks to foreign stock markets is related to the reaction of foreign interest rates and exchange rates does not necessarily imply that the transmission to foreign equity markets goes through interest rates and exchange rates. Indeed, for instance for domestic US markets it has been shown that although the transmission of US short-term interest rate changes is highly important for US equity returns, there is at times also a transmission in the opposite direction from equity markets to money markets (Rigobon and Sack 2003).
Overall, the financial transmission of US monetary policy shocks to foreign equity markets indeed appears significantly related to the response of other foreign asset prices. Stock markets in countries where exchange rates and interest rates react the most to US monetary policy respond about two to three times stronger to such shocks than countries where these two asset prices react relatively little.
6. Determinants of financial transmission
Section 5 has analysed through which channels the transmission of US monetary policy shocks to foreign equity markets may occur. The issue we turn to now, given these channels, is what the determinants are that explain why some countries’ equity markets overall respond more strongly to such shocks. We focus in this section on the role of macroeconomic policies – in particular the degree of openness and exchange rate policies – and the extent of real and financial integration of countries, and provide some extensions and robustness checks of the empirical results.
6.1 The role of macroeconomic policies
As to macroeconomic policies, one would expect that countries that are financially open are much more affected by US monetary policy and other shocks. More openness implies that capital can move more freely. A US monetary policy shock may induce a rebalancing of asset portfolios not only in the United States, but more generally in global markets overall, and in particular in those that are more open financially. We analyse various dimensions of financial openness: the openness of the
capital account, the domestic equity market and the domestic financial sector, as well as the overall market capitalisation of the domestic stock market relative to GDP as a proxy for the depth and liquidity of the market. Moreover, exchange rate policies may matter. Related to the analysis in section 5.2, we analyse the role of the exchange rate regime but focus here additionally on the de jure regime.
As explained in Section 2.4, we expect that countries that are highly integrated with the United States, both in terms of finance and in terms of the real economy, should be more responsive to US monetary policy shocks for several reasons. On the one hand, there should be a closer linkage at the macroeconomic level; on the other hand, individual stocks are more likely to be affected beyond the macroeconomic linkages, through effects on their financing costs and their growth outlook. Finally, for investors, a rebalancing of portfolios should affect these countries more strongly. We use several proxies for real and financial integration. First, we look at the role of trade, both as the sum of bilateral inflows and outflows between a particular country i and the United States or the whole world as well as separated into inflows and outflows to or from country i. Second, we test whether stocks of FDI, portfolio equity, portfolio debt or other investment/loans play a role for the transmission process. Finally, we also test for the role of business cycle correlation, using the correlation of annual GDP growth rates in 1980-2003 between country i and the United States. In the empirical model, we use a discrete definition of determinant Xit:
(
)
(
)
(
)
u it n t i n high it mid it low it high it r t t mid it r t t low it r t t i u it Z X X X X S X S X S r US US US ε δ η η η ε γ β ε γ β ε γ β α + + + + + + + + + + + =∑
, 3 2 1 3 3 2 2 1 1 (7)with Xlow=1 if the determinant X of country i at time t lies in the lowest third of the distribution across all countries over the sample period, and zero otherwise, and analogously for Xmid and Xhigh. This specification has the advantage that it nests a linear model, and that the magnitude of the parameters can be easily interpreted and compared. Note that most determinants are varying both across time and across countries, though some of the determinants only vary across countries, such as financial integration based on portfolio investment.
Table 8 shows the estimates for openness, exchange rate regimes and business cycle correlation. There is indeed a strong relationship between the openness of countries and the strength of the transmission of US monetary policy shocks. In particular, US monetary policy affects equity markets only in countries that have an open equity market and an open domestic financial sector; whereas closed markets exhibit no statistically significant response (panel A, Table 8).
As to exchange rates, it appears that it is not the de jure exchange rate regime that matters but the de facto regime.11 Panel B shows that stock markets in countries with
11
This finding is consistent with Shambaugh (2004), which focuses specifically on comparing the responsiveness of monetary policy to foreign shocks under different de facto exchange rate regimes.
more volatile exchange rates, both in effective terms or against the US dollar, react about twice as strongly as those with the least volatile ones – 5.5/5.6% as compared to 2.7% in response to a 100 bp change.12 By contrast, there is no significant difference in the transmission among countries that de jure have declared to have a fixed or a floating exchange rate regime.
These two results on openness and on exchange rates may go some way in understanding the cross-country differences in the transmission of US monetary policy shocks discussed in section 4.2. For instance, the findings may explain to a significant extent why relatively closed emerging markets – such as China, India, Peru, Sri Lanka and Malaysia – do not react significantly or only very weakly to US monetary policy shocks, and why markets such as that of Hong Kong, which has a very open financial sector, show a relatively large response.
Next we turn to business cycle correlation and other macroeconomic variables as shown in panel C of Table 8. There appears indeed a significant relationship between the degree of business cycle correlation with the United States and the extent to which a country’s stock market is affected by US monetary policy shocks; equity markets in countries with a low level of GDP correlation with the US react by 2.6%, which is significantly less than the 4.8% in countries with a high correlation. Little systematic role is however found for the degree of indebtedness of a country. There is also no systematic relationship between the transmission of the shocks and geographic distance – often used as a proxy for information asymmetries and transaction costs in the gravity literature. A broad set of other macroeconomic variables, such as the correlation of domestic inflation rates with those in the US, were tested and were not found to be significantly related to the transmission process. They are not shown in the tables for reasons of brevity.
6.2 The role of trade and financial integration
As the last step, we turn to the role of real and financial integration as a determinant for the transmission process of US monetary policy shocks. Table 9 shows the estimates when using integration proxies that measure the sum of inflows and outflows or the sum of assets and liabilities of residents in country i, vis-à-vis the whole world in panel A, and vis-à-vis the United States in panel B. Table 10 conducts the same analysis separately for inflows and outflows or assets and liabilities vis-à-vis the United States.
The key finding of Table 9 is that the financial transmission process to equity markets is strongly related to the degree of integration of countries vis-à-vis the whole world (panel A), but basically unrelated to the integration with the United States alone (panel B). In panel A for the integration with the world, countries that have a high degree of trade and that have a large size of financial assets and liabilities with the rest of the world react two to three times more strongly to US monetary policy shocks
12
The results using real exchange rates are very similar to those with nominal exchange rates shown in the table.
than countries with a low degree of such integration. This holds almost equally for all four types of capital (FDI, portfolio equity, portfolio debt and other investment). Note that it is hard to disentangle which type of capital plays relatively more important role for the transmission process as there is a high degree of correlation across these different proxies of financial integration.
By contrast, the relationship between the degree of integration of countries with the United States and the strength of the transmission of US monetary policy shocks to these countries is much weaker (panel B, Table 9). The case of other investment loans is the only one where a high degree of financial integration coincides with a stronger reaction to monetary policy shocks than a low degree.
To understand better the weak evidence regarding integration with the United States, we analyse the issue in more depth by distinguishing between inflows and outflows for trade, and between asset and liabilities for capital stocks in Table 10. But also this split reveals no systematic relationship between a country’s integration with the United States and the strength of the financial transmission of US monetary policy to its equity markets.
An important caveat is that the different proxies for real and financial integration and macroeconomic variables are in some cases significantly correlated with one another; for instance, countries that are very open to trade are generally also open to financial investment from abroad. Hence, one should not give too much weight in interpreting the role of individual variables. Nevertheless, the fact that the results do not change much with regard to the statistical significance of e.g. individual financial integration variables, underlines the robustness of the results.
Finally, we conduct several extensions and robustness tests to these results. In particular, many other US developments and news are likely to be transmitted to foreign equity markets. It is impossible to capture and include all relevant US news, but we have a set of 11 of the most important announcements of US macroeconomic news13 which we have included and tested. The first important result from this exercise is that the transmission of US monetary policy shocks to global equity markets is basically unchanged when controlling for US macroeconomic news. This is shown by the coefficient for US monetary policy shocks of -0.039 in Table 11. Equally importantly, several US macroeconomic shocks have a significant effect on foreign equity markets, including non-farm payroll employment, CPI, PPI, advanced GDP, industrial production, and the trade balance. All signs are as expected.14
13
These are the surprise component of the announcements of the following US macroeconomic news: mostly monthly announcements for non-farm payroll employment, ISM business confidence, consumer confidence, GDP (advance releases), industrial production, CPI, PPI, retail sales, trade balance, housing starts and hours worked per week. The surprise component of a variable is calculated as the difference between the announced value and the expected value, where the latter is measured as the median expectation in surveys conducted by Money Market Services (MMS) International.
14
The variable that at first may appear to have a counter-intuitive sign is non-farm payroll employment. However, Boyd, Hu and Jagannathan (2005) show why negative employment news tend to raise stock returns, which mainly occurs through expectations of monetary easing. Note that although monetary policy is endogenous to many macroeconomic variables, the use of the announcement surprise of these variables ensures exogeneity of all the shocks in the empirical model.
The second important finding is that the transmission process of US macroeconomic shocks is similar in its structure to the transmission of US monetary policy shocks. As an example, Tables 12 and 13 show the findings for the determinants of the transmission of shocks in US industrial production. We again find that the transmission of such US shocks to global equity markets takes place mainly for those countries that are highly integrated with the rest of the world, but not necessarily with the United States (Table 12). Nevertheless, overall the transmission of shocks in US industrial production to global equity markets is significantly weaker – in the sense that it affects fewer countries – b