Data mining, a relatively young and interdisciplinary field of process of discovering new patterns from large methods, often used to identify previously unknown patterns as well as learning known patterns. The actual data-mining task is the automatic or semi-automatic analysis of large quantities of data to extract previously unknown interesting patterns such as groups of data records (cluster analysis), unusual records (anomaly detection) and dependencies (association rule mining). These patterns can then be seen as a kind of summary of the input data, and used in identify multiple groups in the data, which can then be used to obtain more accurate prediction results by a
Biological databases are libraries of life sciences information, collected from scientific experiments, published literature, high-throughput experiment technology, and computational analyses. They contain information from research areas including genomics, proteomics, metabolomics, phylogenetics and microarray gene expression. Information contained in biological databases includes gene function, structure, localization, clinical effects of mutations as well as similarities of biological sequences and
structures
Issue of Nucleic Acids Research (NAR) features descriptions of 96 new and 83 updated online databases covering various areas of molecular biology (Galperin and Cochrane, 2011). It includes two editorials, one that discusses COMBREX, a new exciting project aimed at figuring out the functions of the ‘conserved hypothetical’ proteins, and one concerning BioDBcore, a proposed description of the ‘minimal information about a biological database’. International Nucleotide Sequence Database collaboration (INSDC) describes each of the participating databases, DDBJ, ENA and GenBank, principles of data exchange within the collaboration, and the recently established Sequence Read Archive. The Nucleic Acids Research online Database Collection in 2011, available at: biology databases.
Applications of data mining techniques in biological databases are many, like, Data Mining Techniques (DMT) for discovery of sequential and structured patterns, DMT for high throughput genome mapping, DMT in microarrays for gene expression, DMT in
healthcare sector, DMT for information extraction from text, DMT for SNP and indels
detection, DMT in metabolomics, DMT in disease risk prediction. However, this lecture notes is confined to application of Hidden Markov Models in biological databases. Besides, a brief description is given on the application of DMT in the above listed fields.
Hidden Markov Models (HMMs): HMMs are very well suited for many tasks in molecular biology. An HMM is similar to Markov chain, but is more general and flexible, and allows to model phenomena that cannot be explained well with a regular Markov chain model. The main advantage of HMM is that when a state is visited by the Markov chain, the state “emits” a letter from a fixed-independent alphabet. Letters are emitted via a time independent, but usually state-dependent, probability distribution over the alphabet. When the HMM runs, there is, first, a sequence of states visited, which are denoted by q1, q2, q3,
Winter School on "Data Mining Techniques and Tools for Knowledge Discovery in Agricultural Datasets”
346
…, and second, a sequence of emitted symbols, denoted by φ1, φ2, φ3
Initial → emission → transition → emission → transition → emission → …
,…. Generation of symbols can be visualized as a two step process as follows:
q1 φ1 to q2 φ2 to q3 φ3
Denoting entire sequence of qi’s by Q and the entire sequence of φi’s by φ, one can write
“the observed sequence φ = φ1, φ2, φ3, …” and “the state sequence Q = q1, q2, q3, …”.
Quite often, the sequence φ is known but not the sequence Q. In such a case the sequence
Q is called “hidden”. An important feature of HMMs is that one can efficiently answer
several questions about φ and Q.
An HMM consists of the following five components: 1. A set of N states S1, S2,…, SN
2. An alphabet of M distinct observation symbols A = {a .
1, a2, …, aM
3. The transition probability matrix P = (p
}.
ij P
), where
ij = Prob ( qt+1 = Sj |qt
4. The emission probabilities: For each state Si and a in A, = Si ).
bi
The probabilities b
(a) = Prob (Si emits a symbol a)
i (a) form the elements in an N × M matrix B = (bi
5. An initial distribution vector π = (π
(a)).
i), where πi = Prob (q1 = Si).
The components 1 and 2 describe the structure of the model, and 3-5 describe the parameters. It is convenient to let λ = (P, B, π). There are three main calculations that are frequently required in HMM theory. Given some observed output sequence φ = φ1, φ2,φ3, …, these are:
(i) Given the parameters λ, efficiently calculate Prob (φ | λ).
That is efficiently calculating the probability of some given sequence of observed outputs.
(ii) Efficiently calculate the hidden sequence Q = q1, q2, q3, …, qT
argmax Prob (Q | φ).
of states that is most likely to have occurred, given φ. That is, calculate
Q
(iii) Assuming a fixed topology of the model, find the parameters = (P, B, π) that maximize Prob (φ | λ).
Details on the above said algorithms (i) to (iii) are given in Ewens and Grant (2001).
The most popular use of the HMM in molecular biology is as a ‘probabilistic pro-file’ of a protein family, which is called a profile HMM. From a family of proteins (or DNA) a profile HMM can be made for searching a database for other members of the family.
Winter School on "Data Mining Techniques and Tools for Knowledge Discovery in Agricultural Datasets”
347
Profile HMM treats gaps in a systematic way. HMMs are particularly well suited for problems with a simple ‘grammatical structure,’ such as gene finding. In gene finding several signals must be recognized and combined into a prediction of exons and introns, and the prediction must conform to various rules to make it a reasonable gene prediction. An HMM can combine recognition of the signals, and it can be made such that the predictions always follow the rules of a gene.
From regular expressions to HMMs: Regular expressions are used to characterize protein families, which is the basis for the PROSITE database [Bairoch et al., 1997]. Using regular expressions is a very elegant and efficient way to search for some protein families, but difficult for other. As already mentioned in the introduction, the difficulties arise because protein spelling is much more free than English spelling. Therefore the regular expressions sometimes need to be very broad and complex. Let us imagine a DNA motif like this: A C A - - - A T G T C A A C T A T C A C A C - - A G C A G A - - - A T C A C C G - - A T C --- T G C T - - A G G --- A C A C - - A T C --- A regular expression for this is
[AT] [CG] [AC] [ACGT]* A [TG] [GC],
meaning that the first position is A or T, the second C or G, and so forth. The term ‘[ACGT]*’ means that any of the four letters can occur any number of times. The problem with the above regular expression is that it does not in any way distinguish between the highly implausible sequence
T G C T - - A G G
which has the exceptional character in each position, and the consensus sequence with the A C A C - - A T C
Winter School on "Data Mining Techniques and Tools for Knowledge Discovery in Agricultural Datasets”
348
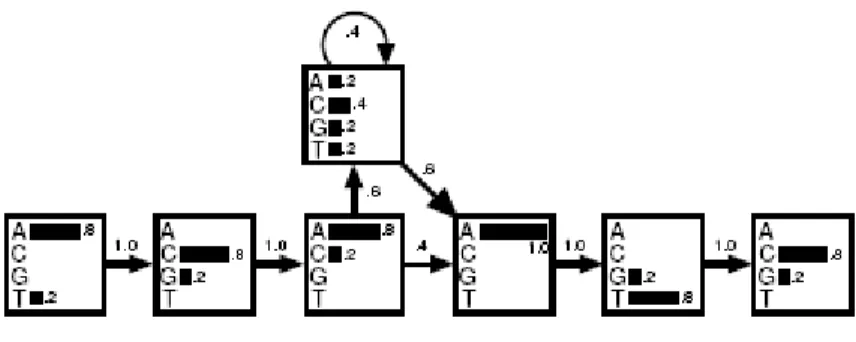
Figure 1: A hidden Markov model derived from the alignment discussed in the text above. The transition probabilities are shown with arrows. In each state the histogram shows the probabilities of the four nucleotides
most plausible character in each position (the dashes are just for aligning these sequences with the previous ones). It is possible to make the regular expression more discriminative by splitting it into several different ones, but it easily becomes messy. The alternative is to score sequences by how well they fit the alignment. To score a sequence, there is a probability of 4/5= 0 _ 8 for an A in the first position and 1/5= 0 _ 2 for a T, because out of 5 letters 4 are As and one is a T. Similarly in the second position the probability of C is 4/5 and of G 1/5 and so forth. After the third position in the alignment, 3 out of 5 sequences have ‘insertions’ of varying lengths, so the probability of making an insertion is 3/5 and thus 2/5 for not making one. To keep track of these numbers a diagram can be drawn with probabilities as in Fig. 1.
The above mentioned figure indicates a hidden Markov model. A box in the drawing is called a state, and there is a state for each term in the regular expression. All the probabilities are found by counting in the multiple alignment how many times each event occur, just as described above. The only part that might seem tricky is the ‘insertion’, which is represented by the state above the other states. The probability of each letter is found by counting all occurrences of the four nucleotides in this region of the alignment. The total counts are one A, two Cs, one G, and one T, yielding probabilities 1/5, 2/5, 1/5 and 1/5 respectively. After sequences 2, 3 and 5 have made one insertion each, there are two more insertions (from sequence 2) and the total number of transitions back to the main line of states is 3. Therefore there are 5 transitions in total from the insert state, and the probability of making a transition to itself is 2/5 and the probability of making one to the next state is 3/5.
It is now easy to score the consensus sequence ACACATC. The probability of the first A is 4/5. This is multiplied by the probability of the transition from the first state to the second, which is 1. Continuing this, the total probability of the consensus is
P(ACACATC) = .8 × 1 × .8 × 1 × .8 × .6 × .4 × .6 × 1 × 1 × .8 × 1 × .8 = 4.7 × 10 Making the same calculation for the exceptional sequence yields only 0 _ 0023 x 10
-2
-2
which is roughly 2000 times smaller than for the consensus. This way one can achieve the goal of getting a score for each sequence, a measure of how well a sequence fits the motif.
Winter School on "Data Mining Techniques and Tools for Knowledge Discovery in Agricultural Datasets”
349
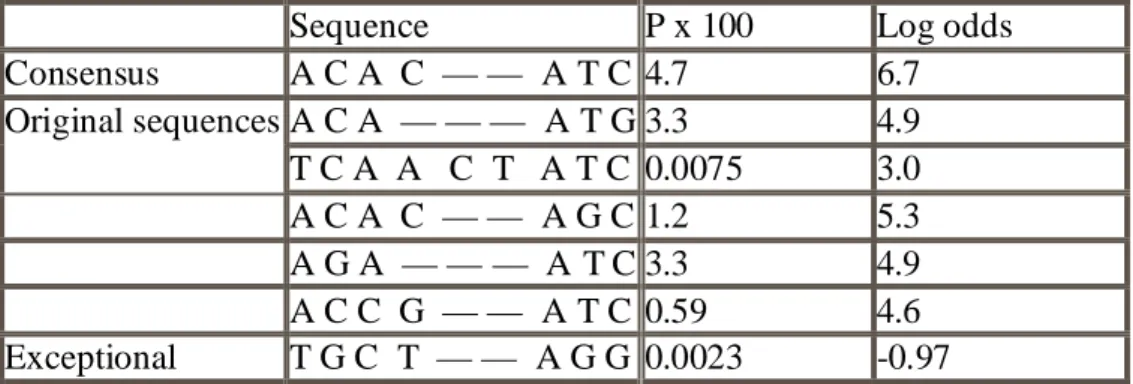
Table 1: Probabilities and log-odds scores for the 5 sequences in the alignment and for the consensus sequence and the ‘exceptional’ sequence.
Sequence P x 100 Log odds
Consensus A C A C — — A T C 4.7 6.7 Original sequences A C A — — — A T G 3.3 4.9 T C A A C T A T C 0.0075 3.0 A C A C — — A G C 1.2 5.3 A G A — — — A T C 3.3 4.9 A C C G — — A T C 0.59 4.6 Exceptional T G C T — — A G G 0.0023 -0.97
Table 1 shows the calculated probabilities of other four original sequences in the alignment. The probability depends very strongly on the length of the sequence. Therefore the probability itself is not the most convenient number to use as a score, and the log-odds score shown in the last column of the table is usually better. It is the logarithm of the probability of the sequence divided by the probability according to a null model. The null model is one that treats the sequences as random strings of nucleotides, so the probability of a sequence of length L is 0 _ 25L
Log-odds for sequence S = log
. Then the log-odds score is
L 25 . 0 ) S ( P = log P(S) – L log 0.25.
One can also use other null models instead. Often one would use the over-all nucleotide frequencies in the organism studied instead of just 0.25. For instance, the calculation of the log-odds of the consensus sequence is
Log-odds(ACACATC) = 1.16 + 0 + 1.16 + 0 + 1.16 – 0.51 + 0.47 – 0.51 + 1.39 + 0 +
1.16 + 0 + 1.16 = 6.64
If the alignment had no gaps or insertions we would get rid of the insert state, and then all the probabilities associated with the arrows (the transition probabilities) would be 1 and might as well be ignored completely. Then the HMM works exactly as a weight matrix of log-odds scores, which is commonly used.
Profile HMMs: A profile HMM is a certain type of HMM with a structure that in a natural way allows position dependent gap penalties. A profile HMM can be obtained from a multiple alignment and can be used for searching a database for other members of the
family in the alignment very much like standard profiles [Gribskov et al, 1987]. The
structure of the model is shown in Fig. 2. The bottom line of states are called the main states, because they model the columns of the alignment. In these states the probability distribution is just the frequency of the amino acids or nucleotides as in the above model of the DNA motif.
Winter School on "Data Mining Techniques and Tools for Knowledge Discovery in Agricultural Datasets”
350
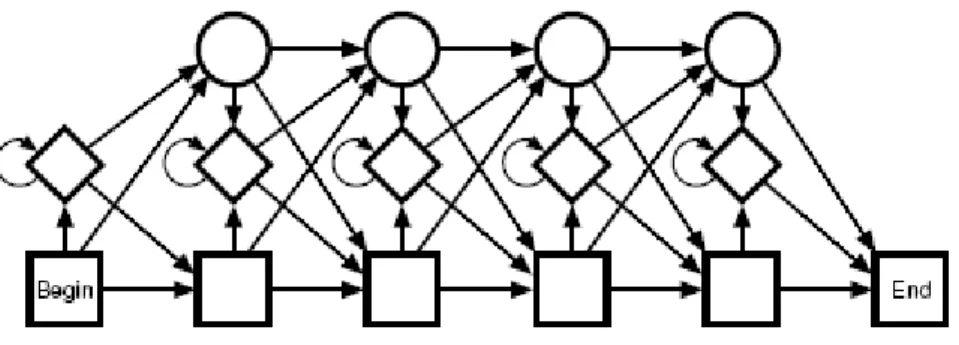
Figure 2. The structure of the profile HMM
The second row of diamond shaped states is called insert states and is used to model highly variable regions in the alignment. They function exactly like the top state in Fig. 1,
although one might choose to use a fixed distribution of residues, e.g. the overall
distribution of amino acids, instead of calculating the distribution as in the example above. The top line of circular states is called delete states. These are a different type of state, called a silent or null state. They do not match any residues, and they are there merely to make it possible to jump over one or more columns in the alignment, i.e., to model the situation when just a few of the sequences have a ‘–’ in the multiple alignment at a position.
Searching a database: It is discussed earlier how to calculate the probability of a sequence in the alignment by multiplying all the probabilities (or adding the log-odds scores) in the model along the path followed by that particular sequence. However, this path is usually not known for other sequences which are not part of the original alignment, and the next problem is how to score such a sequence. Obviously, if one can find a path through the model where the new sequence fits well in some sense, then one can score the sequence as before. All it needs is to ‘align’ the sequence to the model. It resembles very much the pairwise alignment problem, where two sequences are aligned so that they are most similar, and indeed the same type of dynamic programming algorithm can be used.
For a particular sequence, an alignment to the model (or a path) is an assignment of states to each residue in the sequence. There are many such alignments for a given sequence. For instance an alignment might be as follows. Let us label the amino acids in a protein as A1, A2, A3, etc. Similarly we can label the HMM states as M1, M2, M3, etc. for match states, I1, I2, I3 for insert states, and so on. Then an alignment could have A1 match state M1, A2 and A3 match I1, A4 match M2, A5 match M6 (after passing through three delete states), and so on. For each such path we can calculate the probability of the sequence or the
log-odds score, and thus we can find the best alignment, i.e., the one with the largest
probability. Although there are an enormous number of possible alignments it can be done efficiently by the above mentioned dynamic programming algorithm, which is called the Viterbi algorithm. The algorithm also gives the probability of the sequence for that alignment, and thus a score is obtained. The log-odds score found in this manner can be used to search databases for members of the same family.
HMMs for gene finding: One ability of HMMs, which is not really utilized in profile HMMs, is the ability to model grammar. Many problems in biological sequence analysis have a grammatical structure, and eukaryotic gene structure is one such example. If one can consider exons and introns as the ‘words’ in a language, the sentences are of the form exon-intron-exon-intron...intron-exon. The ‘sentences’ can never end with an intron, at
Winter School on "Data Mining Techniques and Tools for Knowledge Discovery in Agricultural Datasets”
351
least if the genes are complete, and an exon can never follow an exon without an intron in between. Obviously this grammar is greatly simplified, because there are several other constraints on gene structure, such as the constraint that the exons have to fit together to give a valid coding region after splicing. In Figure the structure of a gene is shown with some of the known signals marked.
Figure 3: The structure of a gene with some of the important signals shown.
Formal language theory applied to biological problems is not a new invention. In particular Searls (1992) has promoted this idea and used it for gene finding [Dong and Searls, 1994], but many other gene finders use it implicitly. Formally the HMM can only represent the simplest of grammars, which is called a regular grammar, but that turns out to be good enough for the gene finding problem, and many other problems. Krogh (1998) outlined an approach to find genes with the weight on the principles rather than on the details.
Signal sensors: One may apply an HMM similar to the ones already described directly to many of the signals in a gene structure. In Figure 4 an alignment is shown of some sequences around acceptor sites from human DNA. It has 19 columns and an HMM with 19 states (no insert or delete states) can be made directly from it. Since the alignment is gap-less, the HMM is equivalent to a weight matrix.
Figure 4: Examples of human acceptor sites (the splice site 5’ to the exon). Except in rare cases, the intron ends with AG, which has been highlighted. Included in these sequences are 16 bases upstream of the splice site and 3 bases downstream into the exon.
There is one problem: in DNA there are fairly strong dinuclotide preferences. A model like the one described treats the nucleotides as independent, so dinucleotide preferences can not be captured. This is easily fixed by having 16 probability parameters in each state instead of 4. In column two we first count all occurrences of the four nucleotides given that there is
Winter School on "Data Mining Techniques and Tools for Knowledge Discovery in Agricultural Datasets”
352
an A in the first column and normalize these four counts, so they become probabilities. This is the conditional probability that a certain nucleotide appears in position two, given that the previous one was A. The same is done for all the instances of C in column 1 and similarly for G and T. This gives a total of 16 probabilities to be used in state two of the HMM. Similarly it can be extended to all the other states. To calculate the probability of a sequence, say ACTGTC, we just multiply the conditional probabilities
P(ACTGTC…) = p1(A) × p2(C/A) × p3(T/C) × p4(G/T) × p5(T/G) × p6
Here p1 is the probability of the four nucleotides in state 1, p2(x/y) is the conditional probability in state 2 of nucleotide x given that the previous nucleotide was y, and so forth. A state with conditional probabilities is called a first order state, because it captures the first order correlations between neighboring nucleotides. It is easy to expand to higher order. A second order state has probabilities conditioned on the two previous nucleotides in the sequence, i.e., probabilities of the form p(x/y,z) . Small HMMs like this are constructed in exactly the same way for other signals: donor splice sites, the regions around the start codons, and the regions around the stop codons.
(C/T) × …
Softwares and websites on HMMs: There are two program packages available free of charge to the academic community. One, developed by Sean Eddy, is called hmmer (pronounced ‘hammer’), and can be obtained from his web-site
(http://genome.wustl.edu/eddy/hmm.html). The other one, called SAM
(http://www.cse.ucsc.edu/research/compbio/sam.html), was developed by Anders Krogh and the group at UC Santa Cruz, and it is now being maintained and further developed under the command of Richard Hughey. The gene finder sketched above is called HMMgene. The current version of HMM gene is available at the web site EcoParse developed for E. coli [Krogh et al., 1994]. VEIL [Henderson et al., 1997] is a recent HMM based gene finder for human genes. The main difference from HMMgene is that it does not use high order states (neither does EcoParse), which makes good modeling of coding regions harder. Two recent methods use socalled generalized HMMs. Genie [Kulp et al.,1996; Reese et al., 1997; Kulp et al., 1997] combines neural networks into an HMM-like model, whereas GENSCAN [Burge and Karlin(1997)] is more similar to HMMgene, but uses a different model type for splice site. Also, the generalized HMM can explicitly use exon length distributions, which is not possible in a standard HMM. Web pointers to gene finding can be found at Other applications of HMMs related to gene finding are: detection of short protein coding regions and analysis of translation initiation sites in Cyanobacterium [Yada and Hirosawa,
1996; Yada et al., 1997], characterization of prokaryotic and eukaryotic promoters
[Pedersen et al., 1996], and recognition of branch points [Tolstrup et al., 1997]. Apart from the areas mentioned here, HMMs have been used for prediction of protein secondary structure [Asai et al., 1993], modeling an oscillatory pattern in nucleosomes [Baldi et al., 1996], modeling site dependence of evolutionary rates [Felsenstein and Churchill, 1996], and for including evolutionary information in protein secondary structure prediction [Goldman et al., 1996].
Cluster analysis in Biological databases: Understanding complex systems often requires a bottom-up analysis towards a systems biology approach. The need to investigate a system, not only as individual components but as a whole, emerges. This can be done by examining the elementary constituents individually and then how these are connected. The myriad components of a system and their interactions are best characterized as networks
Winter School on "Data Mining Techniques and Tools for Knowledge Discovery in Agricultural Datasets”
353
and they are mainly represented as graphs where thousands of nodes are connected with thousands of vertices. Pavlopoulos et al.(2011) demonstrated the approaches, models and methods from the graph theory universe and discussed the ways in which they can be used to reveal hidden properties and features of a network. This network profiling combined with knowledge extraction will help understand the biological significance of the system.
Data Mining Techniques in Genome Mapping: Genome database mining is the identification of the protein-encoding regions of a genome and the assignment of functions to these genes on the basis of sequence similarity homologies against other genes of known function. Gene expression database mining is the identification of intrinsic patterns and relationships in transcriptional expression data generated by large-scale gene expression experiments. Proteome database mining is the identification of intrinsic patterns and relationships in translational expression data generated by large-scale proteomics experiments. Improvements in genome, gene expression and proteome database mining algorithms will enable the prediction of protein function in the context of higher order processes such as the regulation of gene expression, metabolic pathways and signaling cascades. Thus, the final objective of such higher-level functional analysis will be the elucidation of high-resolution structural and functional maps of the organism
Data Mining Techniques in Microarrays for Gene expression: Microarrays are one of the latest breakthroughs in experimental molecular biology that allow monitoring the expression levels of tens of thousands of genes simultaneously. Arrays have been applied to studies in gene expression, genome mapping, SNP discrimination, transcription factor activity, toxicity, pathogen identification and many other applications. In this paper we concentrate on discussing various bioinformatics tools used for microarray data mining tasks with its underlying algorithms, web resources and relevant reference. Selvaraj and Natarajan (2011) emphasized mainly for digital biologists to get an aware about the plethora of tools and programs available for Microarrays data analysis. Besides, they also reported the common data mining applications such as selecting differentially expressed genes, clustering, and classification. Next, they focused on gene expression based knowledge discovery studies such as transcription factor binding site analysis, pathway analysis, protein- protein interaction network analysis and gene enrichment analysis.
The expression of many genes can be determined by measuring mRNA levels with multiple techniques including Microarrays, expressed cDNA sequence tag (EST) sequencing, serial analysis of gene expression (SAGE) tag sequencing, massively parallel signature sequencing (MPSS), RNA-Seq, also known as "Whole Transcriptome Shotgun Sequencing" (WTSS), or various applications of multiplexed in-situ hybridization. All of these techniques are extremely noise-prone and/or subject to bias in the biological measurement, and a major research area in computational biology involves developing statistical tools to separate signal from noise in high-throughput gene expression studies. Such studies are often used to determine the genes implicated in a disorder: one might compare Microarrays data from cancerous epithelial cells to data from non-cancerous cells to determine the transcripts that are up-regulated and down-regulated in a particular population of cancer cells.
Data Mining Techniques in Healthcare Sector: The healthcare environment is generally perceived as being ‘information rich’ yet knowledge poor’. There is a wealth of data available within the healthcare systems. However, there is a lack of effective analysis tools to discover hidden relationships and trends in data. Knowledge discovery and data mining have found numerous applications in business and scientific domain. Valuable knowledge
Winter School on "Data Mining Techniques and Tools for Knowledge Discovery in Agricultural Datasets”
354
can be discovered from application of data mining techniques in healthcare system. Srinivas et al. (2010) briefly examined the potential use of classification based data mining techniques such as Rule based, Decision tree, Naïve Bayes and Artificial Neural Network to massive volume of healthcare data. The healthcare industry collects huge amounts of healthcare data which, unfortunately, are not “mined” to discover hidden information. For data preprocessing and effective decision making One Dependency Augmented Naïve Bayes classifier (ODANB) and naive creedal classifier 2 (NCC2) are used. This is an extension of naïve Bayes to imprecise probabilities that aims at delivering robust classifications also when dealing with small or incomplete data sets. Discovery of hidden patterns and relationships often goes unexploited. Using medical profiles such as age, sex, blood pressure and blood sugar it can predict the likelihood of patients getting a heart disease. It enables significant knowledge, e.g. patterns, relationships between medical factors related to heart disease, to be established.
Data Mining Techniques in SNPs and Indels detection: Genomic studies provide large volumes of data with the number of single nucleotide polymorphisms (SNPs) ranging into thousands. The analysis of SNPs permits determining relationships between genotypic and phenotypic information as well as the identification of SNPs related to a disease.The growing wealth of information and advances in biology call for the development of approaches for discovery of new knowledge. One such area is the identification of gene/SNP patterns impacting cure/drug development for various diseases. Shah and Kusiak (2004) had proposed a new approach for predicting drug effectiveness is presented. The approach is based on data mining and genetic algorithms. A global search mechanism, weighted decision tree, decision-treebased wrapper, a correlation-based heuristic, and the identification of intersecting feature sets are employed for selecting significant genes.
Data Mining Techniques in Metabolomics: Disease diagnosis using molecular profiles has gained more attention during the last decades. Among the molecular diagnosis study, metabolomics has been a recently emerging field as promising tools for early detection of diseases. However, due to complexity and largeness of the metabolic profile data, data mining techniques have been essential to handle, process, and analyze the data, and also it is not obvious to apply the data mining techniques to such data, accordingly suggesting the need for suitable data mining strategies for the metabolomics data analysis. Kim et al.
(2007) proposed that the required data mining procedures for effective metabolomics studies including description of current limit or future prospect and their approaches, consisting of preprocessing, dimension reduction, feature analysis and selection, classification, and automated data processing software.
References
Asai, K., Hayamizu, S., and Handa, K. (1993) Computer Applications in the Biosciences 9, 141–146.
Bairoch, A., Bucher, P., and Hofmann, K. (1997) Nucleic Acids Research 25, 217–221.
Baldi, P., Brunak, S., Chauvin, Y., and Krogh, A. (1996) Journal of Molecular Biology
263, 503–510.
Burge, C. and Karlin, S. (1997) Journal of Molecular Biology 268, 78–94. Dong, S. and Searls, D. B. (1994) Genomics 23, 540–551.
Ewens, W.J. and G. R. Grant, 2001. Statistical methods in Bioinformatics – An Introduction. Springer-Verlag New York, Inc.
Winter School on "Data Mining Techniques and Tools for Knowledge Discovery in Agricultural Datasets”
355
Galperin, M.Y. and Cochrane, G.R. (2011). The 2011 Nucleic Acids Research Database
Issue and the online Molecular Biology Database Collection, Nucleic Acids
Research, 39(suppl1): D1-D6.
Goldman, N., Thorne, J. L., and Jones, D. T. (1996) Journal of Molecular Biology 263,
196–208.
Gribskov, M., McLachlan, A. D., and Eisenberg, D. (1987) Proc. of the Nat. Acad. of
Sciences of the U.S.A. 84, 4355–4358.
Henderson, J., Salzberg, S., and Fasman, K. H. (1997) Finding genes in DNA with a hidden Markov model Journal of Computational Biology.
Kim,Y., Park, I. and Lee, D. (2007). Integrated Data Mining Strategy for Effective Metabolomic Data Analysis, The First International Symposium on Optimization and Systems Biology (OSB’07) Beijing, China, ORSC & APORC, 45–51.
Krogh, A. (1998). An introduction to Hidden Markov Models for biological sequences. In
Computational methods in molecular biology, edited by S.L.Salzberg, D.B. Searls and S. Kasif, pp 45-63. Elsevier.
Krogh, A., Mian, I. S., and Haussler, D. (1994) Nucleic Acids Research 22, 4768–4778. Kulp, D., Haussler, D., Reese, M. G., and Eeckman, F. H. (1996) A generalized hidden
Markov model for the recognition of human genes in DNA In States, D., Agarwal, P., Gaasterland, T., Hunter, L., and Smith, R. (Eds.), Proc. Conf. on Intelligent Systems in Molecular Biology pp. 134–142 Menlo Park, CA. AAAI Press.
Kulp, D., Haussler, D., Reese, M. G., and Eeckman, F. H. (1997) Integrating database homology in a probabilistic gene structure model In Altman, R. B., Dunker, A. K.,
Hunter, L., and Klein, T. E. (Eds.), Proceedings of the Pacific Symposium on
Biocomputing New York. World Scientific.
Pavlopoulos, G., Secrier, M., Moschopoulos, C.N., Soldatos, T.G., Kossida, S., Aerts, J., Schneider, R. and Bagos, P.G. (2011). Using graph theory to analyze biological networks, BioData Mining, 4:10.
Pedersen, A. G., Baldi, P., Brunak, S., and Chauvin, Y. (1996) Characterization of
prokaryotic and eukaryotic promoters using hidden Markov models In Proc. of
Fourth Int. Conf. on Intelligent Systems for Molecular Biology pp. 182–191 Menlo Park, CA. AAAI Press.
Reese, M. G., Eeckman, F. H., Kulp, D., and Haussler, D. (1997) Improved splice site
detection in Genie In Waterman, M. (Ed.), Proceedings of the First Annual
International Conference on Computational Molecular Biology (RECOMB) New York. ACM Press.
Searls, D. B. (1992) American Scientist 80, 579–591.
Selvaraj, S. and Natarajan, J. (2011). Microarray Data Analysis and Mining Tools,
Bioinformation, 6(3), 95-99.
Shah, S.C., and Kusiak, A. (2004). Data mining and genetic algorithm based gene/SNP selection, Artificial Intelligence in Medicine, 31, 183—196.
Srinivas,K., Rani, B.K., and Govrdhan, A. (2010). Applications of Data Mining Techniques in Healthcare and Prediction of Heart Attacks, International Journal on Computer Science and Engineering, 2(2), 250-255
Tolstrup, N., Rouz´e, P., and Brunak, S. (1997) Nucleic Acids Research 25, 3159–3164. Yada, T. and Hirosawa, M. (1996) DNA Res. 3, 355–361.