Storm Drainage
System Research
Project
Storm Drainage
System Research
Project
Flow Rate thRough RooF DRains
by Julius Ballanco, Pe, CPD, FasPe
The American Society of Plumbing Engineers Research Foundation conducted research on the flow rates through various manufacturers’ roof drains. The research
produced stunning results that verified that the sizing method for storm drainage systems, as required in the plumbing codes, is inaccurate. A new approach to sizing storm drainage systems was developed based on the research test results.
This research project was conducted under the direction, and with funding from, the American Society of Plumbing Engineers Research Foundation, Inc. The Board of Directors of the American Society of Plumbing Engineers Research Foundation is as follows:
President: Julius Ballanco, PE, CPD, FASPE Vice Presidents: David Anelli
William Erickson
William Hughes, CPD, FASPE, LEED AP Curtis Ray Jr., CPD
Max Weiss Stanley Wolfson
Treasurer: Carol Johnson, CPD, LEED AP Secretary: Jim Kendzel, MPH, CAE
This research project was co-sponsored by the International Association of Plumbing and Mechanical Officials (IAPMO). The American Society of Plumbing Engineers Research Foundation would like to thank IAPMO for their generous support of this important research project.
This research report was subjected to a peer review prior to publication. The American Society of Plumbing Engineers Research Foundation would like to thank the following individuals who participated in the peer review:
Philip D. Dregger, PE, RRC
Technical Roof Services Inc. (TRS) 2339 Stanwell Circle, Suite A Concord, CA 94520-4875 Jerry Teitsma, RRC, CCCA RCI Education
PO Box 796 Granby, CO 80446
Johann L. Willers, PE, RRC, FRCI, FASCE Rooftop Systems Engineers, PC
316 W. Millbrook Road Raleigh, NC 27609 Dan Cole
Technical Services Supervisor IAPMO
4755 E. Philadelphia St. Ontario, CA 91761
Rand Ackroyd
Rand Technical Consulting 290 High St. Newburyport, MA 01950 Daniel G. Howell, PE FM Global Engineering Standards 1151 Boston-Providence Turnpike Norwood, Massachusetts 02062 Peter J. Gore Willse, PE, FSFPE, MASCE Vice President - Director of Research Global Asset Protection Services XL Group
100 Constitution Plaza, 12th Floor Hartford, CT 06103 Dave Orton Senior Engineer NSF International 789 N. Dixboro Road Ann Arbor, MI 48105
ASPE Research Foundation Board of Directors
taBle oF Contents
Introduction ... 8
Review of Available Data ... 8
Plumbing Codes ... 9
Other Reference Documents... 12
Referenced Standard ... 13
Roof Drain Testing ... 13
Preliminary Tests ... 13
Testing at IAPMO R&T Laboratories ... 13
Figure 1 ...14
Table 1 Roof Drains Tested By IAPMO R&T Laboratories ...15
Test Results ...16
Interpretation of Data ... 17
Predictions Prior to Testing... 17
Analysis of Testing without Roof Drain ... 17
Table 2-0, Comparison Flow Rates to without a Roof Drain ...18
Analysis of No-Pipe Connected Roof Drain Test ...18
Analysis of Straight Pipe Compared to Pipe with an Offset ...18
Analysis of 2-Inch Roof Drains with Straight Pipe ...18
Table 2-1, 2” Roof Drain Test Results ...19
Chart 2-1a, 2” Roof Drain Comparison of Test Results ...20
Chart 2-1b, 2” Roof Drain Comparison of Test Results ...20
Table 2-2, 2” Roof Drain Test Results ...21
Chart 2-2a, 2” Roof Drain Comparison of Test Results ...21
Chart 2-2b, 2” Roof Drain Comparison of Test Results ...22
Analysis of 2-Inch Roof Drains with Offset Piping ...23
Table 2-3, 2” Roof Drain Test Results ...23
Chart 2-3a, 2” Roof Drain Comparison of Test Results ...24
Chart 2-3b, 2” Roof Drain Comparison of Test Results ...24
Analysis of 3-Inch Roof Drains with Straight Pipe ...25
Table 3-1, 3” Roof Drain Test Results ...25
Chart 3-1a, 3” Roof Drain Comparison of Test Results ...26
Chart 3-1b, 3” Roof Drain Comparison of Test Results ...26
Chart 3-1c, 3” Roof Drain Comparison of Test Results ...27
Table 3-2, 3” Roof Drain Test Results ...27
Chart 3-3c, 3” Roof Drain Comparison of Test Results ... 32
Analysis of 4-Inch Roof Drains with Straight Pipe ... 33
Table 4-1, 4” Roof Drain Test Results ... 33
Chart 4-1a, 4” Roof Drain Comparison of Test Results...34
Chart 4-1b, 4” Roof Drain Comparison of Test Results ...34
Chart 4-1c, 4” Roof Drain Comparison of Test Results ... 35
Chart 4-1d, 4” Roof Drain Comparison of Test Results ... 35
Table 4-2, 4” Roof Drain Test Results ... 36
Chart 4-2a, 4” Roof Drain Comparison of Test Results... 37
Chart 4-2b, 4” Roof Drain Comparison of Test Results... 37
Chart 4-2c, 4” Roof Drain Comparison of Test Results ...38
Chart 4-2d, 4” Roof Drain Comparison of Test Results...38
Analysis of 4-Inch Roof Drains with Offset Piping ... 39
Table 4-3, 4” Roof Drain Test Results ... 39
Chart 4-3a, 4” Roof Drain Comparison of Test Results ...40
Chart 4-3b, 4” Roof Drain Comparison of Test Results...40
Chart 4-3c, 4” Roof Drain Comparison of Test Results ... 41
Chart 4-3d, 4” Roof Drain Comparison of Test Results ... 41
Analysis of Performance of Individual 4-Inch Roof Drains ...42
Chart 4-4a, 4” Roof Drain Model A-3 ...42
Chart 4-4b, 4” Roof Drain Model B-3 ...43
Chart 4-4c, 4” Roof Drain Model C-3 ...43
Chart 4-4d, 4” Roof Drain Model D-3 ...44
Chart 4-4e, 4” Roof Drain Model E-2 ...44
Chart 4-4f, 4” Roof Drain Model E-3 ...45
Chart 4-4g, 4” Roof Drain Model E-5 ...45
Chart 4-4h, 4” Roof Drain Model E-7 ...46
Chart 4-4i, 4” Roof Drain Model F-2 ...46
Chart 4-4j, 4” Roof Drain Model F-6 ... 47
Chart 4-4k, 4” Roof Drain Model G-3 ... 47
Chart 4-4l, 4” Roof Drain Model H-3 ...48
Chart 4-4m, 4” Roof Drain Model I-3 ...48
Chart 4-4n, 4” Roof Drain Model J-3 ...49
Chart 4-4o, 4” Roof Drain Model J-8 ...49
Chart 4-4p, 4” Roof Drain Model J-14 ...50
Analysis of 5-Inch Roof Drains with Straight Pipe ... 51
Table 5-1, 5” Roof Drain Test Results ... 51
Chart 5-1a, 5” Roof Drain Comparison of Test Results ... 52
Chart 5-1b, 5” Roof Drain Comparison of Test Results ... 52
Table 5-2, 5” Roof Drain Test Results ... 53
Chart 5-3a, 5” Roof Drain Comparison of Test Results ...56
Chart 5-3b, 5” Roof Drain Comparison of Test Results ...56
Analysis of 6-Inch Roof Drains with Straight Pipe ... 57
Table 6-1, 6” Roof Drain Test Results ... 57
Chart 6-1a, 6” Roof Drain Comparison of Test Results ...58
Chart 6-1b, 6” Roof Drain Comparison of Test Results ...58
Chart 6-1c, 6” Roof Drain Comparison of Test Results ...59
Chart 6-1d, 6” Roof Drain Comparison of Test Results ...59
Table 6-2, 6” Roof Drain Test Results ...60
Chart 6-2a, 6” Roof Drain Comparison of Test Results ...60
Chart 6-2b, 6” Roof Drain Comparison of Test Results ... 61
Chart 6-2c, 6” Roof Drain Comparison of Test Results ... 61
Chart 6-2d, 6” Roof Drain Comparison of Test Results ...62
Analysis of 6-Inch Roof Drains with Offset Piping ...63
Table 6-3, 6” Roof Drain Test Results ...63
Chart 6-3a, 6” Roof Drain Comparison of Test Results ...64
Chart 6-3b, 6” Roof Drain Comparison of Test Results ...64
Chart 6-3c, 6” Roof Drain Comparison of Test Results ...65
Chart 6-3d, 6” Roof Drain Comparison of Test Results ...65
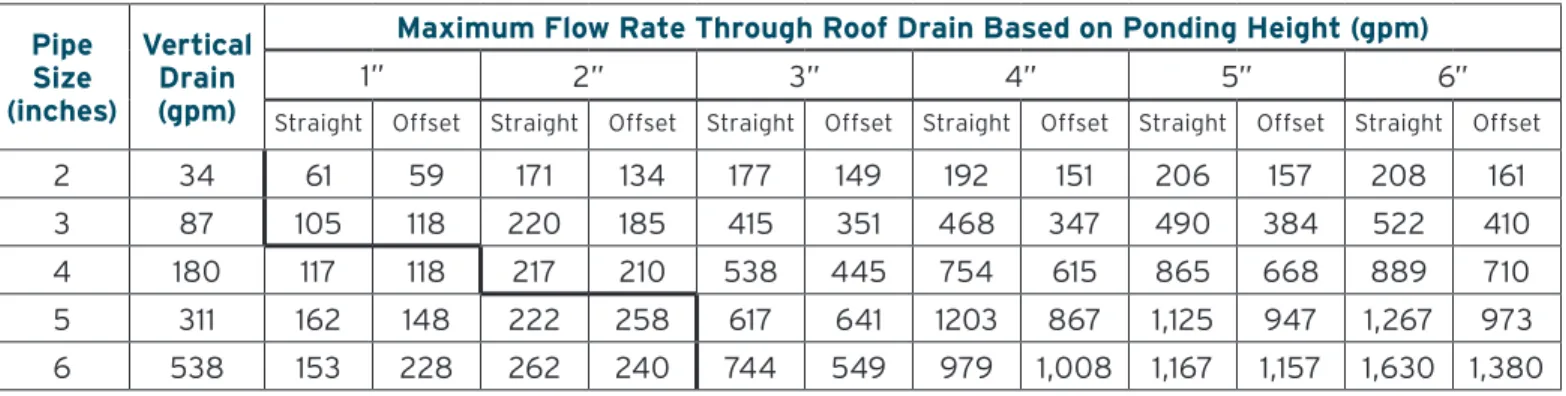
Engineering Analysis ...66
Table 7, Comparison of Roof Drain Flow Rates to Vertical Drain Capacity ...66
Table 8, Comparison of Opening Flow Rates to Maximum Roof Drain Flow Rates ... 67
Chart 8-2, 5” Roof Drain Straight Pipe with Open Pipe Included ...68
Pressure Measured in the Piping System ...69
Sizing Method Recommendation ...69
Recommended Change to ASME Standard ... 70
Figure 10 ... 71
Figure 11 ... 72
Recommended Change to Plumbing Codes ... 73
Table A, Storm Drain Pipe Sizing ... 73
Table B, Vertical Gutter Sizing ... 74
Table C, Horizontal Gutter Sizing ... 75
Appendix A Test Protocol Developed by ASPE Research Foundation ... 76
Appendix B Test Assembly Photos ...80
Appendix C Test Results of Roof Drains ...89
Test 0-2, 2” Opening without a Roof Drain ...89
Test 0-3, 3” Opening without a Roof Drain ...89
5. Manufacturer A, Model A-5 ... 94 6. Manufacturer B, Model B-1... 94 7. Manufacturer B, Model B-2 ...95 8. Manufacturer B, Model B-3 ...95 9. Manufacturer B, Model B-4 ...96 10. Manufacturer C, Model C-1 ...96 11. Manufacturer C, Model C-2 ... 97 12. Manufacturer C, Model C-3 ... 97 13. Manufacturer C, Model C-4 ...98 14. Manufacturer C, Model C-5 ...98 15. Manufacturer D, Model D-1 ...99 16. Manufacturer D, Model D-2 ...99 17. Manufacturer D, Model D-3 ... 100 18. Manufacturer D, Model D-4 ... 100
19. Manufacturer E, Model E-1 ...101
20. Manufacturer E, Model E-2 ...101
21. Manufacturer E, Model E-3 ...102
22. Manufacturer E, Model E-4 ...102
23. Manufacturer E, Model E-5 ...103
24. Manufacturer E, Model E-6 ...103
25. Manufacturer E, Model E-7 ... 104
26. Manufacturer E, Model E-8 ... 104
27. Manufacturer F, Model F-1 ... 105 28. Manufacturer F, Model F-2 ... 105 29. Manufacturer F, Model F-3 ... 106 30. Manufacturer F, Model F-4 ... 106 31. Manufacturer F, Model F-5...107 32. Manufacturer F, Model F-6 ...107 33. Manufacturer F, Model F-7 ... 108 34. Manufacturer F, Model F-8 ... 108 35. Manufacturer G, Model G-1 ... 109 36. Manufacturer G, Model G-2 ... 109 37. Manufacturer G, Model G-3 ...110 38. Manufacturer G, Model G-4 ...110 39. Manufacturer H, Model H-1 ...111 40. Manufacturer H, Model H-2 ...111 41. Manufacturer H, Model H-3 ...112 42. Manufacturer H, Model H-4 ...112 43. Manufacturer H, Model H-5 ...113
44. Manufacturer I, Model I-1 ...113
45. Manufacturer I, Model I-2 ...114
49. Manufacturer J, Model J-3 ...116 50. Manufacturer J, Model J-4 ...116 51. Manufacturer J, Model J-5 ...117 52. Manufacturer J, Model J-6 ...117 53. Manufacturer J, Model J-7 ...118 54. Manufacturer J, Model J-8 ...118 55. Manufacturer J, Model J-9 ...119 56. Manufacturer J, Model J-10 ...119 57. Manufacturer J, Model J-12 ...120 58. Manufacturer J, Model J-13 ...120 59. Manufacturer J, Model J-14 ...121 60. Manufacturer J, Model J-15 ...121
intRoDuCtion
It was brought to the attention of the American Society of Plumbing Engineers Research Foundation (ASPE RF) that a number of failures with storm drainage systems had occurred. The types of failures included:
• Collapse of roof • Pipe fitting separating
• Hanger pulled from prestressed concrete floor/ceiling • Flooding of upper-level balcony decks
• Fitting component failure
• Flooding in the building on upper floors due to pipe failure
Many of these failures resulted in litigation. Of the litigation failures directly identified to ASPE RF, all of the cases were settled. Because of the settlements, the specific cases cannot be identified.
Two of the cases involved testing at SGS U.S. Testing Company (now known as QAI Laboratories Ltd.) in Tulsa, Oklahoma. A mock-up roof assembly was created to test the flow rate through various roof drains. In one set of tests, a 10-inch roof drainwas tested to determine the flow rate based on the head height of water ponding around the drain. (ASME A112.6.4 regulates roof drains in 2-inch through 6-inch diameters. It is recognized that the standard does not regulate 10-inch roof drains.) In this particular series of tests, the 10-inch roof drain flowed less water than most plumbing engineers anticipated for a roof drain of this size. This accounted for the ponding around the roof drain, with the eventual collapse of the roof.
The other testing conducted, using the same test assembly, was of 4-inch roof drains. In this series of tests, the flow rate through the roof drain exceeded the anticipated flow as identified in the plumbing codes. While the plumbing codes do not identify the flow rate through a roof drain, they do identify the maximum flow rate through the storm drainage piping connected to the roof drain.
The testing on the 4-inch drain demonstrated that the flow in the storm drainage piping exceeded the flow rates for an open channel flow in the stack and horizontal building drain. The high rate of flow created pressure differentials in the piping system that far exceeded the pressures assumed for a typical storm drainage system.
With a test assembly already created, an opportunity was presented to ASPE RF to test roof drains at SGS U.S. Testing Company to determine the different flow rates through standard roof drains. ASPE RF asked roof drain manufacturers to provide roof drains for this testing. The following manufacturers made available their roof drains for testing:
• Canplas
• Froet Industries LLC
• Jay R. Smith Manufacturing Co. • Josam Co.
• MIFAB • Oatey
• Sioux Chief Manufacturing Co. • Wade Drains
• Watts Water Technologies • Zurn Engineered Water Solutions
The testing was limited to 2-inch through 6-inch roof drains. The limitation was consistent with the sizes regulated in ASME A112.6.4, which is the standard referenced in the plumbing codes for roof drains.
Plumbing Codes
The plumbing codes reviewed were the three model plumbing codes used in the United States—IAPMO Uniform Plumbing Code (UPC), ICC International Plumbing Code (IPC), and PHCC-NA National Standard Plumbing Code (NSPC)—and the National Plumbing Code of Canada (NPCC). All three U.S. model plumbing codes and the Canadian plumbing code have similar requirements for roof drains and the design of storm drainage systems.
The U.S. model plumbing codes require the roof drains to conform to ASME A112.6.4. In addition to the reference to the ASME standard, the UPC specifies requirements for the height of the dome strainer and the opening in the dome strainer. Section 1105.2 reads:
1105.2 Dome or Strainer for General Use. Roof drains and overflow drains, except those draining to hanging gutters, shall be equipped with strainers extending not less than 4 inches (102 mm) above the surface of the roof immediately adjacent to the drain. Strainers shall have a minimum inlet area above the roof level not less than one and one-half times the area of the conductor or leader to which the drain is connected.
The NSPC includes requirements for the dome strainer in Section 13.5.2. The section reads: 13.5.2 Dome Strainers
Roof areas shall be drained to roof drains having raised dome strainers with dome-free areas complying with
ASME A112.6.4. The minimum free dome area shall be one and one-half (1-1/2) times the area of the drain outlet
connection. EXCEPTIONS
(1) Pitched roofs draining to hanging gutters.
(2) Roof areas subject to pedestrian and/or vehicular traffic.
All three U.S. model plumbing codes require the storm drainage system to be sized for a storm of 60-minute (one-hour) duration and a 100-year return period. The data for the rainfall rates published in the plumbing codes is consistent with the data from the National Weather Bureau.
The sizing of the storm drainage system is based on the capacity of the piping. The UPC and IPC sizing is based on a stack that is one-third full flow and horizontal piping that is flowing full. The NSPC sizing is based on a stack that
is 7/24 full flow and horizontal piping that is flowing full.
Other than the difference in the stack capacity, the sizing is basically the same in the plumbing codes. Both the UPC and IPC have sizing tables for gutters.
The sizing tables in the plumbing codes use the projected roof area for sizing the pipe. The projected roof area is the roof area draining to a particular roof drain and storm drainage pipe. To establish the projected roof area, the rainfall rate is divided by the capacity of the pipe and converted to square footage. For example, if a pipe has a capacity of 110 gallons per minute (gpm) and the rainfall rate is 1 inch of rain per hour, the projected roof area equals 10,588 square feet. (1 inch per square foot per hour equates to 0.6233 gallons per hour and when divided by 60 equals 0.010388 gpm. Dividing 110 gpm by the rainfall rate equals 10,588 square feet, which is rounded up in the plumbing codes to 10,600 square feet.)
The U.S. model plumbing code tables list the projected roof area for various rainfall rates in increments of full inches. If the rainfall rate is a fraction of an inch, the projected roof area is determined by dividing the rainfall rate for 1 inch per hour by the rainfall rate. Using the same 10,600 square feet, divide by 3.1 inches per hour to establish the projected roof area for a storm drainage system in Des Plaines, Illinois. The resulting allowable projected roof area would be 3,419 square feet.
The NPCC has sizing requirements similar to the U.S. model plumbing codes. However, the sizing is based on liters of water on the roof for a 15-minute rainfall. The National Building Code of Canada specifies the rainfall rates. The liters are calculated by the roof area multiplied by the rainfall rate, resulting in cubic meters of water on the roof. Cubic meters are then converted to liters (multiplied by 1,000).
The following UPC sizing tables are shown to identify the typical method of sizing in the plumbing codes. The sizing tables from the UPC are reprinted with permission.
uPC taBle 1101.7
siZing oF hoRiZontal RainwateR PiPing siZe oF PiPe (inches) Flow (gpm at 1/8 inch per foot slope)
MaXiMuM allowaBle hoRiZontal PRoJeCteD RooF aReas at vaRious RainFall Rates
(square feet)
1 (in/h) 2 (in/h) 3 (in/h) 4 (in/h) 5 (in/h) 6 (in/h)
3 34 3,288 1,644 1,096 822 657 548 4 78 7,520 3,760 2,506 1,880 1,504 1,253 5 139 13,360 6,680 4,453 3,340 2,672 2,227 6 222 21,400 10,700 7,133 5,350 4,280 3,566 8 478 46,000 23,000 15,330 11,500 9,200 7,670 10 860 82,800 41,400 27,600 20,700 16,580 13,800 12 1,384 133,200 66,600 44,400 33,300 26,650 22,200 15 2,473 238,000 119,000 79,333 59,500 47,600 39,650 siZe oF PiPe (inches) Flow (gpm at 1/4 inch per foot slope)
MaXiMuM allowaBle hoRiZontal PRoJeCteD RooF aReas at vaRious RainFall Rates
(square feet)
1 (in/h) 2 (in/h) 3 (in/h) 4 (in/h) 5 (in/h) 6 (in/h)
3 48 4,640 2,320 1,546 1,160 928 773 4 110 10,600 5,300 3,533 2,650 2,120 1,766 5 196 18,880 9,440 6,293 4,720 3,776 3,146 6 314 30,200 15,100 10,066 7,550 6,040 5,033 8 677 65,200 32,600 21,733 16,300 13,040 10,866 10 1,214 116,800 58,400 38,950 29,200 23,350 19,450 12 1,953 188,000 94,000 62,600 47,000 37,600 31,350 15 3,491 336,000 168,000 112,000 84,000 67,250 56,000 siZe oF PiPe (inches) Flow (gpm at 1/2 inch per foot slope)
MaXiMuM allowaBle hoRiZontal PRoJeCteD RooF aReas at vaRious RainFall Rates
(square feet)
1 (in/h) 2 (in/h) 3 (in/h) 4 (in/h) 5 (in/h) 6 (in/h)
3 68 6,576 3,288 2,192 1,644 1,310 1,096
4 156 15,040 7,520 5,010 3,760 3,010 2,500
5 278 26,720 13,360 8,900 6,680 5,320 4,450
6 445 42,800 21,400 14,267 10,700 8,580 7,140
uPC taBle 1101.11
siZing oF RooF DRains, leaDeRs, anD veRtiCal RainwateR PiPing siZe oF PiPe leaDeR oR PiPe (inches) Flow (gpm)
MaXiMuM allowaBle hoRiZontal PRoJeCteD RooF aReas at vaRious RainFall Rates
(square feet) 1
(in/h)
2
(in/h) (in/h)3 (in/h)4 (in/h)5 (in/h)6 (in/h)7 (in/h)8 (in/h)9 (in/h)10 (in/h)11 (in/h)12
2 30 2,880 1,440 960 720 575 480 410 360 320 290 260 240 3 92 8,800 4,400 2,930 2,200 1,760 1,470 1,260 1,100 980 880 800 730 4 192 18,400 9,200 6,130 4,600 3,680 3,070 2,630 2,300 2,045 1,840 1,675 1,530 5 360 34,600 17,300 11,530 8,650 6,920 5,765 4,945 4,325 3,845 3,460 3,145 2,880 6 563 54,000 27,000 17,995 13,500 10,800 9,000 7,715 6,750 6,000 5,400 4,910 4,500 8 1,208 116,000 58,000 38,660 29,000 23,200 19,315 16,570 14,500 12,890 11,600 10,545 9,600 The UPC tables provide a column identifying the flow rate for the pipe. The NSPC also lists the flow rates for each given pipe size. The IPC sizing tables do not list the flow rate for the pipe. However, the flow rate can be derived through calculation. The resulting flow rate would be similar to the UPC.
The flow rates for leaders and vertical drains listed in the NSPC are lower than those in the UPC and IPC since
they are based on a capacity of 7/24 full, as opposed to one-third full in the UPC and IPC. The stack sizing in the
plumbing codes is based on the stack equation. The stack equation for cast iron pipe is: Q = 27.88r5/3d8/3
Where:
Q = capacity, gpm
r = ratio of cross-section area of sheet of water to cross-section area of the stack d = diameter of stack, inches
When calculating the flow rate with a stack capacity of one-third full, the values vary slightly from the values in the UPC and IPC. It is not known when and why the values differed from the calculated values when using the stack equation.
The sizing of the horizontal drains in all of the plumbing codes is based on a calculation using the Manning equation, or Manning expression. The Manning equation is:
V = 1.486 R2/3S1/2 n Where:
V = velocity of flow, feet per second n = coefficient of roughness
R = hydraulic radius, feet
S = hydraulic slope of surface of flow, feet per feet The equation is also written as:
Q = 666.9A R2/3S1/2 n Where:
One of the defining factors when using the Manning equation is the “n” factor, which is the coefficient of roughness. When plumbing codes were first being developed, the “n” factor for piping was assigned a value of 0.015. This is considered fairly rough pipe. As a result, the plumbing codes use a value for sizing horizontal drains of fairly rough pipe.
Studies conducted within the last 50 years have determined that an “n” factor of 0.015 is unrealistic for modern piping materials. The roughest pipe is considered to be cast iron. The “n” factor that is used for cast iron in ASPE’s Plumbing Engineering and Design Handbook of Tables is 0.012. If this factor was applied to the plumbing codes, the flow rate would increase by 25 percent.
The smoothest piping materials are considered to be copper tube, PVC, and ABS. The roughness factor used in the Plumbing Engineering and Design Handbook of Tables for these materials is 0.010. This would increase the flow rate in the plumbing codes by 50 percent.
All of the plumbing codes require a secondary or emergency roof drainage system. A secondary storm drainage system is also required by the ICC International Building Code (IBC). The requirements for a secondary roof drainage system were added to all of the plumbing codes in the 1990s. The change was based on the requirements in ASCE 7, Minimum Design Loads for Buildings and Other Structures. This standard requires roof loads to be based on the maximum amount of ponding on the roof with the primary roof drainage means blocked. If a secondary roof drain is not provided, the loading is based on the height of water to the top of the parapet.
While the plumbing codes added requirements for secondary roof drainage in the 1990s, the building codes have included such requirements since 1949. The 1949 Uniform Building Code required overflows to be installed at each roof drain at the low point.
The UPC allows the primary storm drainage and the secondary storm drainage to be combined into a common vertical downspout or leader. The IPC and NSPC require the secondary storm drainage to be piped separately to a point of disposal that is visible above or at grade. Both the IPC and UPC require the secondary storm drainage system to be sized for a rainfall occurrence of 60-minute duration and a 100-year return period. The NSPC requires the secondary storm drainage system to be sized for a rainfall occurrence of 15-minute duration and a 100-year return period. The result in the NSPC is a secondary storm drainage system that will flow a greater capacity than the primary storm drainage system.
The IBC clearly states that the roof loading must consider the primary roof drainage means blocked and the rise of water above the secondary roof drain to meet the discharge rates. This is the only code requirement that identifies loading based on the discharge rate and rise of water above the drain. However, the plumbing codes do not provide any discharge rates through secondary roof drains. The interpretation of the IBC is that calculations must be performed to determine the rise of water above the base of the drain. The IBC also requires the roof loading to be evaluated for ponding instability.
older Plumbing Codes
The sizing tables in the UPC and IPC can be traced to ASA A40.8-1955, National Plumbing Code. This code specified storm drainage sizing requirements that are the same as those in the current plumbing codes. The tables in ASA A40.8 were slightly different, listing the values for 4 inches of rainfall. Users of the code were directed to divide the values in the table by four and multiply by the local rainfall rate.
other Reference Documents
ASPE Plumbing Engineering Design Handbook, Volume 2: Plumbing Systems addresses storm drainage design. Chapter 4 identifies the engineering design and specification requirements for a storm drainage system. For sizing the systems, Chapter 4 references the sizing requirements in the plumbing codes. While the philosophical
Many other documents regard the testing, design, and installation of siphonic roof drainage systems. However, as previously stated, this project specifically excluded siphonic roof drainage since such research has been completed with sizing methods that address all aspects of the storm drainage system.
Referenced standard
The standard for roof drains is ASME A112.6.4. This is the consensus standard referenced in the plumbing codes. ASME A112.6.4 specifies material requirements and dimensional sizing requirements. It does not include test requirements for establishing the flow rate through the roof drain. Furthermore, it does not include drainage opening requirements.
CSA B79 is the Canadian consensus standard for drains, including roof drains. It is similar to the ASME standard in specifying material and dimension requirements.
RooF DRain testing
The testing of the roof drains was divided into two phases. The first phase of testing was a preliminary set of tests performed at SGS U.S. Testing Company in Tulsa. The second phase was a follow-up, detailed set of tests performed at IAPMO R&T Laboratories in Ontario, California.
Preliminary tests
The preliminary tests conducted at SGS U.S. Testing Company were designed to evaluate whether a problem existed with the sizing of storm drainage systems. The cooperating manufacturers supplied a series of roof drains to be tested. Findings from the preliminary testing were published and presented at the 2010 ASPE Convention in Philadelphia.
The previously published results of the preliminary tests are not listed in this report. The preliminary testing indicated the need to do further testing on the roof drains. The additional testing would require more detailed results. To obtain these results, it was determined that different instrumentation and a different test protocol would be necessary.
testing at iaPMo R&t laboratories
A test protocol was developed for testing that was to be conducted at IAPMO R&T Laboratories. The test protocol was developed by ASPE RF with input from IAPMO R&T Laboratories. The final test protocol approved by the ASPE RF Board of Directors appears in Appendix A.
The test assembly identified in the protocol was constructed at IAPMO R&T Laboratories. Photographs of the test assembly are shown in Appendix B. The photographs show that the test assembly inlet piping was slightly modified from the protocol to reduce wave action in the test box. This was approved prior to the start of testing.
The roof drains were tested with three distinct piping arrangements (see Figure 1). In the first test series, the roof drain was installed without any piping connected to the drain. The intent of this test was to establish a control for the remainder of the testing.
In the second piping arrangement, the roof drain was connected to a straight section of pipe that discharged to the recirculation tank. In the third piping arrangement, the pipe was offset 90 degrees below the roof drain. The horizontal offset length ranged from 4 to 5 feet before turning downward, discharging to the recirculation tank. The third piping arrangement was intended to simulate the most common method of installing the piping connected to the roof drain.
Flow through the drain was measured by the pump flow rate once the roof ponding around the drain achieved steady state. In addition to the flow rate, the velocity of flow in the pipe was measured, as well as the pressure. Prior to the testing of the roof drains, control tests were run without the roof drain in place. These tests were done for each size opening with a straight pipe and an offset piping arrangement.
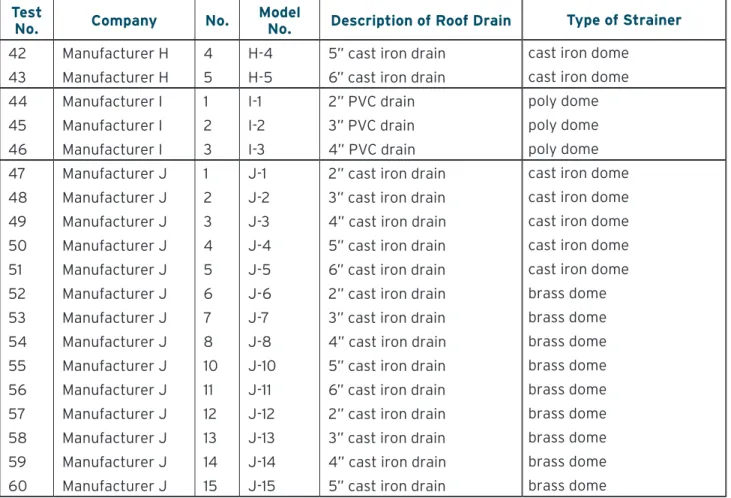
A total of 60 roof drains were tested. The test results do not identify the manufacturer’s name or model number of the drain. Each manufacturer was identified randomly with a letter designation. Each drain model was identified consecutively with the prefix being the manufacturer’s letter designation.
The random order of the roof drains is identified in Table 1. These manufacturer and model identifiers are used throughout the report. Table 1 also lists a description of the roof drain and the type of strainer. While the cooperating manufacturers were previously identified in alphabetical order, the list of manufacturers in Table 1 is not in alphabetical order.
FiguRe 1 Modified Piping Arrangment Straight Piping Arrangment No Piping
taBle 1 RooF DRains testeD By iaPMo R&t laBoRatoRies test
no. Company no. Model no. Description of Roof Drain type of strainer
1 Manufacturer A 1 A-1 2” cast iron drain cast iron dome
2 Manufacturer A 2 A-2 3” cast iron drain cast iron dome
3 Manufacturer A 3 A-3 4” cast iron drain cast iron dome
4 Manufacturer A 4 A-4 5” cast iron drain cast iron dome
5 Manufacturer A 5 A-5 6” cast iron drain cast iron dome
6 Manufacturer B 1 B-1 2” cast iron drain cast iron dome
7 Manufacturer B 2 B-2 3” cast iron drain cast iron dome
8 Manufacturer B 3 B-3 4” cast iron drain cast iron dome
9 Manufacturer B 4 B-4 6” cast iron drain cast iron dome
10 Manufacturer C 1 C-1 2” cast iron drain poly dome
11 Manufacturer C 2 C-2 3” cast iron drain poly dome
12 Manufacturer C 3 C-3 4” cast iron drain poly dome
13 Manufacturer C 4 C-4 5” cast iron drain poly dome
14 Manufacturer C 5 C-5 6” cast iron drain poly dome
15 Manufacturer D 1 D-1 2” cast iron drain aluminum dome
16 Manufacturer D 2 D-2 3” cast iron drain aluminum dome
17 Manufacturer D 3 D-3 4” cast iron drain aluminum dome
18 Manufacturer D 4 D-4 6” cast iron drain aluminum dome
19 Manufacturer E 1 E-1 2” PVC drain poly dome
20 Manufacturer E 2 E-2 4” PVC drain poly dome
21 Manufacturer E 3 E-3 4” PVC drain aluminum dome
22 Manufacturer E 4 E-4 6” PVC drain aluminum dome
23 Manufacturer E 5 E-5 4” cast iron drain poly dome
24 Manufacturer E 6 E-6 6” cast iron drain poly dome
25 Manufacturer E 7 E-7 4” cast iron drain cast iron dome
26 Manufacturer E 8 E-8 6” cast iron drain cast iron dome
27 Manufacturer F 1 F-1 3” cast iron drain cast iron dome
28 Manufacturer F 2 F-2 4” cast iron drain cast iron dome
29 Manufacturer F 3 F-3 5” cast iron drain cast iron dome
30 Manufacturer F 4 F-4 6” cast iron drain cast iron dome
31 Manufacturer F 5 F-5 3” cast iron drain cast iron dome
32 Manufacturer F 6 F-6 4” cast iron drain cast iron dome
33 Manufacturer F 7 F-7 5” cast iron drain cast iron dome
34 Manufacturer F 8 F-8 6” cast iron drain cast iron dome
35 Manufacturer G 1 G-1 2” PVC drain ABS dome
36 Manufacturer G 2 G-2 3” PVC drain ABS dome
37 Manufacturer G 3 G-3 4” PVC drain ABS dome
taBle 1 RooF DRains testeD By iaPMo R&t laBoRatoRies test
no. Company no. Model no. Description of Roof Drain type of strainer
42 Manufacturer H 4 H-4 5” cast iron drain cast iron dome
43 Manufacturer H 5 H-5 6” cast iron drain cast iron dome
44 Manufacturer I 1 I-1 2” PVC drain poly dome
45 Manufacturer I 2 I-2 3” PVC drain poly dome
46 Manufacturer I 3 I-3 4” PVC drain poly dome
47 Manufacturer J 1 J-1 2” cast iron drain cast iron dome
48 Manufacturer J 2 J-2 3” cast iron drain cast iron dome
49 Manufacturer J 3 J-3 4” cast iron drain cast iron dome
50 Manufacturer J 4 J-4 5” cast iron drain cast iron dome
51 Manufacturer J 5 J-5 6” cast iron drain cast iron dome
52 Manufacturer J 6 J-6 2” cast iron drain brass dome
53 Manufacturer J 7 J-7 3” cast iron drain brass dome
54 Manufacturer J 8 J-8 4” cast iron drain brass dome
55 Manufacturer J 10 J-10 5” cast iron drain brass dome
56 Manufacturer J 11 J-11 6” cast iron drain brass dome
57 Manufacturer J 12 J-12 2” cast iron drain brass dome
58 Manufacturer J 13 J-13 3” cast iron drain brass dome
59 Manufacturer J 14 J-14 4” cast iron drain brass dome
60 Manufacturer J 15 J-15 5” cast iron drain brass dome
test Results
The test results for each drain are found in Appendix C. The results listed are the raw data reported by IAPMO R&T Laboratories. This is the information that was provided directly from the laboratory.
A table is provided for each drain listing the flow rate, velocity of flow, and pressure in the piping for each of the three piping arrangements. The values published in the table are an average of three tests performed for each value (run) of testing.
The test protocol required the testing to be conducted at ponding levels ranging from 1 inch to 6 inches in height, measured at the roof drain. The ponding levels were increased in increments of 1 inch. When there was no
measurable flow at 1 inch of ponding, IAPMO R&T Laboratories tested the drain up to 7 inches of ponding. This was done with only a few drains that had little to no flow at 1 inch of ponding.
The first five test results listed in Appendix C are the control tests that do not have a roof drain connected. These five tests were performed only with straight pipe and the offset piping arrangement.
inteRPRetation oF Data
The raw data was analyzed by comparing the results for roof drains of the same size. For certain sizes, the cooperating manufacturer supplied multiple drains. The data for drains of the same size from the same manufacturer were also compared.
The tables and charts prepared for interpreting the data are identified by number. The numbering scheme used for the tables and charts lists the drain size first. The second number is the test piping arrangement. The number 1 indicates no pipe connected to the drain. The number 2 indicates a straight pipe connected to the drain. The number 3 indicates an offset piping arrangement. For example, Table 4-3 is the table of results for 4-inch drains with an offset piping arrangement. Letters are used to distinguish the different charts. The letter “a” always indicates the chart with all of the drains for the given size and piping arrangement. Letters b, c, d, … are used to identify the charts comparing drains of the same size from the same manufacturer.
For the 4-inch roof drains, there are also charts identified as 4-4 with a letter. These charts are a comparison of each drain for the three different piping arrangements. This was done only for 4-inch drains to show the differences in flow for the same drain, depending on the pipe, or lack thereof, connecting to the drain.
A total of 76 tables and charts compare the data from the tests.
Predictions Prior to testing
With all laboratory testing, engineers attempt to predict the general results of the testing prior to conducting the test. The ASPE RF Board of Directors, in preparing the testing protocol, was no different. The Board attempted to predict, in general terms, the results they anticipated.
Some of the assumptions made regarding the test results were as follows:
• The flow through the drain with no pipe connected should have the highest value. • The piping arrangement may not impact the flow through the roof drain.
• The drain may go siphonic during the testing.
• The flow rate should be similar for manufacturers’ drains that look identical. • The high flow rates should pressurize the pipe.
As previously stated, the purpose of testing the roof drain without any piping was to establish a control value to compare the rest of the data. However, the anticipation that the roof drain without any piping would have the highest flow rates turned out to be wrong. In reviewing the data in Appendix C, for most roof drains the flow rate without any piping connected was the lowest flow rate of the three piping arrangements. The reason for this is further discussed in the Engineering Analysis section.
The assumption that the piping arrangement would have little to no impact on the flow rate also proved to be inaccurate by testing. The drains that looked the same from different manufacturers did not have the same flow rates. This was another assumption that proved to be incorrect.
If the roof drain was subjected to a high enough head height, the flow did go siphonic, even though the roof drains were not a siphonic design. However, for most drains tested, a water head height of 6 inches did not result in the flow going siphonic.
The assumption that the system would pressurize the pipe as the flow increased also proved to be incorrect. The higher flow rates lowered the pressure in the piping. This is further discussed in the Engineering Analysis section.
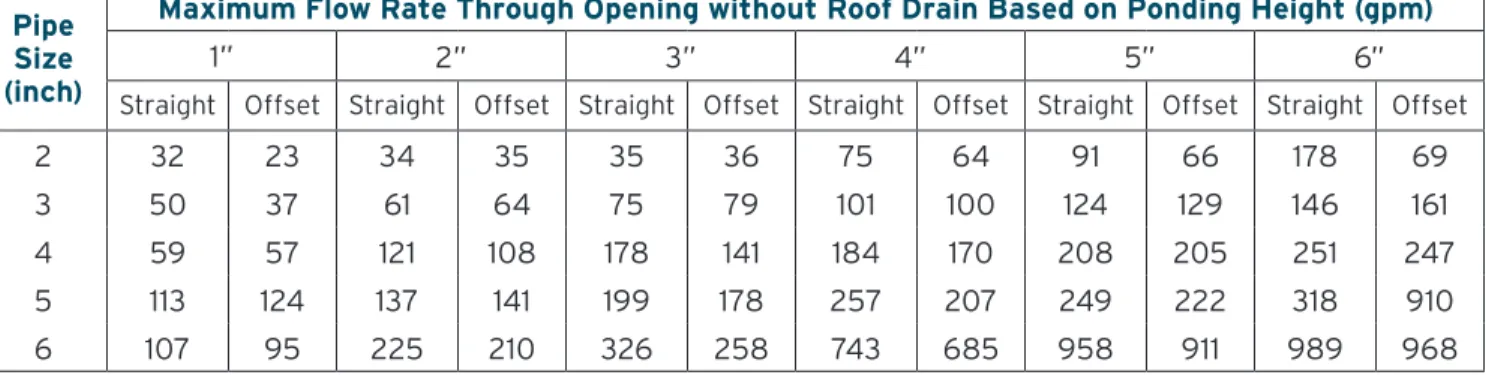
analysis of testing without Roof Drain
The purpose of testing the piping system without a roof drain was to provide a control value to compare the roof drains. If the flow rates through the roof drains were higher than the opening in the roof test assembly, this would indicate that the dome of the roof drain assisted in increasing the flow rate. If the flow rates were lower, it would indicate that the dome configuration hindered flow through the roof drain. Table 2-0 lists the flow rates without a roof drain in place.
taBle 2-0, CoMPaRison Flow Rates without a RooF DRain Pipe
size (inch)
Maximum Flow Rate through opening without Roof Drain Based on Ponding height (gpm)
1” 2” 3” 4” 5” 6”
Straight Offset Straight Offset Straight Offset Straight Offset Straight Offset Straight Offset
2 32 23 34 35 35 36 75 64 91 66 178 69
3 50 37 61 64 75 79 101 100 124 129 146 161
4 59 57 121 108 178 141 184 170 208 205 251 247
5 113 124 137 141 199 178 257 207 249 222 318 910
6 107 95 225 210 326 258 743 685 958 911 989 968
The tests without the roof drain also showed the point where the piping arrangement went from an open channel flow to a siphonic flow. This is identified with the lowering of the pressure measured in the piping and a significant increase in flow rate through the opening.
analysis of no Pipe Connected Roof Drain test
The test results shown in Tables 2-1, 3-1, 4-1, 5-1, and 6-1 as well as the associated charts of the data are of little to no value. While it was anticipated that these flow rates would be the highest and useful as control values, the flow rates were most often the lowest flow rates through the roof drain. These values cannot be used as control numbers.
The other reason these values are of little to no use is because plumbing engineers do not install roof drains without any piping connected. The standard practice in the profession is to install the roof drain and provide a piping connection to the drain on the underside of the roof.
The results of the testing with no pipe connected are reported since the testing was part of the research.
analysis of straight Pipe Compared to Pipe with an offset
One can compare the difference between a roof drain connected to a straight pipe and a roof drain connected to an offset piping arrangement by comparing the X-2 tables to the X-3 tables. For all of the 4-inch drains, charts were prepared showing the difference between the flows for the same roof drain.
For most drains, the flow rate through a straight pipe was very similar to the flow rate through a roof drain with an offset piping arrangement for ponding heights of 3 inches or less. The exception to this is Chart 4-4a on Model A-3. At 3 inches of ponding at the roof drain, the flow in the straight pipe was more than double the flow rate through the offset piping arrangement.
For ponding heights of 4 inches and greater, the flow rate through a straight pipe exceeded the flow rate through an offset piping arrangement. Again, there were some exceptions to this. Chart 4-4e, Chart 4-4h, and Chart 4-4n show a flow slightly greater in the offset piping arrangement than in the straight pipe. This was also the case at 5 inches of ponding for Model E-5 in Chart 4-4g.
There was no consistency in the difference between flow in a straight pipe versus flow in an offset piping
arrangement for ponding 3 inches and greater. For instance, in Chart 4-4a, Model A-3, the flow in the straight pipe is more than double the flow in an offset piping arrangement. By comparison, Chart 4-4n, Model J-3 indicates flow rates that are very similar between the two piping arrangements.
analysis oF 2-inCh RooF DRains with stRaight PiPe
Comparing these two drains at 6 inches of ponding, Model G-1 had a flow rate of 177 gpm and Model B-1 had a flow rate of 202 gpm, a difference of only 14 percent. The difference between the two flow rates at 1 inch of ponding was 600 percent.
Manufacturer J submitted three 2-inch roof drains for testing. The flow rates between the different models were very similar. The greatest difference was between two of the drains at 5 inches of ponding. One drain flowed 32 percent more than the other. Interestingly, these two drains at 4 inches of ponding had basically the same flow rate. taBle 2-1
2” RooF DRain test Results RooF DRain without DRain PiPe
test no. Model no. Description type of strainer Flow Rate (gpm) Based on head height
1” 2” 3” 4” 5” 6” 7”
1 A-1 2” cast iron drain cast iron dome 41 70 64 73 77 82
6 B-1 2” cast iron drain cast iron dome 53 62 64 69 71 72
10 C-1 2” cast iron drain poly dome 13 49 65 73 80 87
15 D-1 2” cast iron drain Aluminum dome 29 48 51 54 75 83
19 E-1 2” PVC drain poly dome * 45 58 78 95 99 103
35 G-1 2” PVC drain ABS dome 18 40 51 70 78 89
39 H-1 2” cast iron drain cast iron dome 13 52 54 65 74 88
44 I-1 2” PVC drain poly dome ** 38 65 75 67 66
47 J-1 2” cast iron drain cast iron dome 22 54 59 75 81 87
52 J-6 2” cast iron drain brass dome 20 49 55 65 73 82
57 J-12 2” cast iron drain brass dome 26 51 56 60 62 63
* No flow
ChaRt 2-1a
2” RooF DRain CoMPaRison oF test Results RooF DRain without DRain PiPe
2” Roof Drain Comparison of Test Results Roof Drain without Drain Pipe
ChaRt 2-1b
2” RooF DRain CoMPaRison oF test Results RooF DRains oF saMe ManuFaCtuReR
taBle 2-2
2” RooF DRain test Results
RooF DRain with stRaight DRain PiPe test
no. Model no. Description type of strainer Flow Rate (gpm) Based on head height
1” 2” 3” 4” 5” 6” 7”
1 A-1 2” cast iron drain cast iron dome 41 141 156 189 198 202
6 B-1 2” cast iron drain cast iron dome 61 110 108 148 189 202
10 C-1 2” cast iron drain poly dome 28 171 177 192 206 208
15 D-1 2” cast iron drain aluminum dome 26 76 87 109 122 165
19 E-1 2” PVC drain poly dome * 52 107 176 181 203 218
35 G-1 2” PVC drain ABS dome 10 91 125 149 162 177
39 H-1 2” cast iron drain cast iron dome 11 75 139 149 191 203
44 I-1 2” PVC drain poly dome * 36 102 126 161 183 177
47 J-1 2” cast iron drain cast iron dome 19 94 113 122 131 192
52 J-6 2” cast iron drain brass dome 21 98 116 141 165 204
57 J-12 2” cast iron drain brass dome 21 86 119 125 173 206
* Flow too low for sensors to record ChaRt 2-2a
2” RooF DRain CoMPaRison oF test Results RooF DRain with stRaight DRain PiPe
ChaRt 2-2b
2” RooF DRain CoMPaRison oF test Results RooF DRains oF saMe ManuFaCtuReR
analysis oF 2-inCh RooF DRains with oFFset PiPing
The highest flow rate and lowest flow rate for 2-inch roof drains connected to an offset piping arrangement were the same two drains at 1 inch of ponding, Models G-1 and B-1. The flow rate through Model B-1 was almost six times greater than Model G-1 with 1 inch of ponding. At 6 inches of ponding, Models G-1 and B-1 had similar flow rates. Once the ponding reached 2 inches, the flow rates were closer with these two drains.
Chart 2-3a shows the wide variation in flow rates for the roof drains. Some roof drains discharged almost twice as much as other roof drains with the same ponding of water.
Chart 2-3b shows that the three roof drains from the same manufacturer had similar flow rates. Each drain had flows in the upper end for 2-inch roof drains.
taBle 2-3
2” RooF DRain test Results
RooF DRain with oFFset DRain PiPe test
no. Model no. Description type of strainer Flow Rate (gpm) Based on head height
1” 2” 3” 4” 5” 6” 7”
1 A-1 2” cast iron drain cast iron dome 37 125 149 151 155 157
6 B-1 2” cast iron drain cast iron dome 59 87 85 111 134 145
10 C-1 2” cast iron drain poly dome 23 134 136 140 146 148
15 D-1 2” cast iron drain aluminum dome 28 78 85 107 119 155
19 E-1 2” PVC drain poly dome * 46 119 140 157 161 158
35 G-1 2” PVC drain ABS dome 11 88 111 120 126 140
39 H-1 2” cast iron drain cast iron dome 11 79 103 114 121 139
44 I-1 2” PVC drain poly dome * 46 68 83 78 92 96
47 J-1 2” cast iron drain cast iron dome 18 88 86 116 114 143
52 J-6 2” cast iron drain brass dome 26 95 98 109 131 144
57 J-12 2” cast iron drain brass dome 28 82 80 122 133 135
ChaRt 2-3a
2” RooF DRain CoMPaRison oF test Results RooF DRain with oFFset DRain PiPe
ChaRt 2-3b
2” RooF DRain CoMPaRison oF test Results RooF DRains oF saMe ManuFaCtuReR
analysis oF 3-inCh RooF DRains with stRaight PiPe
With the larger 3-inch roof drains, there is a great difference in the flow rates between the different manufacturers’ roof drains. With 1 inch of ponding, the lowest flow rate was 13 gpm through Model I-2. This is a PVC drain with a poly dome.
The greatest flow rate at 1 inch of ponding was Model F-1, flowing 105 gpm. Model F-1 is a cast iron drain with a cast iron dome. The Model F-1 flow rate is more than eight times more than the flow rate of Model I-2. With 4 and 5 inches of ponding, the Model I-2 flow rate exceeded the Model F-1 flow rate.
At 6 inches of ponding, the lowest flow rate was 429 gpm for two models. The highest flow rate was 522 gpm for three different models. The greater difference was at 5 inches of ponding. The lowest flow rate was 186 gpm, while
the highest flow rate was 490 gpm, more than 2-1/2 times the lowest flow rate.
Two charts show the same manufacturer’s drains of the same size. The two models from Manufacturer F did not have similar flow rates. Model F-1’s flows at 1 inch, 2 inches, and 6 inches of ponding exceed the flow rates of Model F-5, while Model F-5 had greater flows at 3 inches through 5 inches of ponding.
Manufacturer J has three 3-inch roof drains. Models J-2, J-7, and J-13 were similar at 1 and 2 inches of ponding. The flow rates between the drains varied significantly for the other ponding levels of 3 through 5 inches. At 6 inches of ponding, the flow rates were similar.
taBle 3-1
3” RooF DRain test Results RooF DRain without DRain PiPe
test
no. Model no. Description type of strainer Flow Rate (gpm) Based on head height
1” 2” 3” 4” 5” 6”
2 A-2 3” cast iron drain cast iron dome 13 101 108 114 126 151
7 B-2 3” cast iron drain cast iron dome 48 106 126 144 149 165
11 C-2 3” cast iron drain poly dome 18 122 151 161 178 187
16 D-2 3” cast iron drain aluminum dome 46 99 132 162 164 210
27 F-1 3” cast iron drain cast iron dome 120 168 225 212 244 313
31 F-5 3” cast iron drain cast iron dome 39 89 94 108 114 123
36 G-2 3” PVC drain ABS dome 9 94 126 144 166 187
40 H-2 3” cast iron drain cast iron dome 18 90 101 172 178 300
45 I-2 3” PVC drain poly dome 12 93 147 233 292 340
48 J-2 3” cast iron drain cast iron dome 29 55 124 152 165 172
53 J-7 3” cast iron drain brass dome 42 118 190 200 221 236
ChaRt 3-1a
3” RooF DRain CoMPaRison oF test Results RooF DRain without DRain PiPe
ChaRt 3-1b
3” RooF DRain CoMPaRison oF test Results RooF DRains oF saMe ManuFaCtuReR
ChaRt 3-1c
3” RooF DRain CoMPaRison oF test Results RooF DRains oF saMe ManuFaCtuReR
RooF DRain without DRain PiPe
taBle 3-2
3” RooF DRain test Results
RooF DRain with stRaight DRain PiPe test
no. Model no. Description type of strainer Flow Rate (gpm) Based on head height
1” 2” 3” 4” 5” 6”
2 A-2 3” cast iron drain cast iron dome 41 135 405 414 418 429
7 B-2 3” cast iron drain cast iron dome 58 152 202 414 448 467
11 C-2 3” cast iron drain poly dome 27 181 415 468 485 495
16 D-2 3” cast iron drain aluminum dome 25 101 149 171 490 522
27 F-1 3” cast iron drain cast iron dome 105 220 137 157 261 522
31 F-5 3” cast iron drain cast iron dome 47 133 266 398 411 429
36 G-2 3” PVC drain ABS dome 16 95 140 195 475 500
40 H-2 3” cast iron drain cast iron dome 16 91 208 226 239 498
45 I-2 3” PVC drain poly dome 13 50 119 188 379 474
48 J-2 3” cast iron drain cast iron dome 32 65 388 462 485 493
53 J-7 3” cast iron drain brass dome 38 114 179 249 453 487
ChaRt 3-2a
3” RooF DRain CoMPaRison oF test Results RooF DRain with stRaight DRain PiPe
ChaRt 3-2b
3” RooF DRain CoMPaRison oF test Results RooF DRains oF saMe ManuFaCtuReR
ChaRt 3-2c
3” RooF DRain CoMPaRison oF test Results RooF DRains oF saMe ManuFaCtuReR
analysis oF 3-inCh RooF DRains with oFFset PiPing
The great difference in the flow rates between the different manufacturers’ roof drains continues with 3-inch roof drains connected to an offset piping arrangement. With 1 inch of ponding, the lowest flow rate was 14 gpm through Model I-2. This is a higher value, by 1 gpm, than the drain flow through straight pipe.
The greatest flow rate at 1 inch of ponding was Model F-1, flowing 118 gpm. That is more than eight times the flow rate of Model I-2. Models F-1 and I-2 did not have similar flows until the ponding reached 5 inches.
Even with 6 inches of ponding, there was a significant difference between the highest flow rate and the lowest flow rate. Model J-2 had a flow of only 195 gpm, while Model F-1 had a flow rate of 423 gpm. That amounts to more than 217 percent greater flow through Model F-1 compared to Model J-2.
Two charts show the same manufacturer’s drains of the same size. The two drains from Manufacturer F had similar flow rates. Although there were slight differences, the differences were not consistent. Model F-1 flows were higher at 1 inch, 2 inches, and 6 inches of ponding, while Model F-5 had greater flows at 3 inches through 5 inches of ponding.
Chart 3-3c compares the three roof drains from Manufacturer J. Models J-2 and J-13 were similar through 5 inches of ponding. At 6 inches of ponding, Model J-13 had a significantly higher flow rate than Model J-2, 195 gpm versus 358 gpm.
taBle 3-3
3” RooF DRain test Results
RooF DRain with oFFset DRain PiPe test
no. Model no. Description type of strainer Flow Rate (gpm) Based on head height
1” 2” 3” 4” 5” 6”
2 A-2 3” cast iron drain cast iron dome 49 155 318 333 340 350
7 B-2 3” cast iron drain cast iron dome 52 161 174 262 371 402
11 C-2 3” cast iron drain poly dome 18 185 351 347 363 371
16 D-2 3” cast iron drain aluminum dome 55 106 146 167 337 402
27 F-1 3” cast iron drain cast iron dome 118 154 221 261 287 423
31 F-5 3” cast iron drain cast iron dome 49 136 271 293 330 327
36 G-2 3” PVC drain ABS dome 22 102 205 260 384 409
40 H-2 3” cast iron drain cast iron dome 20 104 231 262 332 410
45 I-2 3” PVC drain poly dome 14 49 118 215 298 399
48 J-2 3” cast iron drain cast iron dome 29 77 147 152 176 195
53 J-7 3” cast iron drain brass dome 41 126 187 200 215 408
ChaRt 3-3a
3” RooF DRain CoMPaRison oF test Results RooF DRain with oFFset DRain PiPe
ChaRt 3-3b
3” RooF DRain CoMPaRison oF test Results RooF DRains oF saMe ManuFaCtuReR
ChaRt 3-3c
3” RooF DRain CoMPaRison oF test Results RooF DRains oF saMe ManuFaCtuReR
analysis oF 4-inCh RooF DRains with stRaight PiPe
The difference in flow rates continued for 4-inch roof drains. With 1 inch of ponding, the lowest flow rate was 16 gpm for two drains, Models E-5 and I-3. Model E-5 is a cast iron drain with a poly dome, and Model I-3 is a PVC drain with a poly dome.
The highest flow rate at 1 inch of ponding was Model F-2 with 117 gpm. Model F-2 is a cast iron drain with a cast iron dome.
Model E-5 has lower flow rates than most of the drains through 5 inches of ponding. At 6 inches of ponding, the flow rate more than triples from 5 inches of ponding.
Model I-3 had similar lower flow rates through 4 inches of ponding. At 5 inches of ponding, the flow rate more than doubled the flow rate at 4 inches. Similarly, at 6 inches of ponding, the flow rate more than doubled again from 5 inches of ponding.
At 6 inches of ponding, the greatest flow rate was 889 gpm though Model C-3. The lowest flow rate was 628 gpm though Model J-3.
Three manufacturers submitted multiple 4-inch roof drains. One roof drain from Manufacturer E had a flow rate of 657 gpm with 5 inches of ponding, while another one of its drains had a flow rate of only 215 gpm. This is the greatest difference in flow rates for a single manufacturer with the same size drains.
taBle 4-1
4” RooF DRain test Results RooF DRain without DRain PiPe
test
no. Model no. Description type of strainer Flow Rate (gpm) Based on head height
1” 2” 3” 4” 5” 6”
3 A-3 4” cast iron drain cast iron dome 48 129 166 177 184 191
8 B-3 4” cast iron drain cast iron dome 72 198 275 240 304 348
12 C-3 4” cast iron drain poly dome 38 197 292 323 350 383
17 D-3 4” cast iron drain aluminum dome 58 140 215 226 305 355
20 E-2 4” PVC drain poly dome 58 113 166 210 270 302
21 E-3 4” PVC drain aluminum dome 26 90 189 230 242 257
23 E-5 4” cast iron drain poly dome 17 76 162 180 215 296
25 E-7 4” cast iron drain cast iron dome 72 180 253 225 295 360
28 F-2 4” cast iron drain cast iron dome 83 155 240 306 334 367
32 F-6 4” cast iron drain cast iron dome 43 150 130 190 229 248
37 G-3 4” PVC drain ABS dome 16 118 247 265 289 314
41 H-3 4” cast iron drain cast iron dome 16 102 245 239 281 300
46 I -3 4” PVC drain poly dome 12 93 147 233 292 340
49 J-3 4” cast iron drain cast iron dome 17 78 179 172 255 301
54 J-8 4” cast iron drain brass dome 67 130 210 217 299 271
ChaRt 4-1a
4” RooF DRain CoMPaRison oF test Results RooF DRain without DRain PiPe
ChaRt 4-1b
4” RooF DRain CoMPaRison oF test Results RooF DRains oF saMe ManuFaCtuReR
ChaRt 4-1c
4” RooF DRain CoMPaRison oF test Results RooF DRains oF saMe ManuFaCtuReR
RooF DRain without DRain PiPe
ChaRt 4-1d
4” RooF DRain CoMPaRison oF test Results RooF DRains oF saMe ManuFaCtuReR
taBle 4-2
4” RooF DRain test Results
RooF DRain with stRaight DRain PiPe test
no. Model no. Description type of strainer Flow Rate (gpm) Based on head height
1” 2” 3” 4” 5” 6”
3 A-3 4” cast iron drain cast iron dome 41 172 538 585 612 673
8 B-3 4” cast iron drain cast iron dome 68 184 242 608 768 790
12 C-3 4” cast iron drain poly dome 40 217 442 754 865 889
17 D-3 4” cast iron drain aluminum dome 46 147 205 341 610 710
20 E-2 4” PVC drain poly dome 61 101 170 200 498 830
21 E-3 4” PVC drain aluminum dome 34 100 184 280 472 703
23 E-5 4” cast iron drain poly dome 16 117 185 188 215 692
25 E-7 4” cast iron drain cast iron dome 56 190 275 301 657 856
28 F-2 4” cast iron drain cast iron dome 117 187 254 312 497 671
32 F-6 4” cast iron drain cast iron dome 45 152 317 545 680 773
37 G-3 4” PVC drain ABS dome 24 103 258 480 745 847
41 H-3 4” cast iron drain cast iron dome 50 110 234 468 642 813
46 I -3 4” PVC drain poly dome 16 92 142 180 434 835
49 J-3 4” cast iron drain cast iron dome 19 69 169 206 478 628
54 J-8 4” cast iron drain brass dome 69 130 221 370 547 860
ChaRt 4-2a
4” RooF DRain CoMPaRison oF test Results RooF DRain with stRaight DRain PiPe
ChaRt 4-2b
4” RooF DRain CoMPaRison oF test Results RooF DRains oF saMe ManuFaCtuReR
ChaRt 4-2c
4” RooF DRain CoMPaRison oF test Results RooF DRains oF saMe ManuFaCtuReR
RooF DRain with stRaight DRain PiPe
ChaRt 4-2d
4” RooF DRain CoMPaRison oF test Results RooF DRains oF saMe ManuFaCtuReR
analysis oF 4-inCh RooF DRains with oFFset PiPing
Model F-2 remained the highest and Model I-3 remained the lowest flow rate when connected to an offset piping arrangement with 1 inch of ponding. The lowest flow rate was 14 gpm, and the highest was 118 gpm.
The flow rate trend lines were similar to the straight pipe connection for the 4-inch roof drains connected to an offset piping arrangement. However, the flow rates were lower.
The lowest flow rate with 6 inches of ponding was 423 gpm for Model E-5. The highest flow rate was 710 gpm for Model B-3.
taBle 4-3
4” RooF DRain test Results
RooF DRain with oFFset DRain PiPe test
no. Model no. Description type of strainer Flow Rate (gpm) Based on head height
1” 2” 3” 4” 5” 6”
3 A-3 4” cast iron drain cast iron dome 49 134 225 250 262 285
8 B-3 4” cast iron drain cast iron dome 67 195 296 587 668 710
12 C-3 4” cast iron drain poly dome 45 203 445 615 625 645
17 D-3 4” cast iron drain aluminum dome 52 144 196 225 556 655
20 E-2 4” PVC drain poly dome 51 70 142 250 445 640
21 E-3 4” PVC drain aluminum dome 44 125 186 276 434 606
23 E-5 4” cast iron drain poly dome 47 110 168 172 362 423
25 E-7 4” cast iron drain cast iron dome 80 210 235 332 618 665
28 F-2 4” cast iron drain cast iron dome 118 166 239 286 470 558
32 F-6 4” cast iron drain cast iron dome 78 142 285 503 545 611
37 G-3 4” PVC drain ABS dome 22 113 253 460 598 567
41 H-3 4” cast iron drain cast iron dome 46 111 234 456 640 682
46 I -3 4” PVC drain poly dome 14 59 125 190 422 622
49 J-3 4” cast iron drain cast iron dome 21 81 163 244 472 564
54 J-8 4” cast iron drain brass dome 35 158 217 284 491 562
ChaRt 4-3a
4” RooF DRain CoMPaRison oF test Results RooF DRain with oFFset DRain PiPe
ChaRt 4-3b
4” RooF DRain CoMPaRison oF test Results RooF DRains oF saMe ManuFaCtuReR
ChaRt 4-3c
4” RooF DRain CoMPaRison oF test Results RooF DRains oF saMe ManuFaCtuReR
RooF DRain with oFFset DRain PiPe
ChaRt 4-3d
4” RooF DRain CoMPaRison oF test Results RooF DRains oF saMe ManuFaCtuReR
analysis oF PeRFoRManCe oF inDiviDual 4-inCh RooF DRains
As previously stated, a chart (identified as 4-4 with a letter) compares the flow rates of the three piping
arrangements for each 4-inch roof drain. Since the flow rates for the roof drain with no piping connected provided no useful information, the trend line for this flow rate can be ignored on these charts. The two trend lines that need to be compared are the trend line for a roof drain connected to a straight pipe and a roof drain connected to an offset piping arrangement.
With lower ponding heights, the difference in flow rate between a straight pipe and an offset piping arrangement is not significant. As the ponding increases, the flow in the straight pipe is greater than the offset piping arrangement. This tends to occur at 4 inches or greater of ponding. However, there are exceptions with certain roof drains.
ChaRt 4-4a
4” RooF DRain MoDel a-3 CoMPaRison oF test Results
ChaRt 4-4b
4” RooF DRain MoDel B-3 CoMPaRison oF test Results
ChaRt 4-4c
4” RooF DRain MoDel C-3 CoMPaRison oF test Results
ChaRt 4-4d
4” RooF DRain MoDel D-3 CoMPaRison oF test Results
ChaRt 4-4e
4” RooF DRain MoDel e-2 CoMPaRison oF test Results
ChaRt 4-4f
4” RooF DRain MoDel e-3 CoMPaRison oF test Results
ChaRt 4-4g
4” RooF DRain MoDel e-5 CoMPaRison oF test Results
ChaRt 4-4h
4” RooF DRain MoDel e-7 CoMPaRison oF test Results
ChaRt 4-4i
4” RooF DRain MoDel F-2 CoMPaRison oF test Results
ChaRt 4-4j
4” RooF DRain MoDel F-6 CoMPaRison oF test Results
ChaRt 4-4k
4” RooF DRain MoDel g-3 CoMPaRison oF test Results
ChaRt 4-4l
4” RooF DRain MoDel h-3 CoMPaRison oF test Results
ChaRt 4-4m
4” RooF DRain MoDel i-3 CoMPaRison oF test Results
ChaRt 4-4n
4” RooF DRain MoDel J-3 CoMPaRison oF test Results
ChaRt 4-4o
4” RooF DRain MoDel J-8 CoMPaRison oF test Results
ChaRt 4-4p
4” RooF DRain MoDel J-14 CoMPaRison oF test Results
analysis oF 5-inCh RooF DRains with stRaight PiPe
The fewest number of roof drains for testing were 5 inches in size—only eight roof drains from five manufacturers. The 5-inch roof drains with the lowest and highest flow rates at 1 inch of ponding were from the same manufacturer, Manufacturer J. Model J-10 had the lowest flow rate at 97 gpm, while Model J-4 had the highest flow rate at 162 gpm. Model J-4 is a cast iron drain with a cast iron dome. Model J-10 is a cast iron drain with a brass dome. With 6 inches of ponding, the highest flow rate was 1,267 gpm through Model C-4. The lowest flow rate was Model J-4 at 651 gpm. At 1 inch of ponding, Model J-4 had the highest flow rate. At 6 inches of ponding, it had the lowest flow rate.
The comparison between the Manufacturer J models is shown in Chart 5-3b. The trend lines in this chart appear similar to the trend lines for Manufacturer J’s 4-inch roof drains.
taBle 5-1
5” RooF DRain test Results RooF DRain without DRain PiPe
test
no. Model no. Description type of strainer Flow Rate (gpm) Based on head height
1” 2” 3” 4” 5” 6”
4 A-4 5” cast iron drain cast iron dome 107 243 405 435 427 470
13 C-4 5” cast iron drain poly dome 108 185 335 368 357 387
29 F-3 5” cast iron drain cast iron dome 93 174 394 476 568 588
33 F-7 5” cast iron drain cast iron dome 127 169 299 320 332 347
42 H-4 5” cast iron drain cast iron dome 160 155 340 365 458 494
50 J-4 5” cast iron drain cast iron dome 78 108 168 307 388 469
55 J-10 5” cast iron drain brass dome 116 195 273 369 460 492
ChaRt 5-1a
5” RooF DRain CoMPaRison oF test Results RooF DRain without DRain PiPe
ChaRt 5-1b
5” RooF DRain CoMPaRison oF test Results RooF DRains oF saMe ManuFaCtuReR
taBle 5-2
5” RooF DRain test Results
RooF DRain with stRaight DRain PiPe test
no. Model no. Description type of strainer Flow Rate (gpm) Based on head height
1” 2” 3” 4” 5” 6” 4 A-4 5” cast iron drain cast iron dome 109 220 617 1,203 1,125 1,042
13 C-4 5” cast iron drain poly dome 118 199 402 745 1,060 1,267
29 F-3 5” cast iron drain cast iron dome 134 204 392 476 642 848
33 F-7 5” cast iron drain cast iron dome 119 149 333 556 756 982
42 H-4 5” cast iron drain cast iron dome 128 184 264 484 716 1,016
50 J-4 5” cast iron drain cast iron dome 162 222 322 408 575 651
55 J-10 5” cast iron drain brass dome 97 152 236 371 646 1,012
60 J-15 5” cast iron drain brass dome 112 171 229 257 787 866
ChaRt 5-2a
5” RooF DRain CoMPaRison oF test Results RooF DRain with stRaight DRain PiPe
ChaRt 5-2b
5” RooF DRain CoMPaRison oF test Results RooF DRains oF saMe ManuFaCtuReR
analysis oF 5-inCh RooF DRains with oFFset PiPing
The lowest flow rate with 1 inch of ponding and an offset piping arrangement was Model F-3 with a flow rate of 25 gpm. This is significantly less than the flow in the same drain with straight pipe. That flow rate was 134 gpm. Model F-3 is a cast iron drain with a cast iron dome.
The highest flow rate at 1 inch of ponding was Model F-7 with 148 gpm. This is another case where the same manufacturer has the highest and lowest flow rate for two different models.
With 6 inches of ponding, J-4 remains the lowest flow rate with 618 gpm. The highest flow rate was still Model C-4 with 973 gpm.
The comparison of Manufacturer J’s roof drains shows similar trend lines to the straight piping flow rates. taBle 5-3
5” RooF DRain test Results
RooF DRain with oFFset DRain PiPe test
no. Model no. Description type of strainer Flow Rate (gpm) Based on head height
1” 2” 3” 4” 5” 6”
4 A-4 5” cast iron drain cast iron dome 133 258 641 867 834 850
13 C-4 5” cast iron drain poly dome 117 219 432 755 947 973
29 F-3 5” cast iron drain cast iron dome 25 216 383 467 642 808
33 F-7 5” cast iron drain cast iron dome 148 181 346 528 769 915
42 H-4 5” cast iron drain cast iron dome 40 125 270 447 675 874
50 J-4 5” cast iron drain cast iron dome 138 187 256 367 514 618
55 J-10 5” cast iron drain brass dome 95 161 238 362 553 874
ChaRt 5-3a
5” RooF DRain CoMPaRison oF test Results RooF DRain with oFFset DRain PiPe
ChaRt 5-3b
5” RooF DRain CoMPaRison oF test Results RooF DRains oF saMe ManuFaCtuReR