August 23, 2013
Via Email
Original via Mail
Canadian Office and Professional Employees Union Local 378 c/o Jim Quail, Barrister & Solicitor
2nd Floor, 4595 Canada Way Burnaby, B.C.
V5G 1J9
Attention: Mr. Jim Quail
Dear Mr. Quail
Re: FortisBC Energy Inc. (FEI)
Application for Approval of a Multi-Year Performance Based Ratemaking Plan for 2014 through 2018
Response to the Canadian Office and Professional Employees Union Local 378 (COPE) Information Request (IR) No. 1
On June 10, 2013, FEI filed the Application as referenced above. In accordance with Commission Order G-99-13 setting out the Preliminary Regulatory Timetable for the review of the Application, FEI respectfully submits the response to COPE IR No. 1.
If further information is required, please contact the undersigned.
Sincerely, FORTISBCENERGY INC. Original signed: Diane Roy Attachments cc: Commission Secretary
Regulatory Affairs Correspondence Email: gas.regulatory.affairs@fortisbc.com
1. TOPIC: CUSTOMER CHOICE PROGRAM 1
Reference: Customer Service 2
Exhibit B-1, Section C-3, Heading 3.5.1 DESCRIPTION OF 3
CUSTOMER SERVICE DEPARTMENT 4
FEI states at page 143 that “The department also oversees mass market customer 5
communications regarding accounts and billing, administers the Customer Choice 6
program, performs market research and analysis . . . . “ 7
And reference: Energy Supply and Resource Development 8
Exhibit B-1, Section C-3, Heading 3.7.1 GAS SUPPLY 9
10
FEI states at pages 162-3 that “Also included is the management of the movement of 11
gas supply provided by natural gas marketers to customers under the Customer Choice 12
program, which began in 2004.” 13
Note: These appear to be the only references to the Customer Choice program in this 14
Application. 15
Request: 16
1.1 Please file the FEI Customer Choice Program 2012 Annual Report. 17
18
Response: 19
The Customer Choice Program 2012 Annual Report is provided in Attachment 1.1. 20
21 22
23
1.2 Please file an updated version of Figures 2-3 and 2-4 of the 2012 Annual Report 24
25
Response: 26
Updated Figure 2-3: Customer Participation 2010 to 2013 (to July)
1
2
3
Updated Figure 2-4: Comparison of Monthly Gross Enrollments - 2011 to 2013 (to July)
4
5
6 7
8
1.3 Please provide a chart showing the total gross cost to FortisBC Energy Inc. and 9
its predecessor in the establishment and operation of the Customer Choice 10 111,062 101,459 54,948 47,502 17,015 13,329 9,903 8155
2010
2011
2012
2013
Residential Commercial 2010 Total: 128077 2011 Total: 114,788 2012 Total: 64,851 2013 Total: 55,657 200 236 900 362 471 783 451 424 1141 313 372 521 427 735 1050 931 1250 1688 2014 2287 2709 1068 1148 718 1124 1180 1227 1450 1340 1215 1306January February March April May June July August September October November December
the total gross cost of utility staff and contractors applied to the establishment 1
and operation of the program. 2
3
Response: 4
The Customer Choice Program launched on November 1 2007 through the Residential 5
Unbundling CPCN approved by Decision Order C-6-06 in 2006. As such, the timeframe of this 6
analysis begins in 2006 onwards. 7
The requested information is provided below, along with the related recoveries as requested in 8
COPE IR 1.1.5. 9
1 $1,000,000 $2,000,000 $3,000,000 $4,000,000 $5,000,000 $6,000,000 $7,000,000 $8,000,000 $9,000,000 $10,000,000 2006 2007 2008 2009 2010 2011 2012
Total Start-Up Cost $2,049,673 $9,009,998 $4,096,469 $- $- $-
$-Total Operating Cost $500,547 $971,734 $1,182,625 $1,228,884 $820,916 $980,733
The Customer Choice Program has matured and stabilized over the years and the declining 1
trend in operating costs since 2010 reflects this. With Program rules and systems stable today, 2
there will be minimal incremental costs associated with administering the program. Refer to 3
section 2.8 of the 2012 Customer Choice Annual Report filed in COPE IR 1.1.1 for a more 4
detailed discussion of 2012 Program expenditures and recoveries. 5
6 7
8
1.4 Please provide a chart showing the total gross cost per participant in the program 9
each year since its inception. 10
11
Response: 12
FEI does not believe a chart showing the total gross cost per participant in the program each 13
year since its inception is meaningful for evaluation. The Customer Choice Program was 14
initiated by BC legislation aimed at introducing competition in the supply of natural gas for the 15
purposes of providing choice to customers over their supply of natural gas. As such, the costs 16
associated with the program’s inception were borne by all customers eligible to participate in 17
Customer Choice. Moreover, program operating costs are to be recuperated from program fees 18
charged to Gas Marketers operating in the Program. For a detailed discussion of 2012 Program 19
costs and recoveries, see the 2012 Customer Choice Annual Report filed in response to COPE 20 IR 1.1.1. 21 22 23 24
1.5 Please provide a chart showing the total recoveries related directly to offsetting 25
the cost of the program from program-participating marketers and customers 26
each year since its inception. 27
28
Response: 29
Please refer to the response to COPE IR 1.1.3. 30
2. TOPIC: PENSION AND OPEB COSTS 1
Reference: 2014-2018 FORECAST O&M OVERVIEW 2
Exhibit B-1, Section C-3, Heading 3.3.3.4.2 BENEFIT INFLATION 3
Request: 4
2.1 Please file the most recent actuarial estimates provided by the Company’s 5
actuaries, referenced at page 128 lines 3-4 6
7
Response: 8
Attachment 2.1 is being filed confidentially as it contains information which, if disclosed publicly 9
or to representatives of FEI’s bargaining units, will impact FEI in future negotiations. Please 10
refer to CONFIDENTIAL Attachment 2.1 for the most recent actuarial estimates provided by 11
Towers Watson and Morneau Shepell. 12
3. TOPIC: PENSION AND OPEB COSTS – VARIANCE DEFERRAL 1
Reference: Exhibit B-1, Section C-3, Heading 3.3.3.4.2 BENEFIT INFLATION 2
FEI states at page 128 that “For 2013, the actuarial estimate that was recently 3
completed is more than 70 percent higher than the actuarial estimate that was done in 4
2011 to support the 2012-2013 RRA forecasts and approved amounts. The difference 5
between these two amounts is captured in a deferral account in 2013 for recovery from 6
customers in future rates.” 7
Request: 8
3.1 Please explain the underlying material reason(s) for this difference: i.e., what 9
changed, or alternatively, to what extent was the previous estimate flawed or 10 erroneous? 11 12 Response: 13
As outlined in response to CEC IR 1.46.1, many of the assumptions that are used in estimating 14
the pension and other post-employment benefits expenses are beyond FEI’s control. Between 15
2011 and today, the biggest driver of the change in the net benefit expense is a lower discount 16
rate today versus when the estimates were prepared in 2011. The discount rate is set in 17
relation to Corporate AA bonds in Canada, at a point in time, for a term which approximates the 18
expected term of the pension plan. As a result of market conditions in the Canadian bond 19
market, the interest rate is significantly lower in 2013 compared to the comparable interest rate 20
in 2011. 21
4. TOPIC: PENSION AND OPEB COSTS – VARIANCE DEFERRAL 1
Reference: Exhibit B-1, Section D-4, Heading 4.2.4 Pension and OPEB Variance 2
FEI states at page 294 that “The EARSL amortization period more appropriately 3
allocates the costs over the future period to which they are applicable. In its most recent 4
accounting valuation done at December 31, 2012, the EARSL for the defined benefit 5
pension plans is 10 years and the EARSL for OPEBs is 15 years.” 6
Request: 7
4.1 Please explain the difference between in the “Expected Average Remaining 8
Service Life” as between the pension plan and Other Post Employment Benefits. 9
10
Response: 11
The expected average remaining service lifetime (EARSL) for the pension plans is a weighted 12
average of the EARSLs over all pension plans, including both open plans (i.e., plans where 13
employees are still earning benefits) and closed plans (i.e., plans that are closed to new 14
entrants). The open pension plans have EARSLs similar to the EARSL of the other post-15
employment benefits (OPEBs), but the closed pension plans have significantly lower EARSLs 16
as the employees who are members of these plans are closer to retirement. Therefore, the 17
weighted average of the EARSLs for the pension plans is lower than the EARSL for the OPEBs. 18 19 20 21 Reference: General 22 Exhibit B-1 23 Request: 24
4.2 Please provide the total impact on shareholder cost, if the Application is 25
approved in its entirety, of FEI’s proposals with respect to: 26
27
(a) the capitalization of Pension and OPEB costs; and 28
29
(b) (Reference section C3 section 3.3.3.4.2 Table C3-4) the deferral and 30
amortization of the shortfall between the 2013 Approved and Base 31
Pension & OPEB Expense. 32
Showing both the total impact and the net change for shareholders compared 1 with 2013. 2 3 Response: 4
For item (a), FEI has interpreted the question as referring to the $930 thousand adjustment to 5
the 2013 Base for the accounting change to recognize the retiree portion of pensions and 6
OPEBs as capital as opposed to O&M. In terms of shareholder return from this change, the 7
aggregate shareholder return associated with the delay in the timing of recovery of the expense 8
from ratepayers over the five-year PBR period from including this amount in 2013 base capital 9
for formula purposes is approximately $399 thousand, ranging from $16 thousand in 2014 to 10
$143 thousand in 2018. The capitalization of the retiree portion of pension and OPEBs is 11
supported by US GAAP guidance discussed in the response to BCUC IR 1.165.1. 12
For item (b), the $12.607 million variance between the 2013 Approved and 2013 Base O&M 13
expense will all be recorded in the Pension and OPEB Variance deferral account as shown in 14
Schedule 47, Line 22, Column 4 of the financial schedules included in Appendix E of the July 15
16th Evidentiary Update. However, this treatment is the currently approved treatment and FEI 16
has not proposed to change this treatment in this Application. Additionally, Table C3-4 only uses 17
this amount to derive the 2013 Base pension & OPEB expense which has no shareholder return 18
associated with it. 19
5. TOPIC: EMPLOYEE BENEFITS 1
Reference: 2014-2018 FORECAST O&M OVERVIEW 2
Exhibit B-1, Section C-3, Heading 3.3.3.4.2 BENEFIT INFLATION 3
Request: 4
5.1 Please provide a table showing the net annual cost per full-time employee of 5
insured benefits provided to bargaining unit employees in the two years prior to 6
and two years following the implementation of the flexible benefits plan 7
8
Response: 9
The net annual cost per full-time employee of insured benefits provided to bargaining unit 10
employees in the two years prior to and two years following the implementation of the flexible 11
benefits plan is shown in Table 5.1 below. The flexible benefits plan was effective January 1, 12
2011. 13
Table 5.1: Net Annual Cost of Insured Benefits Per Full-time Bargaining Unit Employee
14
2009 2010 2011 2012
COPE $5,219.65 $4,774.20 $4,611.28 $4,584.13
IBEW $4,892.17 $4,708.53 $4,495.24 $4,824.17
15
The costs reflected in Table 5.1 above include coverage for the following benefits: group life, 16
long-term disability, Medical Services Plan, extended health and dental. 17
FEI has been able to provide a flexible benefits plan that holds a higher value to employees 18
without incurring higher costs. Employees are able to tailor the benefits plan to suit their 19
personal needs and modify coverage over time as their needs change. 20
COPE Customer Service employees have a traditional benefits plan. They are not part of the 21
flexible benefits plan, and have not been included in the table above. 22
6. TOPIC: PERFORMANCE INDICATORS 1
Reference: Exhibit B-1-1, Appendix C2, Heading 4.4 EMPLOYEE KEY 2
PERFORMANCE INDICATORS 3
Following Table C2-4 at page 6, FEI states: “The FEU do not incorporate employee 4
KPI’s in its scorecard. Instead, employee KPI’s are monitored at a departmental level, 5
supported by HR and vary by area depending on business need.” 6
Request: 7
6.1 Why do the FEU not incorporate employee KPI’s in its scorecard, where those 8
indicators are potentially amendable to quantification (e.g., workplace diversity, 9
turn-over, recruitment, etc.)? 10
11
Response: 12
As outlined in the response to BCUC IR 1.191.1, in determining the scorecard categories and 13
measures to use, the Company seeks not only to select the appropriate success measures but 14
also the optimal number of measures (i.e. how many). At this time, FEI believes the six 15
scorecard measures used best represent the overall priorities for Company. 16
As employee KPIs vary by area depending on business need, employee KPIs are more 17
appropriately monitored at a departmental level. 18
19 20
21
6.2 What means are employed by FEI to determine “employee engagement” as a 22 KPI? 23 24 Response: 25
Employee Engagement represents employees’ commitment to their jobs and motivation to 26
contribute to the achievement of the company’s goals and values. FEI believes making sure 27
employees are engaged is important to fostering a productivity focused and customer service 28
culture where employees are encouraged to be as efficient and effective as possible. 29
Presently, FEI does not formally measure employee engagement in the company using an 30
overall KPI. Instead, measuring and promoting employee engagement is performed at the 31
departmental level, recognizing the needs may vary depending upon the requirements of the 32
1 2
3
6.3 Please provide a summary of FEI’s most recent analysis of each of the KPI’s 4 listed in Table C2-4. 5 6 Response: 7
As set out in the Application, Table C2-4 of Appendix C2 and the discussion that follows Table 8
C2-4, FEI monitors employee KPIs at the department level, supported by HR. 9
The KPIs listed in Table C2-4 are: 10
1. Leadership effectiveness 11
2. Succession readiness 12
3. Workforce planning effectiveness 13 4. Employee engagement 14 5. Workplace diversity 15 6. Turnover 16 7. Recruitment 17
8. Building a culture of continuous improvement. 18
19
Summaries of FEI’s most recent analysis of these KPI’s (where such analysis is available) are 20
included below: 21
1. Leadership effectiveness is reviewed individually, against employees’ annual 22
performance plans at each year-end. Analysis of leadership effectiveness is specific to 23
an individual leader; a summary is not provided. 24
2. Succession readiness is reviewed on a case-by-case basis, as employees are 25
considered for future development opportunities. Succession readiness is specific to an 26
individual employee; a summary is not provided. 27
3. The effectiveness of FEI’s workforce planning initiatives was most recently described 28
and assessed in FEU’s Five-Year Retirement Management and Workforce Plan (2012-29
2017) filed August 1, 2012 in compliance with the 2012-2013 RRA Decision and Order 30
4. Employee engagement is not measured on a regular basis, but is encouraged through 1
FEI’s performance-based culture, and its continuing focus on internal development and 2
hiring from within. No summary is available. 3
5. Workplace diversity is not measured. No summary is available. 4
6. Turnover and recruitment are reviewed monthly. Please refer to the responses to BCUC 5
IRs 1.79.4.1 and 1.80.5 for information regarding turnover rates in recent years. 6
A summary of recruitment information for 2013 to July 13, 2013 is included in Table 6.3 7
below. 8
Table 6.3: Recruitment Information to July 13, 2013
9
No. of Postings Filled Internally Filled Externally Cancelled Open
325 155 84 33 53
10
7. Building a culture of continuous improvement has been, and continues to be, a focus, 11
with emphasis being placed on employee annual performance plans, and their link to the 12
short-term incentive program for M&E employees. As noted above, annual performance 13
plans are analyzed at each year-end. Because they are specific to the individual, no 14
summary is provided. 15
16
FEI reviews the appropriateness of its current measures regularly and will make the necessary 17
adjustments as required. 18
7. TOPIC: PBR – IMPACT OF SERVICE QUALITY INDICATORS 1
Reference: Exhibit B-3 and Exhibit B-1 Section A Table A1-1 2
Request: 3
7.1 Confirm that the only mechanism in the operation of the proposed PBR where a 4
degradation in Service Quality indicators would come into play would be to 5
trigger the “Off Ramp”. 6
7
Response: 8
The Commission and interveners will have the opportunity to review FEI’s SQI results during the 9
Annual Reviews and Mid-term Review. In the case of a sustained and significant degradation of 10
SQI results, the Commission’s recourse would be to explore with FEI potential means of 11
rectifying the issue, or if the issues cannot be rectified then the Commission could trigger the 12
off-ramp provision for the complete overview of the PBR plan elements or its possible 13
termination. In determining whether to trigger the off-ramp provision, the Commission should 14
consider whether or not the source of the possible degradation is under the control of FEI’s 15
management. 16
Please also refer to the response to the CEC IR 1.52.1. 17
18 19
20
7.2 Confirm that the “Off Ramp” mechanism consists of the premature termination of 21
the PBR regime by the intervention of the Commission. 22
23
Response: 24
Yes. Please refer to the response to COPE IR 1.7.1. 25
26 27
28
7.3 Please provide a chart showing every instance in which an “Off Ramp” has been 29
activated by a regulator of any utility in Canada operating under a PBR regime, 30
and indicating the reason for the invocation of the Off Ramp by the regulator. 31
Response: 1
Among the PBR plans presented in Appendix D-1 of the Application, Union Gas’ 2008-2012 2
PBR plan was the only utility for which the off-ramp provision was activated. In the Union Gas 3
case, the earned ROE in the first year of the plan exceeded the allowed ROE by more than 330 4
basis points which triggered the off-ramp and ultimately led to changes in some elements of the 5
Union Gas plan. For more information about these changes, please refer to page 22 of 6
Appendix D-1 of the Application. 7
8
9
Reference: Exhibit B-1. Section B5: Jurisdictional Comparison 10
Page 40, Table B5-1, footnote 12 11
Request: 12
7.4 Please confirm that under the OEB 4th Generation IR (Electricity), SQIs form part 13
of the mechanism to determine rate setting, and please describe how they are 14
applied in this context. 15
16
Response: 17
The OEB’s report established four distinct areas of performance that it expects distributors to 18
achieve. These performance areas are: customer focus, operational effectiveness, public policy 19
effectiveness and financial performance. The OEB also concluded that a scorecard shall be 20
used to monitor individual distributor performance and to compare performance across the 21
distribution sector. Distributors will be required to report their progress against the scorecard on 22
an annual basis. 23
The Board engaged stakeholders in further consultation on the standards and measures to be 24
included in the distributor scorecard. On July 4, 2013, the Staff Report to the Board on 25
Performance Measurement and Continuous Improvement for Electricity Distributors was 26
released. The Staff’s proposed scorecard design includes similar elements to FEI’s SQIs and 27
balanced scorecard. However no decision has been made yet as to the exact form and design 28
of the scorecard or its connection with the rate setting by the OEB. 29
Reference: Exhibit B-1. Section B5: Jurisdictional Comparison 1 Page 41, Table B5-1 2 Request: 3
7.5 Please confirm that in the Gaz Metro 2007-2012 PBR, SQIs were linked to 4
financial incentives to the utility, and please describe how they were linked. 5
6
Response: 7
As indicated in Table B5-1 of the Application, the SQIs in Gaz Metro’s 2007-2012 plan were 8
linked to financial incentives. According to Gaz Metro’s settlement, Gaz Metro’s claim of the 9
performance incentive as dependent on its ability to meet the selected Service Quality Metrics 10
agreed to in the Settlement. A higher achievement equaled a higher claim of the performance 11
incentive as described in the table below: 12
13
Overall attainment percentage Percentage of performance incentive awarded
0% to 84% 0%
85% + corresponding percentage
14
The overall attainment percentage was calculated based on the weighted average of results 15
achieved for individual service quality indicators. The attainment percentage for individual SQIs 16
was calculated based on the following formula1: 17
18
Where 19
B = Resulting percentage for indicator (maximum 100%) 20
R = Percentage achieved for indicator 21
C = Percentage target result for indicator, i.e. 85%, for all indicators except one which was 75% 22
23
In addition, to ensure Gaz Metro did not neglect service quality when in a shortfall situation, it 24
agreed to reimburse customers between $100,000 (for seven SQIs) and $200,000 (for two 25
SQIs) for each of the SQIs for which a minimum 85% score is not attained. 26
1
1 2
Reference: Exhibit B-1. Section B5: Jurisdictional Comparison 3
Page 42, para. 1 4
Request: 5
7.6 Please describe the indirect reward or penalty mechanism, or other nexus 6
between SQIs and the setting of rates, rewards or penalties in Alberta and 7 Ontario. 8 9 Response: 10
The Alberta Utilities Commission’s (AUC) Decision 2012-237 rejected the use of any PBR 11
specific reward or penalty mechanism. However the AUC’s Rule 002 and 003 are used to 12
monitor the utilities’ service quality indicators performance. In addition, the AUC indicated that 13
Alberta’s Gas and Electric Utilities Acts provide the Commission with the legislative authority to 14
take necessary actions when the Commission is of the opinion that a utility has failed to comply 15
with its rules respecting service standards. The AUC also started a consultative process for a review
16
of Rule 002. For more detailed information regarding this process, please refer to the response to BCPSO
17
IR 1.26.2.
18
Enbridge Gas Distribution Inc. (EGD) and Union Gas were also subject to service quality 19
requirements according to the OEB’s “Gas Distribution Access Rule” which was approved by 20
the Board before the approval of incentive rate-setting plans in a separate proceeding. The 21
OEB’s consultant report titled “Assessment of Union Gas Ltd. and Enbridge Gas Distribution 22
Inc. Incentive Regulation Plans” explained the SQIs monitoring process: 23
“The Board monitors information the Companies provide each year on their performance 24
on the selected indicators, and if Staff believes there are service problems the Board can 25
investigate the issues, request more in-depth explanations from Company managers, or 26
work co-operatively with the Company to develop an action plan to become compliant 27
with a requirement. However, there are no monetary penalties (or rewards) tied 28
specifically to EGD’s or Union’s measured performance on the selected service quality 29
metrics relative to their standards”. 30
Reference: Exhibit B-1, Section B6: FEI 2014 Proposed PBR 1
Section 6.7, Off-ramp Provision 2
Heading 6.7.2.2, Non-Financial Triggers 3
FEI states at page 78: “Triggering the off-ramp provision would be warranted only if 4
there is sustained serious degradation of the SQIs.” 5
Request: 6
7.7 What in FEI’s view would constitute “sustained serious degradation of the SQIs”? 7
8
Response: 9
Please refer to the response to the CEC IR 1.52.1. 10
11 12
13
7.8 Please describe all of the mechanisms under the proposed PBR by which the 14
Commission can enforce the maintenance of satisfactory performance, as 15
measured by the SQIs, short of invoking the “Off Ramp”. With respect to the 16
process in the proposed mid-term assessment review, please describe all 17
mechanisms available to the Commission following a negative review, short of 18
the “Off Ramp”. 19
20
Response: 21
As outlined in the Application (Exhibit B-1), Section B6.8 Annual Review, the Commission and 22
interveners will have the opportunity to review and comment on the SQI results during the 23
annual review process. In the case of a failure of a specific SQI result, FEI will provide the 24
necessary reasoning and explanations and will work co-operatively with the Commission and 25
stakeholders to ensure compliance with requirements. 26
With respect to the mid-term assessment review process outlined in the Application (Exhibit B-27
1), Section B6.7.1 Mid-Term Assessment Review, the proposed review will be held as part of 28
the third Annual Review. If at this time a material change to service quality is raised, 29
stakeholders will work to identify a change than can address that element and put it forward to 30
the Commission. FEI will work co-operatively to ensure compliance with requirements. 31
8. TOPIC: ENERGY EFFICIENCY AND CONSERVATION/DEMAND SIDE 1
MANAGEMENT 2
Reference: Exhibit B-1-1, Appendix I, 2.2 Consistency with British Columbia 3
Energy Objectives, Table I-1 4
Request: 5
8.1 FEU has stated that its EEC proposals are “designed to implement all cost-6
effective (as defined by the Demand Side Measures Regulation) demand-side 7
measures.” Is it FEU’s position that it has availed itself of all possible avenues to 8
develop and/or continue cost effective EEC programs for the entire proposed 9
PBR period? If no, why not? 10
11
Response: 12
No, the word “all” in the referenced statement was incorrectly included in the Application. Please 13
refer to the responses to BCUC IR 1.224 series for a discussion on how the Companies arrived 14
at the funding level for which approval is requested. 15
Reference: Exhibit B-1-1, Appendix I, 2.3 Consistency with Long Term Plan 1
Attachment I-1, Exhibit 4 - Expenditures for Each of the Program 2
Areas and the Total EEC Portfolio 3
Request: 4
8.2 If FEU plans to implement all possible cost effective EEC programs for the 5
proposed PBR period at a cost per year ranging from $34.4M to $35.9M, please 6
explain how is this consistent with the much larger EEC request of $64.5M per 7
year (the post NGV Incentives Decision amended figure) presented in the last 8
Revenue Requirement Application? (Is it FEU’s position that programs that were 9
cost effective at that time are not any longer?) 10
11
Response: 12
The $64.5 million to which the question refers to is the Companies’ funding request 13
incorporating $10 million for a Furnace Early Replacement program, $4 million for a Solar 14
Thermal program, and $10 million for a program to support Thermal Energy upgrades for 15
schools. These were proposed as “New Initiatives” for which program design and development 16
had not been undertaken at the time the 2012-2013 RRA was completed. Of these “New 17
Initiatives”, the requests for $4 million for Solar Thermal and $10 million for Thermal Energy 18
upgrades for schools were not approved by the Commission, and the request for $10 million for 19
the Furnace Early Replacement program was approved at a reduced level of $2 million. This 20
effectively reduced the funding envelope under consideration by the Commission to $42.5 21
million. The amount the Commission ultimately approved in the 2012-2013 RRA proceeding 22
(Order G-44-12), approximately $35.5 million, is consistent with the funding requested for the 23
PBR period. 24
Reference: Exhibit B-1-1, Appendix I, 2.4.2 Adequacy Pursuant to the DSM 1
Regulation – Rental Accommodations 2
Request: 3
8.3 Section 3(b) of the DSM Regulation requires that a public utility’s plan portfolio 4
include demand side measures intended specifically to improve the energy 5
efficiency of rental accommodations. Has FEU sought or received any input from 6
government regarding the Utility’s position that this requirement is satisfied due 7
to the fact that, “[a]ll programs in the Residential Energy Efficiency Program Area 8
are available to rental properties?” 9
10
Response: 11
It is not the Companies’ position that: 12
“…this requirement is satisfied due to the fact that, “[a]ll programs in the Residential 13
Energy Efficiency Program Area are available to rental properties?"” 14
As indicated in the question, Residential programs support demand side measures which are 15
available to rental accommodations. Note also that a number of the Commercial and Low 16
Income programs support demand side measures which are available to rental 17
accommodations. Additionally the Companies provide support for demand side measures 18
intended specifically to improve the energy efficiency of rental accommodations. Please refer to 19
the response to BCSEA IR 1.15.1. 20
Reference: Exhibit B-1, 4.2.6 Energy Efficiency and Conservation (EEC) - 1
Decrease to EEC Funding 2
Request: 3
8.4 There were three factors FEI stated limited EEC activity for the period leading up 4
to the last Revenue Requirement: Human Resources Issues, Economic Factors, 5
and Low Commodity Cost with Human Resources Issues cited as the key limiting 6
factor of the three. In this Application, the Utility cites the ongoing impacts of our 7
economy and low commodity prices as the reason for a reduced ask. Given that 8
neither of these were key factors in portfolio activity levels in the past, please 9
outline in greater detail their effect on the program as a whole. 10
11
Response: 12
The Companies are making the assumption that the Information Request above is referencing 13
page 16 of Appendix I to the Application (Exhibit B-1-1), where the FEU state: 14
“The financial treatment of EEC expenditures approved in the 2012-2013 RRA Decision 15
was designed to mitigate Commission and Stakeholder concerns regarding actual 16
expenditures coming in below approved levels, as was the case in the early years of our 17
programs. Under the approved treatment, $15 million of expenditures are placed into 18
rates in each of 2012 and 2013, and the difference between the $15 million and actual 19
expenditure levels up to the approved amount placed into rates at the end of the test 20
period, when the actual amounts are known. As discussed later in the document, given 21
that factors beyond the FEU’s control, such as the economy and cost of gas, continue to 22
impact the level of EEC expenditures that will be possible in any given year, the 23
Companies are proposing to continue this accounting treatment over the PBR period.” 24
[Emphasis added] 25
26
For clarity, the reference above deals with the continued appropriateness of the financial 27
treatment for EEC expenditures, where $15 million annually is placed into rates and the 28
difference between the $15 million and actual expenditures in a given year is recovered in rates 29
in the years following, rather than the impact of the economy and low commodity prices on the 30
magnitude of the funding ask. The Companies are requesting a stable level of funding, in line 31
with what has been approved previously, rather than a reduced level of funding as the IR states. 32
The FEU cannot predict what the economy or commodity prices will do over the PBR period, 33
which is why the currently-approved financial treatment continues to be appropriate as the 34
excerpt above states. 35
1
8.5 Does the Utility expect our economy to continue at current levels or commodity 2
prices to remain flat for the proposed five year PBR period? If not, please 3
explain why the proposed increases to the EEC spending remain so low for the 4
duration of this PBR scheme. 5
6
Response: 7
FEI has requested approval of an EEC funding envelope of $34.4 million in 2014 and increasing 8
up to $39.0 million in 2018 which is an average increase of more than 3% per year for that four 9
year interval. If the full amount of the spending envelope of $34.4 million is spent for 2014, this 10
will reflect an increase of 66% from the 2012 EEC spending of $20.7 million. FEI has been 11
expanding its EEC programs and spending since 2009 and does not expect the spending 12
growth rate experienced in the last four years to continue. Thus, while only modest EEC 13
spending growth is forecast during the PBR period, the annual spending amounts are at high 14
levels compared to the last four years of program growth. 15
16 17
18
8.6 In the last Revenue Requirement, FEI submitted that the development of more 19
programs and initiatives would lead to greater customer participation in the 20
Utility’s EEC programs. Given that position, please explain why the Utility has 21
opted not to present a Revenue Requirement or DSM plan with a wider range of 22
EEC programs to incent greater GHG reductions and economic opportunities 23
within British Columbia? 24
25
Response: 26
Please refer to the responses to COPE IRs 1.8.1 and 1.8.2. The FEU also note that the Energy 27
Efficiency and Conservation Advisory Group indicated that there were no major course 28
corrections needed to the proposed 2014-2018 EEC Plan during the conference call held with 29
the group to review the plan May 1, 2013, so key stakeholders believed that the Plan and 30
associated level of funding was appropriate. 31
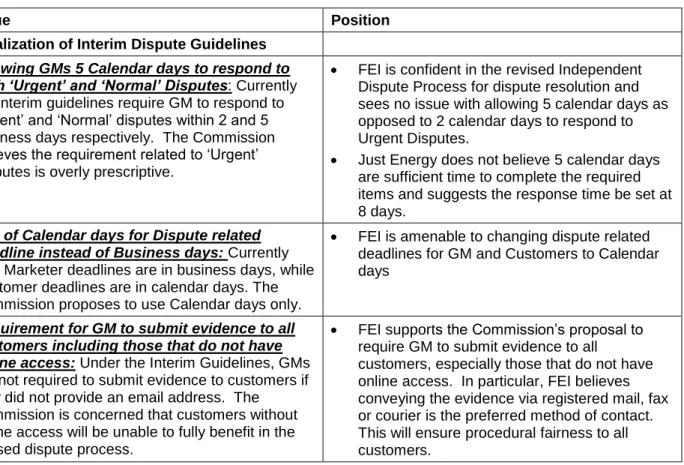
June 28, 2013
Via Email
Original via Mail
British Columbia Utilities Commission 6th Floor, 900 Howe Street
Vancouver, BC V6Z 2N3
Attention: Ms. Erica M. Hamilton, Commission Secretary
Dear Ms. Hamilton:
Re: FortisBC Energy Inc. (FEI)
Customer Choice Program 2012 Annual Report
Attached is the FEI 2012 Annual Report on the Customer Choice Program.
If further information is required, please contact Howard Mak, Customer Programs Manager, at 778-571-3273.
Sincerely,
FORTISBCENERGY INC.
Original signed by: Ilva Bevacqua
For: Diane Roy
Attachments
cc (email only): BCPSO
Licensed Gas Marketers
Fax: (604) 576-7074
Email: diane.roy@fortisbc.com
www.fortisbc.com
Regulatory Affairs Correspondence Email: gas.regulatory.affairs@fortisbc.com
F
ORTIS
BC
E
NERGY
I
NC
.
2012 Annual Report for the
Customer Choice Program
Table of Contents
1.
INTRODUCTION ... 1
2.
PROGRAM OVERVIEW & STATISTICS ... 2
2.1 Program Participation Statistics ... 2 Gas Marketer Participation ... 2 2.1.1
Customer Participation ... 4 2.1.2
2.2 Enrolment Statistics ... 5 2.3 Dispute Statistics ... 7 2.4 2012 Customer Education Plan ... 8 2.5 System Enhancements ...10 2.6 System Process Modification & Reports ...13 2.7 System Related Issues in 2012 ...15 2.8 2012 Program Expenditures, Recoveries and Fee Structure ...16 2.9 Proposed Chang in Receipt Point Allocation Percentages in 2013 ...19 2.10Summary ...20
3.
INDEPENDENT DISPUTE PROCESS ... 22
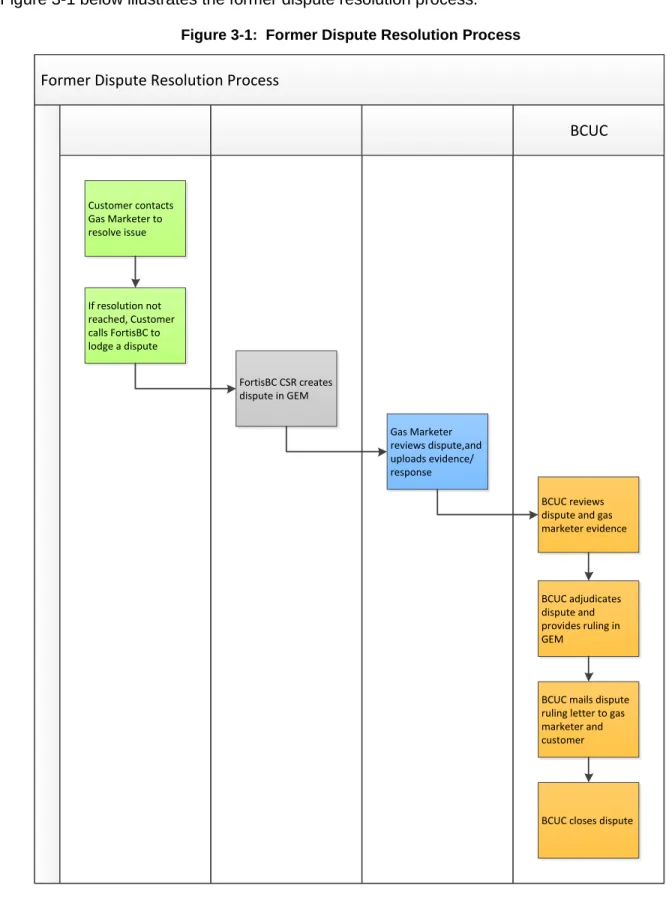
3.1 Introduction ...22 3.2 Former Dispute Resolution Process ...23 3.3 New Dispute Process ...24 Revised Process and Enhancements ...24 3.3.1
3.4 Summary ...28
4.
2012 CUSTOMER CHOICE ANNUAL GENERAL MEETING ... 29
4.1 Background ...29 4.2 2012 General Meeting ...29 4.3 2012 General Meeting Items ...30 4.4 Decision A-10-12 ...32 Eighth Revision of the Code of Conduct ...32 4.4.1
Prospect for Transportation Option for Rate Schedule 4 Customers...33 4.4.2
4.5 Summary ...33
5.
OTHER INTERESTED PARTIES’ TOPICS ... 35
Dispute Process ...36 5.1.2
Rules for Gas Marketers ...37 5.1.3
5.2 Summitt Energy Discussion Topics ...38 Automated TPV Calls ...38 5.2.1
5.3 BCPSO Discussion Topics ...39 Request for General Meeting for 2013 ...39 5.3.1
5.4 Summary ...43
Table 2-1: List of Gas Marketers ... 3 Table 2-2: System Enhancement from Decision Order A-9-11 ...10 Table 2-3: Changes to the ED_a Transaction Status File ...14 Table 2-4: Customer Choice Table of Charges ...18 Table 5-1: Summary of Issues and Positions ...43
Figure 2-1: Fixed Contract Statistics in 2012 ... 4 Figure 2-2: 2012 Residential and Commercial Customer Participation ... 4 Figure 2-3: Yearly Comparison of Customer Choice Participation (2010 to 2012) ... 5 Figure 2-4: Comparison of Monthly Gross Enrollments – 2011 vs. 2012 ... 6 Figure 2-5: Comparison of Yearly Enrollment Activity (2010 – 2012) ... 6 Figure 2-6: 2012 Monthly Dispute Statistics ... 7 Figure 2-7: Comparison of Yearly Dispute Activity from 2010 to 2012 ... 8 Figure 2-8: Confirmation Letter Enhancement ...11 Figure 2-9: Customer Choice Program Costs and Recoveries- 2010 to 2012...17 Figure 3-1: Former Dispute Resolution Process ...23 Figure 3-2: Revised Dispute Resolution Process ...25 Figure 5-1: Comparison of Monthly Gross Enrollments – 2011 vs. 2012 ...40 Figure 5-2: Comparison of Yearly Enrollment Activity (2010 – 2012) ...41 Figure 5-3: Comparison of Yearly Dispute Activity from 2010 to 2012 ...42 Figure 5-4: Comparison of 2007 Average 5 Yr Rate vs. FEI Variable Rate ...42
On July 6, 2012 the British Columbia Utilities Commission (BCUC or the Commission) issued 2
Decision Order A-10-12. In the decision, the Commission scaled back the regulatory process 3
for the Customer Choice Program (the Program) to reflect the following steps: 4
1. Commission staff will canvass the Gas Marketers and other interested parties on an annual 5
basis about issues they would like to have addressed; 6
2. FEI will publish a Customer Choice Annual Report that will include program updates and 7
statistics as well as address issues brought forth by other parties; and 8
3. The Commission will decide if a meeting is required to address any of the issues in the 9
Annual Report. 10
This filing is FortisBC Energy Inc.‟s (FEI) first Annual Report under the revised regulatory 11
process that summarizes the Customer Choice Program‟s trends and statistics in 2012, the 12
2012 Annual General Meeting and Decision Order A-10-12 and all items raised by interested 13
parties. The annual report is organized as follows: 14
Section 1: Introduction 15
16
Section 2: Program Overview – This section provides an overview and statistics of 17
Customer Choice in 2012 related to program participation, enrolment and dispute activity 18
and program costs. This section also reviews the customer education plan and the 19
system changes that were implemented in 2012. 20
21
Section 3: Independent Dispute Process – This section provides an overview of the 22
revised dispute resolution process implemented in 2012. 23
24
Section 4: 2012 Customer Choice General Meeting and Decision A-10-12 – This 25
section summarises the topics and discussion held at the 2012 General Meeting, as well 26
as the resulting Decision Order A-10-12. 27
28
Section 5: Other Interested Parties’ Items – This section addresses the topics of 29
discussion raised by other interested parties. Topics addressed include items brought 30
forth by the Commission, BCSPO and Summitt Energy. 31
32
Section 6: Conclusion / Next Steps – This section summarizes the annual report. 33
This section provides an overview of the Customer Choice Program in 2012 and is organized as 2
follows: 3
Section 2.1 describes the Program participation and statistics of both Gas Marketers 4
and customers and includes a year to year comparison of customer participation from 5
2011 to 2012 6
Section 2.2 provides an overview of Gas Marketer sales activity and statistics in 2012 7
and includes both a month-to-month comparison of enrolment activity between 2011 and 8
2012 and a year to year comparison of total enrolments from 2012 to 2013 9
Section 2.3 reviews the dispute activity and statistics in 2012 for cancellation and 10
standard disputes 11
Section 2.4 provides an overview of the Customer Education Plan undertaken in 2012, 12
including a description of its individual components and the overall communication 13
strategy 14
Section 2.5 reviews the system enhances undertaken in 2012 15
Section 2.6 reviews the system process modifications & 2012 16
Section 2.7 reviews the system related issues in 2012 17
Section 2.8 reviews the 2012 Program expenditures, Recoveries and Fee structures 18
Section 2.9 describes the proposed change in receipt point allocation percentages in 19
2013 20
Section 2.10 provides a summary of the section 21
2.1
P
ROGRAMP
ARTICIPATIONS
TATISTICS22
Gas Marketer Participation
2.1.1
23
In 2012, there were 13 Gas Marketers licensed to operate in BC. Of the 13 licensed Gas 24
Marketers, 10 offered fixed contracts to both FEI Rate Schedule 1 residential and FEI Rate 25
Schedule 2Rate Schedule 2 and 3 commercial customers, and 3 Gas Marketers offered fixed 26
contracts to FEI Rate Schedule 2 and 3 commercial customers only. Table 2-1 below lists the 27
Gas Marketers operating in BC, their sales activity status and their customer sales market in 28
2012. Also Included in the table are Gas Marketers who had been involved in the Customer 29
Choice Program since 2007 but are no longer active. 30
Gas Marketer Status Residential and Commercial Gas Marketers
1 Access Gas Services Inc. Owns Planet Energy contracts. 2 Active Renewable Marketing Ltd
3 Direct Energy Marketing Ltd Combined DEBS and DEML in April 2010
4 Firefly Energy Owned by AG Energy.
5 Just Energy (formerly Energy Savings BC) Changed name to Just Energy in 2009. 6 MX Energy (Canada) Ltd
7 Planet Energy (New) Re-entered the market in February 2010. 8 Smart Energy (BC) Ltd
9 Summitt Energy BC L.P.
10 Superior Energy Management Gas L.P.
Commercial Only Gas Marketers
1 Bluestream Energy 2 Connect Energy
3 Premstar Energy – ECNG Owned by Alta Gas.
Past Gas Marketers
1 CEG Energy Options Purchased by Energy Savings BC in 2008 2 Intra Energy Withdrew from Program 2007
3 Nexen Marketing Sold customers to Access Gas and withdrew 4 Planet Energy Sold customers to Access Gas in April 2008 and
withdrew
5 Tahoe Energy Withdrew from Program June 2007
6 Universal Energy Purchased by Just Energy effective July 1, 2009 7 Wholesale Energy Group Ltd Purchased by Universal Energy in 2008
2
Fixed-Contract Statistics 3
In 2012, there were 387 open marketer groups available for customer contract enrolments. 4
Prices per GJ ranged from a low of $2.64/GJ to a high of $11.99/GJ. The most common 5
contract term signed during 2012 was for a five year contract accounting for 48 percent of 6
enrolments. The price range for a five year contract term was a low of $3.89/GJ to a high of 7
$9.79/ GJ. Over 10,000 enrolments or 80 percent of contracts signed in 2012 were in the $4/GJ 8
to $8/GJ range. Figure 3-1 below illustrates the fixed contract statistics for 2012. 9
2
Customer Participation
2.1.2
3
Customer participation in 2012 dropped from 2011. November 1, 2012 marked the 5-year 4
anniversary of the Customer Choice Residential Program launched in 2007. On November 1, 5
2012, 45,879 customers returned to FEI for their natural gas supply, the majority of which were 6
residential customers. 7
Figure 2-2 below illustrates the residential and commercial Customer Choice participation rate 8
for 2012. 9
Figure 2-2: 2012 Residential and Commercial Customer Participation
10
11
As of December 31, 2012 there were approximately 835,000 FEI Rate Schedules 1, 2 and 3 12
customers eligible for the Customer Choice Program. As Figure 2-2 illustrates, there were 13
approximately 758,000 eligible residential customers and approximately 76,000 eligible 14
commercial customers for the Customer Choice Program. 15
Of the approximate 758,000 eligible residential customers, about 55,000 billed customers were 16
enrolled in Customer Choice. This represents approximately 7 percent of the total customer 17
base of eligible residential customers participating in Customer Choice. 18
Open Price Points • 387
Price Range per Enrollment Term •1 Year - $2.64 to $11.99 •2 Year - $3.11 to $10.49 •3 Year - $3.77 to $10.99 •4 Year - $3.80 to $9.88 •5 Year - $3.89 to $9.79 Percentage of Total
Enrollments per Term •1 Year - 14.2% •2 Year - 0 .6% •3 Year - 24.7% •4 Year - 12.8% •5 Year - 47.7% Number of Enrollments by Contract Price Range • Under $4 - 2316 - 18% •$4-$6 - 6525 - 50% •$6 -$8 - 3975 - 30% •$8-$10 - 214 - 2% •$10+ - 15 - 0.1% 54,948 9,903 Total Eligible 758,460 Total Eligible 76,659 100,000 200,000 300,000 400,000 500,000 600,000 700,000 800,000
Rate 1 Residential Customers Rate 2 & 3 Commercial Customers Number of
in Customer Choice. This represents approximately 13 percent of the total customer base of 2
eligible commercial customers participating in Customer Choice. 3
Figure 2-3 below illustrates the year-to-year comparison of both residential and commercial 4
Customer Choice participation from 2010 to 2012. 5
Figure 2-3: Yearly Comparison of Customer Choice Participation (2010 to 2012)
6
7
As Figure 2-3 indicates, Customer Choice participation levels have declined in the past three 8
years for both residential and commercial customers. Factors attributing to the decline include, 9
but are not limited to, historically low natural gas prices, customer account closures, decrease in 10
contract renewals, and continued dispute cancellation drops. 11
Participation rates for residential customers declined by 9 percent in 2011 from 2010 and then 12
46 percent in 2012 from 2011. This decline in 2012 can largely be attributed to the return of 13
45,879 customers to FEI on November 1, 2012. Participation rates for commercial customers 14
declined by 22 percent in 2011 from 2010 and 26 percent in 2012 from 2011. 15
2.2
E
NROLMENTS
TATISTICS16
Although total customer participation declined sharply in 2012, Gas Marketer sales activity rose 17
considerably in 2012 compare to 2011. New enrollments were submitted at a substantially 18
higher rate in 2012 than in 2011, peaking during the summer months with approximately 7000 19
cumulative enrollments for the months of July, August and September. Figure 2-4 below 20
illustrates the comparison of monthly gross enrolments between 2011 and 2012. 21 22 111,062 101,459 54,948 17,015 13,329 9,903
2010
2011
2012
Residential Commercial 2010 Total: 128,077 2011 Total: 114788 2012 Total: 64,8512
Total gross enrollments equalled 16,025 in 2012 compared to 6,174 in 2011, and on average 3
monthly gross enrollments in 2012 exceeded those of 2011 by 183 percent. With the removal of 4
„Evergreen‟ provisions in 2011, whereby expiring contracts automatically renewed, the level of 5
gross enrollment actually represent new contracts submitted. 6
Figure 2-5 below illustrates the enrollment retention rate over the past three years from 2010 to 7
2012. The figure compares gross enrollments to net enrollments. Net enrollments are contracts 8
that flow with the Gas Marketer on the contract start date and are calculated as gross 9
enrollments less any 10-day cancellations and operational correction drops1. 10
Figure 2-5: Comparison of Yearly Enrollment Activity (2010 – 2012)
11
12
As Figure 3-5 indicates, enrollment retention rates have improved considerably since 2010, 13
which coincides with the introduction of consolidated business rules for residential and 14
1
10-day cancellations result from customers who elect to cancel their contract within their 10-day cooling period; Operational Correction Drops are contract cancellations submitted by the Gas Marketers after the 10-day cancellation window but before the contract start date.
200 236 900 362 471 783 451 424 1141 313 372 521 427 735 1050 931 1250 1688 2014 2287 2709 1068 1148 718 2011 2012 2012 Enrollment Trend 7302 6174 16025 3600 5683 14347
2010
2011
2012
only 49 percent. In the following years, net enrollments improved to 92 percent and 90 percent 2
of total gross enrollments for 2011 and 2012 respectively. Seemingly, the consolidated 3
business rules, which include third-party verification calls, 10-day cooling periods and 4
confirmation letters sent to the account holder for all residential and commercial enrollments, 5
have been effective in ensuring that customers understand the fixed rate contracts they signed 6
up for. 7
2.3
D
ISPUTES
TATISTICS8
As contract retention rates have increased over the past three years, the number of contract 9
disputes has declined over the same period. There were 1,467 total disputes filed in 2012 down 10
from 2,173 disputes in 2011 and 2,638 disputes in 2010. This represents a 32 percent drop in 11
dispute filings in 2012. The figures below illustrate Customer Choice dispute activity in 2012 and 12
over the past three years. Figure 6 illustrates the monthly dispute statistics for 2012. Figure 2-13
7provides a yearly comparison of dispute activity from 2010 to 2012. 14
Figure 2-6: 2012 Monthly Dispute Statistics
15 16 17 143 142 113 78 115 72 66 65 52 69 62 168 56 46 39 31 30 18 21 31 11 14 17 8 38 24 15 10 17 7 8 21 7 6 11 4
2
Cancellation disputes are disputes raised by Gas Marketers who have agreed to release a 3
customer from their contract outside of their contract anniversary date. These disputes 4
contravene the Essential Service Model and may result in additional Midstream Costs, which 5
are recovered by all customers including those not participating in the Program. While the 6
declining rate in Cancellation Disputes since 2010 seems promising, FEI continues to 7
emphasize that Cancellation Disputes must be used sparingly and restricted to compassionate 8
reasons only, as determined by the Commission. 9
Standard disputes are disputes raised by the customer against their Gas Marketer in dispute of 10
their contract‟s validity. These disputes require Gas Marketers to defend against the customer‟s 11
claim that their contract is invalid, and are finalized with a BCUC ruling in favor of either the Gas 12
Marketer or the Customer. Like Cancellation Disputes, standard disputes have also declined 13
since 2010. This suggests that the removal of the „Evergreen‟ provision in October 2011 and 14
the introduction of consolidated business rules have been effective in ensuring that customers 15
understand the fixed rate contracts they enter in. 16
BCUC rulings in favor of the customer over the same period have remained relatively constant, 17
representing approximately 50 percent of all standard disputes raised. 18
2.4
2012
C
USTOMERE
DUCATIONP
LAN19
The Customer Education Plan and budget for 2012 remained unchanged from the plan 20
approved in Decision Order A-9-11 for 2011. With a budget of $300 thousand, the Customer 21
Education objectives were to: 22
Increase Customer Choice name awareness 23
Increase customer protection via education 24 2019 1742 1145 619 431 322 326 227 168
2010
2011
2012
Maintain neutrality 2
These Objectives were executed via radio ads, rate comparison newspaper ads, bill inserts, bill 3
messaging, and a redesigned Customer Choice website. A brief description of each is 4
described below. 5
Customer Choice Website 6
At the heart of the communication strategy is the Customer Choice website, to which all other 7
forms of media direct customers to. In September 2012, the language on the website was 8
simplified to be more concise and neutral. The site was also re-designed to ensure that 9
customers were able to target specific information easily in order to better assist them in their 10
decision making. 11
Radio Spots 12
Two radio ads were produced in 2011 to increase the Customer Choice name awareness. In 13
the production of both the scripts and the ads, FEI ensured the content and tonality of the ads 14
remained completely neutral. 15
The same radio ads were used in 2012, and ran for four alternating weeks in July and August. 16
This timing was particular chosen to aid Gas Marketer sales effort and coincided with potential 17
targeted marketing to the approximate 51 000 Customer Choice customers with contracts 18
scheduled to end in November 2012. 19
Rate Comparison Ads 20
The Customer Choice Rate Comparison print ads were redesigned for 2012 in an effort to 21
increase Customer Choice Program awareness and to provide consumer information. Notable 22
changes included: 23
A simplified, attention grabbing template 24
A prominent display of the Customer Choice Program Logo 25
Less precautionary text to better exemplify neutrality 26
A clearer and more concise rate table that illustrates each of the Gas Marketers lowest 27
term rates and Fortis‟ variable rate 28
The ads were run in local newspapers across British Columbia, in seven monthly periods from 29
March to November 2012. 30
Bill Inserts 31
The Customer Choice bill insert was redesigned for 2012. The purpose of the bill insert is to 32
enhance consumer protection so they can make informed choices regarding the Customer 33
Choice Program. 34
1. A reduction from 6 panels to 2 panels 2
2. Clearer and more concise text that explains the Program, outlines consumer rights and 3
obligations and compares consumer options 4
The re-designed bill insert was distributed to customers in the eligible Customer Choice areas in 5
June 2012. Customer Choice was also included in a group bill insert with other FEI initiatives in 6
August 2012. 7
Bill Message 8
One bill messaging spot was secured on the March 2012 FEI bills, for customers in the eligible 9
Customer Choice areas. The purpose of the bill message is to provide customer information. 10
Message: It’s your choice: fixed rates for natural gas from an independent gas marketer 11
or a variable rate from FortisBC. The Customer Choice Program lets you choose your 12
natural gas supplier. Compare your options at fortisbc.com/choice. 13
Standard Information Booklet 14
The standard information booklet was updated to remove old references and terminology such 15
as „Evergreening,‟ was translated into Punjabi and Chinese, and published on the FEI website 16
for reference in October 2011. 17
2.5
S
YSTEME
NHANCEMENTS18
Approvals from BCUC Decision Order A-9-11 regarding the Consolidation of Business Rules, 19
Dispute and Cancellation Drops, the Dispute Ruling Page, Contract Renewals and the Marketer 20
Supply Requirement required several system enhancements to be undertaken. Table 2-2 below 21
summarizes the system enhancement required by Decision Order A-9-11. 22
Table 2-2: System Enhancement from Decision Order A-9-11
23
System Enhancements from Decision Order A-9-11 Consolidated Business Rules
1. Reconfiguration of Confirmation Letter to Accommodate all Customers
2. Creation of 1150 Enrollment Code to allow for the waiving of the 10-day Cancellation Period
Dispute and Cancellation Drops
3. Redesign and implementation of the Independent Dispute Process
Dispute Ruling Page
4. Creation of fields to be added to show compensation responsibility and effective reimbursement date
Dispute Ruling Page
5. Removal of the “Evergreen Provision”
6. Creation of premise level reporting
Due to a system freeze that was in place for most of 2011 to accommodate the transition to a 1
new SAP Customer Information System, many of these system changes were not undertaken 2
and implemented until the beginning of 2012. 3
Reconfiguration of Confirmation Letter 4
The enrollment confirmation letter, which was previously sent to only residential customers, was 5
reconfigured to accommodate all customers to ensure that the account holder received 6
adequate notification of the contract that has been signed. As large commercial Rate Schedule 7
3 customers reserved the option to „opt-out‟ of the 10-day cooling period, the system generated 8
confirmation letter was reconfigured to include a field that read „Waived‟ in place of the opt-out 9
date, as shown in Figure 2-8. The new confirmation letter was implemented January 1, 2012 10
with the new customer information system. 11
Figure 2-8: Confirmation Letter Enhancement
12
13
Creation of New Code for Waiving of 10-Day Cancellation Period 14
In order for the system to distinguish between those who waived the 10-day cooling period and 15
those who did not, FEI developed a new enrollment code for Rate Schedule 3 customers who 16
elected to waive their 10-day cancellation period. The new 1150 Standard Enrollment No 10-day 17
Cool-Off code will trigger the system to waive the 10-day cancellation period and reject a 2110 18
Marketer Cancellation Period Drop, if one were submitted. As a result, the confirmation letter will 19
show that the customer has waived their cancellation period by displaying the term “waived” in 20
the opt-out deadline box. 21
Revised Independent Dispute Process 22
A working group consisting of a representative from a Gas Marketing company, FEI and BCUC 23
was established to review the independent dispute procedure and make improvements to allow 24
the process to be more transparent to the customer and provide rebuttal information before any 25
ruling was determined. See Section 3 for more information about the changes implemented for 26
the independent dispute process. 27
Three new fields were added to the dispute ruling page in GEM to allow the Commission to set 2
two effective dates as follows: 3
The date the contract should be dropped in the enrolment database and the date FEI 4
should reverse and rebill the customer; and 5
The effective date the gas marketer is required to reimburse the customer. The scenario 6
where two effective dates are required happens when a gas marketer is required to 7
reimburse the customer back to the start of their contract. 8
A text box was added to the end of the page to allow the Commission to make final 9
comments before the dispute is closed. 10
Removal of Evergreen Provision 11
The ability to roll-over contracts automatically at the contract end date for enrollments submitted 12
with an 1130 and 1230 enrollment code was disabled in the FEI customer information system 13
effective October 1, 2011. Any new enrollments with an 1130 or 1230 enrollment code 14
submitted after July 1, 2011 were also returned to the Gas Marketer with an invalid response. 15
Finally, the Marketer non-renewal cancellation code 3320 was disabled since customers would 16
automatically return to FEI supply at the contract end date if there was not a new Gas Marketer 17
enrollment in the system. 18
Introduction of New Point of Delivery (POD) Level MSR Reports 19
FEI presented Gas Marketers with two new detailed marketer supply requirement reports to 20
allow for better forecasting of future supply requirements. The new reports were made available 21
on the GEM reporting website May 1, 2012. 22
1. MSR Details by Marketer Group 23
This report allows for marketer group reconciliation to the Marketer Demand Details report 24
with a three month entry date view. 25
This report replaced the report rolled out November 2011 with a three month entry date 26
view. 27
2. MSR Details by Point of Delivery 28
This new report is a detailed version of the MSR details drilled-down to the POD level 29
with a 3 month entry date view. 30
Report allows marketers to more accurately forecast future supply requirements. 31
32
3. MSR Details by Contract Year 33