DigitalCommons@USU
All Graduate Theses and Dissertations Graduate Studies, School of
5-1-2009
Investigation of Joining Micro-Foil Materials with
Selective Laser Sintering and Laser Powder
Deposition
Andrew Isaac Deceuster
Utah State University
This Thesis is brought to you for free and open access by the Graduate Studies, School of at DigitalCommons@USU. It has been accepted for inclusion in All Graduate Theses and Dissertations by an authorized administrator of DigitalCommons@USU. For more information, please contactbecky.thoms@usu.edu.
Recommended Citation
Deceuster, Andrew Isaac, "Investigation of Joining Micro-Foil Materials with Selective Laser Sintering and Laser Powder Deposition" (2009).All Graduate Theses and Dissertations.Paper 434.
DigitalCommons@USU
All Graduate Theses and Dissertations Graduate Studies, School of
5-1-2009
Investigation of Joining Micro-Foil Materials with
Selective Laser Sintering and Laser Powder
Deposition
Andrew Isaac DeceusterUtah State University
This Thesis is brought to you for free and open access by the Graduate Studies, School of at DigitalCommons@USU. It has been accepted for inclusion in All Graduate Theses and Dissertations by an authorized administrator of DigitalCommons@USU. For more information, please contactdigitalcommons@usu.edu.
Take a 1 Minute Survey-http://www.surveymonkey.com/s/ BTVT6FR
Recommended Citation
Deceuster, Andrew Isaac, "Investigation of Joining Micro-Foil Materials with Selective Laser Sintering and Laser Powder Deposition" (2009).All Graduate Theses and Dissertations.Paper 434.
LASER SINTERING AND LASER POWDER DEPOSITION by
Andrew I. Deceuster
A thesis submitted in partial fulfillment of the requirements for the degree
of
MASTER OF SCIENCE in
Engineering and Technology Education Approved:
Gary Stewardson, Ph.D. Leijun Li, Ph.D.
Co-Major Professor Co-Major Professor
Ning Fang, Ph.D. Byron R. Burnham, Ed.D.
Committee Member Dean of Graduate Studies
UTAH STATE UNIVERSITY Logan, Utah
Copyright ©Andrew I. Deceuster 2009 All Rights Reserved
ABSTRACT
Investigation of Joining Micro-Foil Materials with Selective Laser Sintering and Laser Powder Deposition
by
Andrew I. Deceuster, Master of Science Utah State University, 2009 Major Professors: Dr. Gary Stewardson and Dr. Leijun Li Department: Engineering and Technology Education
Continuous and pulse selective laser sintering and laser powder deposition were used to find a solution to the manufacturing of micro-foil lattice structured components. A full factorial test matrix was used for each process to determine the processes
capability to produce continuous tracks for joining the micro-foil materials. The samples were evaluated for dimensional profiles, distortion, and cycle times, to develop selection criteria for implementation of the processes into industry.
The selective laser sintering processes were able to join the micro-foil materials into lattice structures with continuous tracks. The laser powder deposition processes were not able to properly join the micro-foil materials into lattice structures. The end results showed that micro-foil lattice structures can be produced using continuous and pulse selective laser sintering.
ACKNOWLEDGMENTS
I would like to thank my committee for all the time that was dedicated to the completion of this thesis. I extend special thanks to Dr. Stewardson and Dr. Li for all the hours spent editing and giving feedback on this project.
I am very grateful for the sacrifice my loving wife and children made to support me in finishing this thesis. I am very appreciative of everything that they have done for me to complete my thesis. To my family, I express my love and gratitude.
I would finally like to thank all of my graduate office friends who distracted me enough to not lose it during the duration of this project, especially Scott for all of the deep discussions and ping pong matches.
CONTENTS
Page
ABSTRACT ... iii
ACKNOWLEDGMENTS ... iv
LIST OF TABLES ... vii
LIST OF FIGURES ... ix
CHAPTER I. INTRODUCTION ... 1
Statement of the Problem ... 5
Statement of the Purpose ... 5
Statement of Need ... 6
Statement of Procedure ... 6
Statement of Limitations ... 7
Statement of Assumptions ... 7
Terminology and Acronyms ... 8
II. REVIEW OF LITERATURE ... 10
Introduction ... 10
Selective Laser Sintering ... 10
Laser Powder Deposition ... 14
Traditional Manufacturing Processes ... 20
Summary ... 22 III. METHODOLOGY ... 23 Project Description ... 23 Study Layout ... 23 Initial Phase ... 24 Final Phase ... 30 Subproblems ... 31 Summary of Methodologies ... 36
Page
IV. INITIAL PHASE RESULTS AND CONCLUSIONS ... 38
Introduction ... 38
Subproblem 1 ... 38
Laser Powder Deposition for Subproblem 1 ... 42
Summary of Subproblem 1 ... 47
V. FINAL PHASE RESULTS AND CONCLUSIONS ... 48
Introduction ... 48
Subproblem 2 ... 48
Subproblem 3 ... 67
Summary of Subproblems 2 and 3 ... 78
LIST OF TABLES
Table Page 1. Parameter Settings for the Continuous SLS Subprocess in the Initial
Phase ... 26 2. Parameter Settings for the Pulse SLS Subprocess in the Initial Phase ... 26 3. Parameter Settings for the Continuous LPD Subprocess in the Initial Phase .... 28 4. Parameter Settings for the Pulse LPD Subprocess in the Initial Phase... 29 5. Parameter Settings for the Continuous SLS Subprocess in the Final Phase ... 32 6. Extended Parameter Settings Needed for Finding the Continuity Points
for the Continuous SLS Subprocess in the Final Phase ... 33 7. Parameter Settings for the Pulse SLS Subprocess in the Final Phase... 34 8. The Measurement Data for Tracks Produced with 100 J/mm Energy
Inputs and Varying Power ... 53 9. Measurement Data for the Continuous SLS Subprocess for the Final Phase .... 57 10. Measurement Data for the Pulse SLS Subprocess for the Final Phase ... 66 11. The Measurement Data for the Distortion of the Gap Distances for the
Continuous SLS Subprocess ... 69 12. The Cycle Time and Measurement Data for the Continuous SLS
Subprocess ... 72 13. The Measurement Data for the Distortion of the Gap Distances for the
Pulse SLS Subprocess ... 75 14. The Cycle Time and Measurement Data for the Continuous SLS
Subprocess ... 78 15. The Selection Criteria for Producing Continuous Tracks Using the
Table Page 16. The Selection Criteria for Producing Continuous Tracks Using the Pulse
LIST OF FIGURES
Figure Page 1. Graphic representation of a typical lattice structure ... 1
2. CAD model of a micro-foil structured well screen with micro-foil
thickness of 0.25mm with 0.25mm slots in between each micro-foil ... 2 3. Graphic representation of an aspect ratio for a heat sink ... 3 4. Current well screen design that must incorporate support rods and thicker
v-shaped wire to achieve joining ... 4 5. Graphic representation of the SLS process ... 10 6. Picture of a ball forming in the powder bed with the surrounding powder
having been pulled into the ball ... 12 7. A picture showing the different track profiles formed in the powder bed ... 13 8. A graph depicting the relationship between laser power and scan speed
on stainless steel and the type of track formed as seen in Figure 7 ... 13 9. A graphic representation of the laser powder deposition process using
multiple powder feeders ... 15 10. Picture of two different builds, one with feedback controls on the left
and one with no feedback on the right ... 16 11. Picture shows the rebuilt area and substrate. The microstructure of the
rebuild can also be seen ... 17 12. A graphic model of the powder flow around the joint being welded ... 18 13. A graphic representation of multiple photodecetors used to monitor the
build height ... 19 14. The large fixture used to produce the samples for the initial and final phases .. 25 15. Graphic depiction of the selective laser sintering process being used to
Figure Page 16. Graphic representation of laser powder deposition being used to join the
micro-foil materials ... 30 17. The results of the initial phase for the continuous SLS subprocess.
Magnification 20X ... 39 18. The results of the initial phase for the pulse SLS subprocess.
Magnification 20X ... 41 19. The results of the initial phase for the continuous LPD subprocess.
Magnification 20X ... 44 20. The turbulence created from the interaction of the carrier gas with the
micro-foil materials ... 45 21. The results of the initial phase for the pulse LPD subprocess.
Magnification 20X ... 46 22. A typical crack seen in the pulse LPD samples upon microscopy inspection.
Magnification 40X ... 46 23. The results of the final phase for the continuous SLS subprocess.
Magnification 20X ... 50 24. The plot of track continuity for the continuous SLS subprocess ... 51 25. The plot of energy input and continuity in which the boundary zone can
be seen between continuous and discontinuous tracks at 27.8 J/mm to
33.3 J/mm ... 52 26. The micro-foil cross-sectional results for the final phase for the continuous
SLS subprocess. Magnification 20X... 55 27. The powder material cross-sectional results for the final phase for the
continuous SLS subprocess. Magnification 20X ... 56 28. The plots of the profile dimensions versus the energy input with
logarithmic trend lines added through the data points for each power setting .. 58 29. A detailed view of the mushy zone adjacent to the sintered powder track.
The mushy zone consists of the area comprised of connected round nodules of powder. Magnification 40X ... 59
Figure Page 30. The results for the final phase for the pulse SLS subprocess.
Magnification 20X ... 61 31. The plot of track continuity for the pulse SLS subprocess. ... 63 32. The plot of energy input and continuity in which the boundary zone can
be seen between continuous and discontinuous tracks at 64.0 J/mm to
72.0 J/mm ... 64 33. The micro-foil cross-sectional results for the final phase for the pulse SLS
subprocess. Magnification 20X ... 65 34. The powder material cross-sectional results for the final phase for the
continuous SLS subprocess. Magnification 20X ... 65 35. A detailed view of the gaps in the micro-foil material adjacent to the track.
The parameter setting of the sample was 500 watts and 1mm/s.
Magnification 40X ... 70 36. A detailed view of the gaps in the micro-foil material adjacent to the track.
The parameter setting of the sample was 4.0 kW and 8 ms.
CHAPTER I INTRODUCTION
The solution for many engineering problems has required the design of
components incorporating lattice structures. A lattice structure is an open framework of overlapped, interlaced, or expanded materials, usually in a perpendicular or diagonal pattern. Figure 1 depicts a typical overlapped lattice structure. The lattice structure provides many different characteristics that make it a feasible solution to a variety of applications. Depending of the geometric design, lattice structures can provide rigidity, flexibility, expandability, and/or compressibility. The materials in the lattice structures can be designed to act as a sieve or screen by designing the slot width in between the materials to a desired specification. These characteristics have made the use of lattice-structured components useful in solving a variety engineering problems. The use of micro-foil materials has now begun to be incorporated into the design of these structures as seen in Figure 2. The joining of micro-foil materials together to form a
lattice-structured component presents a variety of new manufacturing problems.
Figure 2. CAD model of a micro-foil structured well screen with micro-foil thickness of 0.25mm with 0.25mm slots in between each micro-foil.
Joining technologies on large-scale lattice structures are quite common and include, fusion welding, resistance welding, brazing, soldering, epoxy bonding, and cutting for expanding. The use of these technologies for joining micro-foil materials has proven difficult. When subjected to the traditional joining technologies, micro-foil materials tend to burn through, distort, or form weak bonds. The material’s size has become a limiting factor in the design of lattice-structured components due to the limitations of current joining technologies.
Two technologies that have limited research as a means for creating the lattice structures in micro-foil components is selective laser sintering (SLS) and laser powder deposition (LPD). Both technologies use a laser for the joining process, which allows for detailed and controllable joining. SLS and LPD both utilize a powder metal filler material that would be melted to join the micro-foils together. The powder filler material will create the cross braces for structural support. Additional cross brace materials are not needed with these processes. Both processes may provide a feasible solution to the
problem of joining micro-foil materials into a lattice structure.
With the ability to join micro-foil materials together in these structures, many different industries would benefit from this technology. The thermal management industry has limiting factors on the conventional production of heat sinks. Bonded fin heat sinks are limited by 30:1 to 50:1 fin height to gap ratio. Figure 3 shows the aspect ratio of a heat sink. The fin thickness is limited to 0.2mm to 0.5mm. Using a lattice structure to hold the micro-foil materials, micro-foils down to 0.025mm thickness with height gap rations exceeding 50:1 would be possible. This would alleviate many of the design constraints on bonded fin heat sinks, allowing for better designed heat sinks to be manufactured.
Another industry looking for similar solutions is the drilling industry, which uses well screens in the drilling process. Whether it is in the water or petroleum drilling industry, they both require screens in the bottom of the wells to keep large debris from flowing into the well. With the current oil prices, many companies have looked into
relining or redrilling old shallow wells. An expandable lattice structure would allow the screen to be used in the recasing process. The use of micro-foil materials would increase the efficiency of the screen and allow for precise debris size filtration. Currently, well screens can be designed to a desired slot size for filtration but thicker materials must be used as seen in Figure 4. This thicker material decreases the efficiency of the screen by decreasing the amount of flow area available. The use of micro-foil lattice structured screens would allow for expansion and contraction of the screen, while still allowing for precise debris filtration without sacrificing the efficiency of the screen.
Many other industries can benefit from this technology, including the composites industry, biomedical industry, and nuclear industry. Each industry has its own specific application that requires the joining of micro-foil materials together into lattice structures. With a solution to the joining of micro-foil materials into a lattice structure, new designs will be able to incorporate these structures and many existing designs maybe modified to
Figure 4. Current well screen design that must incorporate support rods and thicker v-shaped wire to achieve joining. (DMC Drillquip, 2008)
incorporate the new manufacturing process.
Statement of the Problem
Solutions to current engineering problems require the use of micro-foil materials being joined into lattice-type structures. Traditional processes used to join micro-foil materials have a strong tendency to burn through, distort, or form weak bonds. Currently, there is not a feasible method for joining micro-foil materials into lattice structures. Since a new joining method is needed for the joining of the micro-foil materials, research is needed to find a solution to this joining problem and establish selection criteria for the solution.
Statement of the Purpose
The purpose of the study was to investigate the use of continuous and pulse SLS subprocesses and continuous and pulse LPD subprocesses for the purpose of joining micro-foil materials into a lattice structure and to establish selection criteria for the acceptable subprocesses. The following subproblems were investigated to determine the capability of each subprocess and create selection criteria.
1. To identify the samples produced by the four subprocesses as continuous or discontinuous based on track continuity.
2. While maintaining continuous track continuity, identify the maximum and minimum dimensions obtainable for track penetration and width to establish selection criteria for various applications.
3. To characterize the subprocesses based on distortion and cycle time values to further establish selection criteria for various applications.
Statement of Need
A variety of industries are currently limited in their ability to design and produce many different components. Joining limitations in the thermal management industry can restrict bonded fin heat sinks to certain aspect rations of 30:1 to a maximum of 50:1. Well screens for the petroleum and water drilling industries have limited flow efficiencies based on the minimum thickness of the materials needed to still achieve proper joining. Other industries such as the bio-medical, nuclear, and sieve, all have limitation on designs based on the same joining limitations. New joining processes for micro-foil material with selection criteria could push the design envelope further in all of the
previously mentioned industries. Industries need this technology if they are to continue to increase their design potential.
Statement of Procedure The procedure for this thesis was as follows.
1. Reviewed the current literature on SLS and LPD to find parameter setting for the study.
2. Created parameter matrix to use for the different processes.
3. Produced samples for the study based on a current design incorporating micro-foil materials in a lattice type structure for the well industry.
4. Ran the experiments according to the parameter matrix.
5. Sectioned and polished the samples to measure the profile dimensions. 6. Measure the distortion and calculate values for the cycle times.
7. Established selection criteria based on the continuity of the tracks, profile dimensions, distortion, and cycle times.
Statement of Limitations The following limitations were inherent in the study.
1. The laser systems selected were a 500 W Hass HL506D and a 50 W Hass
HL54P.
2. The results were limited to the range of parameter settings achievable by the laser systems.
3. The spot size of the laser was 1mm in diameter.
4. The micro-foil and powder materials were 316 stainless steel.
5. A single gap distance and micro-foil thickness of 0.20 mm was used. Statement of Assumptions
The following assumptions were made in this study.
1. The parameter setting ranges of the laser systems would be adequate for initially studying the subprocesses.
2. The transition points for forming continuous tracks to discontinuous tracks would be in the range of the parameter settings.
3. Enough data would be gathered from the parameters selected to form selection criteria for the subprocesses to make the study useful for industrial application.
Terminology and Acronyms
The following working definitions were used in this thesis.
1. CAD: Computer-Aided Design
2. LPD: Laser Powder Deposition
3. Micro-foil: A material with a thickness of 250-25 micrometers, which falls between sheet metal gauges and nano-scale materials.
4. SLS: Selective Laser Sintering
5. Subprocess: A division of the SLS or LPD processes based on laser type. 6. SS: Stainless steel
7. Track: The resulting metal deposit created by the scanning laser. 8. Cycle time: The time required to complete a process.
9. Continuous tracks: Tracks that did not contain any breaks, cracks, or lack of bonding to the substrate.
10.Discontinuous tracks: Tracks that contained breaks, cracks, and lack of bonding to the substrate.
11.Cumecs: Cubic meter per second.
12.Mushy zone: Refers to the region adjacent to the track where the temperature was between the liquidus and solidus state of the material. The area was comprised of connected round nodules of powder.
CHAPTER II
REVIEW OF LITERATURE Introduction
The purpose of this review of literature is to describe the current state of research of laser-based manufacturing for the production of micro-foil material lattice structures. Limited information is available on the use of SLS and LPD for the production of lattice structures. So in this review of literature past studies detailing the process characteristics of the SLS and LPD processes were used. The information will be presented in three main sections. Two of the sections will review the two major types of laser
manufacturing that will be used: SLS and LPD. The third section will cover the current and past manufacturing methods.
Selective Laser Sintering
Traditionally, SLS is a rapid prototyping process that uses a laser to fuse powder materials together. The goal of this rapid prototyping process is to produce a finished product from a three-dimensional (3D) CAD model in a single manufacturing process. Due to limitations in SLS, thin films cannot be produced based on the laser spot size and other effects. The incorporation of thin films into the process would allow it to produced thin film parts of similar material with complete metallurgical bonds. SLS can provide another technique for producing these types of parts without needing to braze or solder.
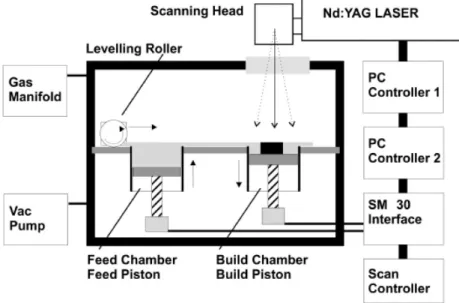
chamber is the feed chamber and the other is the build chamber. The feed piston is raised and the leveling roller transfers the powder to the build chamber. After each scan of the infrared laser, the building piston is lowered and the next layer of powder is transferred. This is done layer by layer until the part is completed as shown in Figure 5.
Many different types of laser sintering have been developed over the years. Some of the first processes used photosensitive resin, which created very brittle parts that could be used as visual aids and indirect molds for casting (Katz & Smith, 2001). Other version of the process used a metal-polymer powder mix to produce parts. The polymer had to be used as a binder for the metal powder and needed to be removed after laser sintering. The porous structure was then filled with copper or bronze to fill the space left by the polymer (Su, Erasenthiran, & Dickens, 2003). A composite blend of metal has also been used. One metal has a low melting temperature, while the second has a higher melting
Figure 5. Graphic representation of the SLS process (Morgan, Sutcliffe, & O’Neill, 2004).
temperature. The lower melting point material would act as the binder in the matrix and hold the unmelted powder together (Su et al.). Many problems were associated with these processes, from brittleness to lack of heat resistance.
For SLS to make fully functional components, the process needs to produce parts that are similar in physical and chemical properties as the traditional powder metallurgy processed materials. This required that single metal powders be used with no binder. The powder would then have to be directly melted and fused to other layers of previously melted powder (Morgan et al., 2004).
Numerous problems are associated with this version of SLS. When the laser initially scans the surface of the cold powder bed, there is an initial ball that forms from the high surface tension of the bed (Su et al., 2003; Tolochko et al., 2004). The surface tension creates a steep contact angle, limiting the wettability of the liquid pool
(Agarwala, Bourell, Beaman, Marcus, & Barlow, 1995). The oxides in the powder add to the surface tension (Morgan et al., 2004; Simchi, 2006). The high surface tension causes the bead to form on the surface of the powder bed instead of penetrating into the bed. The beads then begin to develop pores in between each pass because the roots cannot be reached by the laser (Xiao & Zhang, 2007). The initial balling and any other balling that can occur in the track will deplete powder from the surrounding powder bed, which leads to more problems with nonuniform density, as seen in Figure 6.
Thermal stresses are a similar problem like balling in the process. Most often this means that the part is not dimensionally correct and needs further machining to be a useable part. Many thermal issues are inherent with the process, and even more so some
Figure 6. Picture of a ball forming in the powder bed with the surrounding powder having been pulled into the ball (Tolochko et al., 2004).
thermal issues are dependent on the part being made. The issue of curl has been very apparent in tracks that are made without a support base plate. When parts require long tracks to be made, there is an issue with distortion, cracking, and Christmas tree defects (Simchi, 2006). The non-uniform heating causes these problems to occur. Cracking is commonly seen and it is possible to have the delaminating of layers from the thermal stress. Preheating the bed has shown to help alleviate the effect of the thermal stress (Morgan et al., 2001).
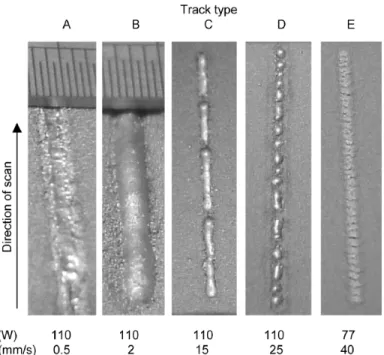
Track profile has become another issue in the process. The combination of laser power and travel speed has been shown to produce different types of track profiles, as seen in Figure 7 (Childs, Hauser, & Badrossamay, 2004; Childs, Hauser, & Badrossamay, 2005). Figure 8 shows the combination of these two parameters and the corresponding track profiles, which can be seen in Figure 3. The characteristics of the powder bed have been shown to effect the track profile but not as much as the two previously mentioned
Figure 7. A picture showing the different track profiles formed in the powder bed (Childs, Hauser, & Badrossamay, 2005).
Figure 8. A graph depicting the relationship between laser power and scan speed on stainless steel and the type of track formed as seen in Figure 7 (Childs et al., 2004).
parameters (Bugeda, Cervera, & Lombera, 1999; Chatterjee, Kumar, Saha, Mishra, & Choudhury, 2003).
Producing thin film parts using SLS will involve all of the previously mentioned problems or issues. The major issues being: bonding between the powder tracks and thin foils, balling in the powder track, and thermal stresses distorting the final product. More research is needed to overcome these three main issues in the SLS process for the production of thin film components.
Laser Powder Deposition
Laser powder deposition is the combination of rapid prototyping and laser welding with powder filler material. The process grew out of a need for new repair and fabrication techniques (Mazumder, Dutta, Kikuchi, & Ghosh, 2000). For this study, laser welding with powder filler version of LPD is the most similar process because thin materials are being welded together, but because of the numerous studies and research done on the rapid prototyping versions of LPD, they will be included in this review. Similar to SLS, LPD has its advantages and disadvantages, though they differ from those found in SLS. The advantages and disadvantages as they relate to process capability for the production of thin film parts will be discussed.
In LPD, a laser is used to form a molten pool on a substrate in an inert
atmosphere. Laser used in the process include Nd:YAG, CO2, and fiber. While the laser is forming a molten pool, powder is fed through a powder feeder to a nozzle delivery system. Multiple powder feeders can be used to control deposit composition. The nozzle
systems vary from single, multiple, and coaxial nozzles. The powder is injected into the molten pool to form a weld bead or deposit. The 3-D model is then traced out and built up until completion. Figure 9 shows the general setup for the LPD process.
Many process characteristics of LPD are defined by the characteristics of the laser. The focal spot size of the laser determines the size of the features that it can produce. This becomes a limiting factor in the production of thin film components. The current systems will not allow the laser spot size to be made small enough to produce foil material members, so this eliminates the process from producing the part in an additive manner. The laser also has many thermal characteristics that are both advantageous and process limiting. The use of lasers creates a small concentrated heat source that, when compared to other welding processes, provides very little heat input. Due to the thin layers numerous passes of the laser are required for certain geometries. Distortion and
Figure 9. A graphic representation of the laser powder deposition process using multiple powder feeders (Lewis & Schlienger, 2000).
residual stress start to become an issue the taller the part gets (Mazumder et al., 2000). Figure 10 shows two different scenarios, one with thermal feedback to control layer height and the other with no feedback. Without the thermal feedback, the parts can become very deformed. In crack sensitive alloys, this becomes very detrimental. If the part becomes too distorted, excessive secondary machining would be required to correct the parts.
The use of the laser can also be advantageous in the production of certain microstructures in the part (Corbin, Toyserkani, & Khajepour, 2003). The rapid heating and solidification produces very fine grain structures with excellent mechanical
properties (Song, Deng, Chen, Hu, & Li, 2006; Yellup, 1995). Figure 11 shows the fine grain structures that are achievable this LPD. This also allows for the production of directionally solidified parts, typically seen in the turbine industry. In certain materials, the rapid solidification produces undesirable microstructures, but as the laser passes over the previous layer it can be used to temper or change the undesired microstructure (Majumdar, Pinkerton, Liu, Manna, & Li, 2005; Pinkerton & Li, 2004).
Figure 10. Picture of two different builds, one with feedback controls on the left and one with no feedback on the right (Mazumder et al., 2000).
Figure 11. Picture shows the rebuilt area and substrate. The microstructure of the rebuild can also be seen (Song et al., 2006).
The powder feeding system determines the process characteristics to the same extent that the laser does. The high velocity of the powder out of the nozzle and into the molten pool will not allow for all of the powder to become fully molten. In some
instances the deposit consists of fully melted, partial melted and unmelted powder material. This type of structure leads to issues with porosity and oxide inclusions (Pinkerton & Li, 2004). This lack of complete melting also contributes to a higher level of surface roughness, which is usually only evident on the surface layer (Mazumder et al., 2000; Pinkerton & Li, 2004). The roughness can lead to porosities forming in the weld boundaries. The powder size will also control the density of the part similar to the SLS process (Lewis & Schlienger, 2000).
from the powder being injected at high velocities. The substrate is typically a flat plate or the build up is wide enough to avoid creating turbulence. Figure 12 shows the results of experimental and simulation of powder flow around an edge joint. The edge of a part is typically where turbulence is formed and a disruption in part uniformity is seen (Lin & Hwang, 2001).
Although LPD has possible issues with turbulence, it has advantages in its ability to change filler alloy in mid process. Multiple powder feeders can be used each
containing differ alloys and each one can use different flow rates to alter the alloy composition at anytime in the process, unlike the SLS process which uses one single filler alloy composition (Lewis & Schlienger, 2000). Figure 5 shows the use of multiple powder feeders in the LPD process. The use of multiple powder feeders also allows for
Figure 12. A graphic model of the powder flow around the joint being welded (Lin & Hwang, 2001).
the control of microstructure. The use of different fillers can control segregation, carbide formation, and mechanical properties (Qian, Lim, Chen, & Chen, 1997). The system can use the powder feeders with a camera relay system to monitor the weld deposit and control the flow rate to control the deposit geometry. Figure 13 shows the typical multi-sensor layout for controlling the height of the deposits. This allows for the system to make corrections as needed, which increases repeatability and improves the overall quality of the process (Mazumder et al., 2000).
The use of multiple powder feeders and sophisticated software makes LPD a versatile process. However, very little has been done using LPD as a traditional welding process. Most research done on LPD has been done on flat plate (Yellup, 1995). Still,
Figure 13. A graphic representation of multiple photodecetors used to monitor the build height (Mazumder et al., 2000).
there is some research in which it has been used to fill v-grooves and welding edge joints (Lin & Hwang, 2001; Song et al., 2006). Research has been performed using wire for filler with even few studies using powder material for the filler (Missori & Sili, 2000; Sun & Kuo, 1999). Although more research has been done on just using flat plate to build up a part more research is needed to find out the potential LPD has as welding process.
Using LPD will involve all of the previously mentioned issues. The major issues being: bridging the gap between each thin film, avoiding turbulence from the preplaced materials, and thermal issues. Controlling these major issues will be critical in producing a final part. More research is needed to over come these major issues in the LPD process for the production of thin film components.
Traditional Manufacturing Processes
The traditional manufacturing processes for producing lattice structured
components involved four major joining processes. These four processes are: welding, brazing, soldering, and epoxying. These techniques have their advantages but still have numerous disadvantages when compared to the possibility of using SLS or LPD. The traditional processes will be discussed in further detail as they relate to the manufacturing of thin film components.
Arc welding is readily used when lattice structured components are designed with thicker sections. Typically, on the thinner sections resistance welding has been readily used. In the production of well screens, resistance welding has been limited to thicker
sections and would not qualify as micro-foil materials. Resistance welding requires high pressure and electrical flow. The pressure would cause the micro-foil materials to deform. Autogenous laser welding has also become popular for welding micro-foil materials, but is limited to certain joint geometries (Li, Gobbi, Norris, Zolotovsky, & Richter, 1997; Xie & Kar, 1999). Welding does provide the advantage of a complete metallurgical bond that would allow for better heat transfer in heat sinks. However, the main draw back to any welding process is the distortion associated with the high temperatures needed for welding. The process characteristics of welding decrease its feasibility for joining micro-foil materials.
Brazing and soldering offer an advantage over welding on the distortion issue. Less heat input is needed due to the lower melting temperatures of braze or solder filler materials. As a result, the distortion can be better controlled. However, other issues arise from the process characteristics. Brazing and soldering work by capillary action to transport the filler materials into the joints. Capillary action limits the minimum spacing between micro-foils in a lattice structure. When the spacing becomes to close, the capillary action pulls the filler into the spacing instead of just the joint. The spacing distance can reach another minimum, where the surface tension has become to high. The surface tension at this point will not allow the filler material to enter the lattice structure.
Brazed and soldered joints have different mechanical properties due to dissimilar base and filler material. Heat transfer efficiency decreases from this difference. Similarly, the strength of the joint decreases as well. The loss of heat transfer is an issue for the thermal management industry, while strength loss is not. The opposite is true for the well
screens in the drilling industry.
The use of epoxy has its own advantages and disadvantages, which differ from those of welding, brazing, and soldering. Since there is no heat involved in epoxying, there is no distortion associated with it. Epoxying is a relatively quick and easy process with high strength. However, the epoxy is very brittle and does not allow for expansion and contraction of the lattice structures. The epoxy will also have the tendency to become weathered or aged and lose strength over time, especially when exposed to heat or UV radiation. The epoxying process becomes mostly limited to the thermal management industry.
Summary
The traditional joining processes have limitations for joining micro-foil materials into lattice structures. Distortion, strength, and heat are limiting factors in these
traditional processes. To overcome these limiting factors, SLS and LPD have been used to join micro-foil materials into lattice structures. The process characteristics of SLS and LPD alleviate many of the disadvantages of the traditional processes, making them ideal for joining micro-foil materials into lattice structures.
CHAPTER III METHODOLOGY Project Description
The purpose of this study was to investigate the use of SLS and LPD processes in the joining of micro-foil materials. Continuous and pulse lasers were used as
subprocesses in the SLS and LPD main processes to produce samples. Parameter
matrices were created and used for testing the four subprocesses. The processed samples were categorized and evaluated to determine the characteristics of each process.
Study Layout
Previous studies have not covered the joining of spaced micro-foil materials with powder filler material. The prior studies either focused on single open root joining of foil materials or laser sintering of a pure powder. To efficiently and effectively study the joining of spaced microfoil materials with powder filler, a two phase design was used for acquiring the results for this study. The purpose of the initial phase of the study was to categorize the processes by track formations produced. The categorization by track formation of the processes allowed for the elimination and retention of certain processes. The early elimination of processes that did not produced continuous tracks enabled greater focus on those processes showing potential success. A small test matrix was used in the initial phase for each process to gain a basic understanding of parameter effect and to provide a better format for the test matrices in the final phase. The continuous laser
subprocesses studied the variables of power and travel speed, while the pulse laser subprocesses studied the variables of power and pulse duration.
Following the initial phase, the final phase further identified the capabilities of the processes. The final phase provided an expansion of the test matrices that identified the limit ranges for each variable and ideal setting for the processes. In addition, an increased sample size in the final phase provided better validity for trends seen in the data. The results of the initial phase provided a logical starting point for data collection in the final phase, identifying solutions to the joining of spaced micro-foil materials with powder filler.
Initial Phase Sample Preparation
The samples used in the initial phase required the use of micro-foil material, narrow spacing, and standardization between samples. A fixture was constructed to meet the requirements of the samples. The micro-foil material used in the study was 316
stainless steel (SS), with a thickness of 0.20 mm. The 316 material was sheared into strips measuring 6.35mm by 25.4mm. The fixture was used to hold the 316 SS micro-foil materials with a spacing of 0.20 mm between each piece of material. The spacing was achieved by placing a 0.20 mm thick copper strip in between each of the 316 SS strips that was recessed 3mm below the top of the SS strips. The clamping feature of the fixture was then used to secure the micro-foil materials for joining. A 0.30mm variation in the top of each stainless steel strip was permitted for the initial phase. The additional
tolerance allowed in the initial phase enabled observations to be made on the effect of height variation. Upon completion of joining the materials, the copper strips were removed and the samples were sectioned to separate them individually. The fixture clamping the micro-foil materials can be seen in Figure 14.
Initial Phase
Two subprocesses of SLS samples were produced in the initial phase. The first subprocess was produced using a 500-watt continuous laser (Hass HL506D) and the second subprocess using a 5-kilowatt pulse laser (Hass HL54P). The parameters used in the test matrices for the initial phase for the SLS subprocesses can be seen in Tables 1 and 2. The variables manipulated for continuous laser SLS subprocess were power and travel speed. The initial phase values selected for study were similar to those used in other studies. A sample size of 16 was selected for the initial phase to find a logical range to further study in the final phase. The previous studies had used sample sizes much
Table 1
Parameter Settings for the Continuous SLS Subprocess in the Initial Phase
Samples Power (W) Travel speed (mm/sec)
1 400 1.0 2 400 2.0 3 400 3.0 4 400 4.0 5 300 1.0 6 300 2.0 7 300 3.0 8 300 4.0 9 200 1.0 10 200 2.0 11 200 3.0 12 200 4.0 13 100 1.0 14 100 2.0 15 100 3.0 16 100 4.0 Table 2
Parameter Settings for the Pulse SLS Subprocess in the Initial Phase
Samples Power (kW) Pulse duration (ms) Pulse frequency (Hz) Travel speed (mm/sec)
1 4.0 8.0 1.0 0.25 2 4.0 6.0 1.0 0.25 3 4.0 4.0 1.0 0.25 4 4.0 2.0 1.0 0.25 5 3.5 8.0 1.0 0.25 6 3.5 6.0 1.0 0.25 7 3.5 4.0 1.0 0.25 8 3.5 2.0 1.0 0.25 9 3.0 8.0 1.0 0.25 10 3.0 6.0 1.0 0.25 11 3.0 4.0 1.0 0.25 12 3.0 2.0 1.0 0.25 13 2.5 8.0 1.0 0.25 14 2.5 6.0 1.0 0.25 15 2.5 4.0 1.0 0.25 16 2.5 2.0 1.0 0.25
larger, however, a smaller sample size was chosen due to the unknown factor of the incorporation of the micro-foil materials (Childs et al., 2004). The variables that were manipulated for the pulse laser SLS subprocess were power and pulse duration. The values selected for the initial phase were similar to those used in other studies, though few studies have been performed using a pulse laser (Su et al., 2003). The sample size was 16 for the same reasoning as the continuous laser. The frequency and travel speed were held constant to produce a constant distance between pulses. The pulses were spaced 0.25mm apart to achieve a 75% overlap. The spaces in the samples were filled with a 316 SS powder of mesh size 125-325. Argon shielding was supplied through a shielding nozzle at a flow rate of 0.014 cumecs. The lasers were then used to join the materials with a 1mm focal spot size by scanning the surface of the micro-foils and powder at certain parameter settings seen in Table 1 and 2. The joining was done perpendicular to the direction of the micro-foil materials. Figure 15, shows a graphic representation of the SLS subprocesses.
Figure 15. Graphic depiction of the selective laser sintering process being used to join the micro-foil materials.
Laser Powder Deposition in the Initial Phase
Two subprocesses of LPD samples were produced in the initial phase. The first LPD subprocess was produced using a 500-watt continuous laser (Hass HL506D) and the second LPD subprocess was produced using a 5-kilowatt pulse laser (Hass HL54P). The parameters used in Phase 1 of the LPD subprocesses can be seen in Table 3 for the continuous laser subprocess and Table 4 for the pulse laser subprocess. Tables 3 and 4 had matching parameters to Tables 1 and 2 to allow for comparison of the SLS and LPD processes. The LPD subprocesses used the same fixture as the SLS subprocesses. The samples sizes were 16 for both the continuous and pulse LPD subprocesses. The sample Table 3
Parameter Settings for the Continuous LPD Subprocess in the Initial Phase
Samples Power (W) Travel speed (mm/sec)
1 400 1.0 2 400 2.0 3 400 3.0 4 400 4.0 5 300 1.0 6 300 2.0 7 300 3.0 8 300 4.0 9 200 1.0 10 200 2.0 11 200 3.0 12 200 4.0 13 100 1.0 14 100 2.0 15 100 3.0 16 100 4.0
Table 4
Parameter Settings for the Pulse LPD Subprocess in the Initial Phase
Samples Power (kW) Pulse duration (ms) Pulse frequency (Hz) Travel speed (mm/sec)
1 4.0 8.0 1.0 0.25 2 4.0 6.0 1.0 0.25 3 4.0 4.0 1.0 0.25 4 4.0 2.0 1.0 0.25 5 3.5 8.0 1.0 0.25 6 3.5 6.0 1.0 0.25 7 3.5 4.0 1.0 0.25 8 3.5 2.0 1.0 0.25 9 3.0 8.0 1.0 0.25 10 3.0 6.0 1.0 0.25 11 3.0 4.0 1.0 0.25 12 3.0 2.0 1.0 0.25 13 2.5 8.0 1.0 0.25 14 2.5 6.0 1.0 0.25 15 2.5 4.0 1.0 0.25 16 2.5 2.0 1.0 0.25
size was kept smaller for the same reasoning as discussed in the SLS section. The LPD processes used a powder feeder to inject the powder into the weld pool formed by the laser. The powder feeder used compressed argon as the carrier gas for the 316 ss powder of mesh size 125-325. The powder was feed through a nozzle at an angle of 45 degrees off of the sample. The powder feeder was set to a flow rate of 20g/min. The focal spot size of the laser was 1mm and the joining was done perpendicular to the micro-foil materials. Figure 16 shows a graphic representation of the LPD process.
Figure 16. Graphic representation of laser powder deposition being used to join the micro-foil materials.
Final Phase
In the final phase, the subprocesses that had produced continuous tracks were studied further to find the limiting and ideal parameter settings. The test matrices were further expanded to acquire the extra data points that were needed to find the limiting and ideal settings. The track profiles were further studied to find the effect of the parameters on profile shape along with track continuity. The results of the final phase provide a solution for the joining of spaced micro-foil materials with powder filler.
Continuous Selective Laser Sintering in the Final Phase
The continuous SLS subprocess setup for the final phase was similar to the set up for initial phase with two differences. The two differences were the variation in the foil
height and the sample size. The variation in height was held to 0.05mm so that the effect of height variation would be reduced. The sample size was increased to provide more information on track characteristics. The sample size was increase to 35 to find the points where the tracks became discontinuous. The increased sample size with corresponding parameters for the final phase can be seen in Table 5. It was decided that if the
discontinuous points could not be found with the parameter settings in Table 5, then the travel speeds would be increased along each power setting until the discontinuous points were found. Table 6 shows the final sample size with corresponding parameters that were needed to find all of the discontinuous points.
Pulse Selective Laser Sintering in the Final Phase
The pulse SLS subprocess setup for the final phase was similar to the initial phase except for the foil height variation and increased sample size to find the limiting points for the power and duration to form a continuous track. The height variation was kept to 0.05mm. The sample parameters were selected in a similar range to the initial phase but include lower values for the power and duration. The total number of samples was increased to 25 to find the lower limit of the process. The values for the final phase can be seen in Table 7.
Subproblems
The initial and final phases of the study investigated three subproblems to establish subprocess capabilities and selection criteria. The initial phase investigated
Table 5
Parameter Settings for the Continuous SLS Subprocess in the Final Phase
Samples Power (W) Travel speed (mm/sec)
1 500 1.0 2 500 2.0 3 500 3.0 4 500 4.0 5 500 5.0 6 500 6.0 7 500 7.0 8 400 1.0 9 400 2.0 10 400 3.0 11 400 4.0 12 400 5.0 13 400 6.0 14 400 7.0 15 300 1.0 16 300 2.0 17 300 3.0 18 300 4.0 19 300 5.0 20 300 6.0 21 300 7.0 22 200 1.0 23 200 2.0 24 200 3.0 25 200 4.0 26 200 5.0 27 200 6.0 28 200 7.0 29 100 1.0 30 100 2.0 31 100 3.0 32 100 4.0
Table 6
Extended Parameter Settings Needed for Finding the Continuity Points for the Continuous SLS Subprocess in the Final Phase
Samples Power (W) Travel speed (mm/sec) Samples Power (W) Travel speed (mm/sec)
1 500 1.0 35 400 13.0 2 500 2.0 36 400 14.0 3 500 3.0 37 400 15.0 4 500 4.0 38 400 16.0 5 500 5.0 39 400 17.0 6 500 6.0 40 400 18.0 7 500 7.0 41 300 1.0 8 500 8.0 42 300 2.0 9 500 9.0 43 300 3.0 10 500 10.0 44 300 4.0 11 500 11.0 45 300 5.0 12 500 12.0 46 300 6.0 13 500 13.0 47 300 7.0 14 500 14.0 48 300 8.0 15 500 15.0 49 300 9.0 16 500 16.0 50 300 10.0 17 500 17.0 51 300 11.0 18 500 18.0 52 300 12.0 19 500 19.0 53 300 13.0 20 500 20.0 54 300 14.0 21 500 21.0 55 200 1.0 22 500 22.0 56 200 2.0 23 400 1.0 57 200 3.0 24 400 2.0 58 200 4.0 25 400 3.0 59 200 5.0 26 400 4.0 60 200 6.0 27 400 5.0 61 200 7.0 28 400 6.0 62 100 1.0 29 400 7.0 63 100 2.0 30 400 8.0 64 100 3.0 31 400 9.0 65 100 4.0 32 400 10.0 66 100 5.0 33 400 11.0 67 100 6.0 34 400 12.0 68 100 7.0
Table 7
Parameter Settings for the Pulse SLS Subprocess in the Final Phase
Samples Power (kW) Pulse duration (ms) Pulse frequency (Hz) Travel speed (mm/sec)
1 4.0 8.0 1.0 0.25 2 4.0 6.0 1.0 0.25 3 4.0 4.0 1.0 0.25 4 4.0 2.0 1.0 0.25 5 4.0 1.0 1.0 0.25 6 3.5 8.0 1.0 0.25 7 3.5 6.0 1.0 0.25 8 3.5 4.0 1.0 0.25 9 3.5 2.0 1.0 0.25 10 3.5 1.0 1.0 0.25 11 3.0 8.0 1.0 0.25 12 3.0 6.0 1.0 0.25 13 3.0 4.0 1.0 0.25 14 3.0 2.0 1.0 0.25 15 3.0 1.0 1.0 0.25 16 2.5 8.0 1.0 0.25 17 2.5 6.0 1.0 0.25 18 2.5 4.0 1.0 0.25 19 2.5 2.0 1.0 0.25 20 2.5 1.0 1.0 0.25 21 2.0 8.0 1.0 0.25 22 2.0 6.0 1.0 0.25 23 2.0 4.0 1.0 0.25 24 2.0 2.0 1.0 0.25 25 2.0 1.0 1.0 0.25
subproblem 1 and categorized track formations produced by the four subprocesses as continuous or discontinuous. The subprocesses that produced continuous track formations were further investigated in the final phase. The final phase investigated subproblems 2 and 3. The purpose of subproblem 2 was to identify the maximums and minimums for the track profile dimensions which created selection criteria based on desired track profile dimensions. The purpose of subproblem 3 was to characterize the subprocesses based on
distortion and cycle time values to establish selection criteria for various applications. Through the three subproblems the study established; which of the four subprocesses were able to join the micro-foil material into a lattice structures with a continuous track; the maximum and minimum track profile dimensions obtainable for a continuous track; and provided a comparison of subprocesses based on distortion and cycle time values to establish selection criteria.
Subproblem 1: To identify the samples produced by the four subprocesses as continuous or discontinuous based on track continuity.
The purpose of subproblem 1 was to categorize the track formations as continuous or discontinuous from the initial phase and identify which of the subprocesses would be further studied in the final phase. The results of the initial phase were used to answer subproblem 1. The samples that were produced in the initial phase according to Tables 1, 2, 3, and 4 were categorized into two groups, continuous and discontinuous. The ability for a subprocess to produce continuous tracks was the criteria for the process to be further studied in the final phase. The use of an initial phase and subproblem 1 allowed the quick establishment of subprocess capability and permitted the study to focus on the capable subprocesses in the final phase.
Subproblem 2: While maintaining continuous track continuity, identify the maximum and minimum dimensions obtainable for track penetration and width to establish selection criteria for various applications.
The purpose of subproblem 2 was to identify the maximums and minimums for the track profile dimensions which allowed the processes to establish selection criteria
based on desired track profile dimensions. The final phase samples that were categorized as continuous were sectioned, polished, and etched to reveal the track profile in the micro-foil and powder. The penetration and width of the profiles were measured to find the range of dimensions that were achievable for each subprocess. The identification of maximum and minimum dimensions in subproblem 2 was the first step in establishing selection criteria for the subprocesses.
Subproblem 3: To analyze the subprocesses based on distortion and cycle time values to further establish selection criteria for various applications.
The purpose of subproblem 3 was to further establish a selection criteria based on distortion and cycle time values through further study of the continuous samples from the final phase. The gap distance in the samples was measured before and after processing. Distortion was evaluated by comparing the calculated averages and standard deviation of the measurements. The cycle times were found for each parameter set and categorized by profile dimensions. Subproblem 3, in combination with subproblem 2, provided the information necessary to establish selection criteria for a subprocess base on application need.
Summary of Methodologies
For this study, a two-phase design was used to study the SLS and LPD processes. The two phases were used to help improve the efficiency and effectiveness of the study. The initial phase was used to gather basic data on the processes and to eliminate
additional data on the remaining parameters and to establish selection criteria. The three subproblems provided information on the characteristics of each process and their ability to be used for various applications.
CHAPTER IV
INITIAL PHASE RESULTS AND CONCLUSIONS Introduction
Engineering problems that require the joining of micro-foil materials into lattice structures have proved to be difficult due to the strong tendency of the traditional joining processes to burn through, distort, or form weak bonds. The use of continuous and pulse SLS and continuous and pulse LPD have been studied to examine their capability to join micro-foil materials into lattice structures. The purpose of the initial phase was to gather data on the four subprocesses to answer subproblem 1. Subproblem 1 established which of subprocess were capable and permitted the study to focus on the capable subprocesses in the final phase.
Subproblem 1
Subproblem 1: To identify the samples produced by the four subprocesses as continuous or discontinuous based on track continuity.
Selective Laser Sintering for Subproblem 1
Two SLS subprocesses were used in the initial phase. The first process incorporated a continuous laser while the second used a pulse laser. In answering subproblem 1, the processes were categorized based on track continuity. General trends were seen in the track surface profile, width, and mushy zone and were reported in the results for each SLS subprocess.
Continuous Selective Laser Sintering for Subproblem 1
In the initial phase, the continuous SLS subprocess produced continuous and discontinuous tracks. The processed samples can be seen in Figure 17. The parameter settings of 100, 200, 300, and 400 watts along with 1, 2, 3, and 4 mm/s were used. The samples with the parameter setting of 100 watts were all found to be discontinuous regardless of travel speed. The parameter settings of 200, 300, and 400 watts produced continuous tracks regardless of travel speed.
Figure 17. The results of the initial phase for the continuous SLS subprocess. Magnification 20X.
100 200 300 400
Continuous Laser Sintered Tracks
Travel Speed (mm/s) Power (W)
Although the samples in the 100-watt setting appeared to be continuous, upon removal from the fixture the samples broke apart at the discontinuous points. Under higher magnification, the discontinuous points appeared in the balled regions of the track. The balled regions were most likely formed by the low power level of the laser combined with increasing travel speeds. This phenomenon follows the results of previous studies about the balling effect in the SLS process (Su et al., 2003; Tolochko et al., 2004). The balling effect was also seen as the travel speed was increased in the other power settings. The track surfaces went from a flat profile to a rounded profile then ending with a balled and discontinuous track surface.
Like the track surfaces, trends could be seen in the track widths. The track widths were wider or more pronounced in the higher power samples and began to become narrower as the power was decreased. The travel speed had a similar effect with a wider bead in the slower travel speeds. The slower travel speeds also produced a larger mushy zone, which was the partial fusing of the powder materials adjacent to the track. The mushy zone generally refers to a region where temperature was between the liquidus and solidus. The mushy zone can be seen adjacent to the tracks in the higher power and slower travel speed range.
The continuous SLS subprocess was capable of joining micro-foil materials into lattice structures with continuous tracks. The results, seen in Figure 17, show the
continuous and discontinuous samples that were produced by the subprocess. The continuous SLS subprocess was determined to be an acceptable process meeting the criteria specified in subproblem 1. As a result, the continuous SLS subprocess was
studied further in the final phase. Pulse Selective Laser Sintering for Subproblem 1
The pulse SLS subprocess produced continuous tracks. The processed samples are shown in Figure 18. Parameter settings of 2.5, 3.0, 3.5, and 4.0 kilowatts along with 2.0, 4.0, 6.0, and 8.0 milliseconds were used. The results for pulse SLS subprocess showed that regardless of parameter settings all of the samples produced continuous tracks.
Although the samples appeared to be continuous, the track surface profiles
Figure 18. The results of the initial phase for the pulse SLS subprocess. Magnification 20X.
Pulsed Laser Sintered Tracks
Pulse Duration (ms) 2.0 4.0 6.0 8.0 2.5 3.0 3.5 4.0 Power (kW)
showed rounding and balling. Under higher magnification, all of the tracks exhibit a rounded or balled surface profile. The rounded and balled surface profiles were most likely caused by the short duration of the pulse, which allowed the powder to ball up due to surface tension, but did not allow enough time for the ball to wet on the surface of the sample. This phenomenon follows the results of previous studies about the balling effect in the SLS process (Agarwala et al., 1995). The balling effect was more pronounced in the lower power and lower pulse duration settings.
Like the track surfaces, trends could be seen in the track widths. The track widths were wider or more pronounced in the higher power settings or higher pulse duration settings. The tracks began to become narrower as the power or duration was decreased. Regardless of the parameter settings, the presence of the mushy zone was not seen adjacent to the track in the pulse SLS subprocess
The pulse SLS subprocess was capable of joining micro-foil materials into lattice structures with continuous tracks. The results seen in Figure 18, show the continuous samples that were produced by the subprocess. The pulse SLS subprocess was
determined to be an acceptable process meeting the criteria specified in subproblem 1. As a result, the pulse SLS subprocess was studied further in the final phase.
Laser Powder Deposition for Subproblem 1
Two LPD subprocesses were used in the initial phase. The first process incorporated a continuous laser while the second used a pulse laser. In answering subproblem 1, the processes were categorized based on track continuity. General trends
for the track surface profiles, if apparent, were reported in the results for each LPD subprocess.
Continuous Laser Powder Deposition for Subproblem 1
The continuous LPD subprocess did not produce continuous tracks. The
processed samples can be seen in Figure 19. The parameter settings of 100, 200, 300, and 400 watts and 1, 2, 3, and 4 mm/s were used. The subprocess was not capable of forming tracks regardless of the parameter settings and tended to form balled protrusions and/or failed to achieve bonding to the samples. The 100 watt setting did achieve initial bonding but upon removal from the fixture the track or protrusion broke off of the sample. A similar issue was seen in the 200 watt samples with travel speeds of 3 and 4 mm/s. The other parameter settings produced bonded formations that were discontinuous. The slower travel speeds tended to build large protrusions that resembled a staircase structure. The other samples produce a track but under visual and optical observation, numerous discontinuities were seen in the track.
The inability to form continuous tracks was caused by the turbulence from the gas carrying the powder deflecting off of the micro-foil materials. The powder material would be deflected toward the top of the track. As the deflected powder was melted into the track the track began to grow vertically as well as horizontally, which produced the stair case structure. Figure 20 shows the turbulence caused by this interaction. Turbulence has been reported in other studies as a main cause for deformities in the track formations (Lin & Hwang, 2001).
Figure 19. The results of the initial phase for the continuous LPD subprocess. Magnification 20X.
The continuous LPD subprocess was not capable of joining micro-foil materials into lattice structures with continuous tracks. The results seen in Figure 19 show the discontinuous samples that were produced by the subprocess. The continuous LPD subprocess was determined to be an unacceptable process not meeting the criteria specified in subproblem 1. As a result, the continuous LPD subprocess was not further studied in the final phase.
Travel Speed (mm/s) Power (W) 100 200 300 400
Continuous Laser Powder Deposition Tracks
Figure 20. The turbulence created from the interaction of the carrier gas with the micro- foil materials.
Pulse Laser Powder Deposition for Subproblem 1
The pulse LPD subprocess produced continuous and discontinuous tracks; however, severe cracking was seen in the continuous tracks. The processed samples can be seen in Figure 21. The parameter settings of 2.5, 3.0, 3.5, and 4.0 kilowatts along with 2.6, 5.0, 7.6, and 10.0 milliseconds were used. The cracking was seen in all the samples and cannot be attributed to a particular parameter setting (e.g., power or pulse duration).
An example of the severe cracking can be seen in Figure 22. The cracking was always seen in-between the micro-foil materials. The cause of the cracking was not the focus of the studied and will not be further investigated, however, it should be noted that
Figure 21. The results of the initial phase for the pulse LPD subprocess. Magnification 20X.
Figure 22. A typical crack seen in the pulse LPD samples upon microscopy inspection. Magnification 40X. Power (kW) 2.5 3.0 3.5 4.0
Pulsed Laser Powder Deposition
2.0 4.0 6.0 8.0
the cracking was the defect that did not allow any of the samples to be accepted. No previous studies have focused on the joining of microfoil materials into lattice structures; therefore, there was no study to compare with on the issue of cracking.
The pulse LPD subprocess was not capable of joining micro-foil materials into lattice structures with acceptable continuous tracks. The results seen in Figure 21 show the continuous and discontinuous samples that were produced by the subprocess. The continuous samples were unacceptable due to the severe cracking seen. The pulse LPD subprocess was determined to be an unacceptable process not meeting the criteria specified in subproblem 1. As a result, the pulse LPD subprocess was not further studied in the final phase.
Summary of Subproblem 1
The results of the initial phase showed that the SLS subprocesses were capable of joining the micro-foil materials into lattice structures with continuous tracks. The LPD subprocesses were not capable of joining the micro-foil materials into lattice structures with continuous tracks. From these results, the two SLS subprocesses were studied further in the final phase, while the two LPD subprocesses were not further studied as a result of discontinuous track formation.
CHAPTER V
FINAL PHASE RESULTS AND CONCLUSIONS Introduction
The problem of joining micro-foil materials into lattice structures has been difficult due to several factors. The initial phase results proved through the use of continuous and pulse SLS subprocesses, the proper joining of micro-foil materials with continuous tracks was possible. The purpose of the final phase was to further investigate the successful subprocesses identified by subproblem 1. The two SLS subprocesses meet the criteria of subproblem 1 by demonstrating the ability to produce continuous tracks, as a result the subprocesses were further studied. The two LPD subprocesses did not meet the requirements of subproblem 1 by producing discontinuous tracks, as a result the two subprocesses were not further studied. Subproblems 2 and 3 developed selection criteria based on track profile, distortion, and cycle time.
Subproblem 2
Subproblem 2 states—while maintaining continuous track continuity, identify the maximum and minimum dimensions obtainable for track penetration and width to
establish selection criteria for various applications. Subproblem 2 had two sections that needed to be addressed for each subprocess. The first was to identify parameter settings that would maintain continuous track continuity and the second was to identify the maximum and minimum profile dimensions.
Continuous Selective Laser Sintering for Subproblem 2
In the final phase of the study, the factors for maintaining track continuity and the maximum and minimum profile dimensions needed to be identified for the continuous SLS subprocess. To identify the factors for maintaining track continuity, a parameter study was preformed and analyzed. For developing selection criteria based on track profile dimensions, the samples produced in the parameter study were sectioned and measured. The results defined the factors necessary to maintain track continuity and provided data to develop selection criteria for the track profile dimensions for the continuous SLS subprocess.
The parameter study results provided data necessary to determine the boundary between continuous and discontinuous tracks. The processed samples can be seen in Figure 23 in a top-down orientation. The samples with the parameter setting of 100 watts were discontinuous regardless of travel speed setting. The 200-watt setting produced continuous tracks with travel speeds from 1 to 5 mm/sec. The 300-watt setting produced continuous tracks with travel speeds from 1 to 9 mm/sec. The 400-watt settings produced continuous tracks with travel speeds from 1 to 13 mm/sec. Finally, the 500-watt setting produced continuous tracks with travel speeds from 1 to 18 mm/sec. The results of the parameter study, as seen in Figure 23, matched those found earlier in the initial phase.
In addition, the similarity of results from the initial phase to the final phase showed that the change in foil height variation had no effect on track continuity. The continuous SLS subprocess was able to produce enough penetration in both phases to join
100 200 300 400 500 P ower (W ) 1 2 3 4 5 6 7 8 9 1 0 1 1 1 2 13 14 1 5 1 6 1 7 1 8 1 9 Travel Speed ( mm/s ec)
Continuous Laser Sintered Tracks
Figure 23
. T
he results of the final phase for the
continuous S
L