Who Links to Whom: Mining Linkage between Web Sites
Krishna Bharat, Bay-Wei Chang, Monika Henzinger
Google Inc.
Mountain View, CA 94043, USA
{
krishna,bay,monika
}
@google.com
Matthias Ruhl
MIT Laboratory for Computer Science
Cambridge, MA 02139, USA
[email protected]
Abstract
Previous studies of the web graph structure have focused on the graph structure at the level of individual pages. In actuality the web is a hierarchically nested graph, with domains, hosts and web sites introducing intermediate levels of affiliation and administra-tive control. To better understand the growth of the web we need to understand its macro-structure, in terms of the linkage between web sites. In this paper we approximate this by studying the graph of the linkage between hosts on the web. This was done based on snapshots of the web taken by Google in Oct 1999, Aug 2000 and Jun 2001. The connectivity between hosts is represented by a directed graph, with hosts as nodes and weighted edges represent-ing the count of hyperlinks between pages on the correspondrepresent-ing hosts. We demonstrate how such a “hostgraph” can be used to study connectivity properties of hosts and domains over time, and discuss a modified “copy model” to explain observed link weight distributions as a function of subgraph size. We discuss changes in the web over time in the size and connectivity of web sites and country domains. We also describe a data mining application of the hostgraph: a related host finding algorithm which achieves a precision of 0.65 at rank 3.
1. Introduction
The web is a hierarchically nested graph, with domains, web sites, and individual pages introducing different levels of affiliation and administrative control. A web page is the elementary unit. Pages usually tend to be under the editorial control of a single entity (person or organization). A web site is a collection of web pages affiliated to a single entity. A domain (short for top-level domain) consists of a collec-tion of web hosts, all of which share the same last token in the host name (e.g., .comor.uk). Most domains are associated with individual countries, though there are large domains such as.comand.netthat are not geographical. Previous studies [4, 3, 8] of the web graph structure have focused on the graph structure at the level of individual pages. However, web sites might introduce a more appro-priate level of abstraction:
• Documents are frequently represented by multiple web pages. For example, documents authored with Mi-crosoft Powerpoint are often published as a chain of inter-linked web pages. Consequently, the full hyper-document rather than the individual pages may be the right level of granularity for analysis. Bibliometric studies analyze the citation or cocitation between thors, usually considering linkage to or from an au-thor’s work in aggregate. To study web authors analo-gously, web sites may be the right level.
• Since the entity that owns a web site has control over all parts, the content within a site may be reorganized or revised periodically without significantly changing the semantics or linkage relative to the rest of the web. This argues for separating the analysis of inter- and intra-site linkage.
• Concerns have been raised about accessibility of con-tent on the web. E.g., in [8] it was shown that the “dis-tance” between pages on the web is quite large with often no directed path being available.1 This fails to
account for the fact that within a given web site there are implicit paths from all pages to the “root page” (users often truncate the path of the URL to navigate to the root page), from which there should be author-designed paths to all local content. Thus navigation within a web site is often less challenging than would appear from a naive analysis of the linkage. If we as-sume that sites are internally fully navigable, then the inter-linkage between sites becomes the main factor in determining the accessibility of web-wide content. • Since generating pages is cheap, some sites may
gen-erate a large number of pages (potentially an infinite number which are dynamically generated), skewing statistical properties that people may want to study. In this paper we attempt to study the web on the web site level. However, determining which pages belong to the
1Note that search engines provide random access to web content which these studies do not currently account for.
same web site is an open problem, although some heuristic approaches have been proposed, see e.g. [15]. We approx-imate each web site by all the pages with the same host name2and study the following weighted hostgraph: Each node represents a web host, and each directed edge repre-sents the hyperlinks from pages on the source host to pages on the target host. The weight of the edge corresponds to the number of such hyperlinks.
Which properties between web hosts are interesting to study? (a) Obviously one wants to determine its size in terms of nodes and edges and observe how it changes over time. (b) Since the “average degree of separation” on the web has received considerable attention on the page level [4, 8] it is interesting to study it in this coarser grain ab-straction. (c) It is also interesting to see how the host level abstraction relates to the domain level abstraction, specif-ically to study the linkage of hosts in different domains. (d) Previous work [12, 8] has shown the Zipfian nature of the indegree and outdegree distribution of the page graph. It is therefore an interesting question whether the host-graph distributions are Zipfian as well. This evidence of self-similarity would support the conjecture by previous re-searchers [8] that the web graph has a fractal nature.
Our main contribution in this paper is the abstraction of a hostgraph, intended as a tool to study the web’s proper-ties and extract useful structures from it. To the best of our knowledge such an abstraction has not been previously defined in the literature, and nor has it been explictly com-puted and used for analyzing the web. We present data from three experiments (Section 2) to confirm that the web graph studied at this level exhibits many of the properties observed at the page graph level (Section 4). We use the data to sug-gest a host-level “copy model” (Section 7) to explain the connectivity seen in the hostgraph, as an extension of a pre-vious page-level copy model. We look at accessibility of content on the web at the host level (Section 3) factoring out intra-site navigability. To understand the effects of language and geography on the web structure we look at the connec-tivity between top level domains (Section 5). In addition to its use as a analytical tool, we intended the hostgraph to be a suitable resource for data mining. We illustrate this with examples of extracting related hosts based on linkage and co-citation (Section 6). Section 8 discusses related work.
2. Datasets
For a given snapshot of the web, a hostgraph can be com-puted as follows. In a linear scan through all pages, for ev-ery cross-host link we write the corresponding ordered pair
2Note that this is just a heuristic since a web site can be comprised of many host names (e.g.,www.intel.comandsupport.intel.com
can both be considered part of the Intel web site) and inversely a host can host many web sites, (e.g.,members.aol.comis a collection of web sites of individuals and small organizations).
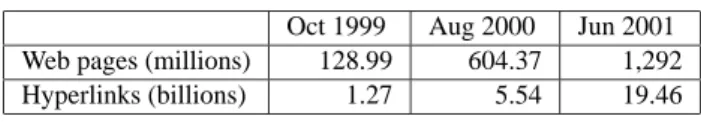
Oct 1999 Aug 2000 Jun 2001 Web pages (millions) 128.99 604.37 1,292 Hyperlinks (billions) 1.27 5.54 19.46
Table 1.Web graphs underlying the hostgraphs.
of hosts to a log. At the end of the pass, the log is sorted and in a linear scan contiguous occurrences of each distinct ordered host pair are counted. Each ordered host pair cor-responds to an edge in the hostgraph, and the occurrence count in the log corresponds to its weight.
We ran our experiments with three snapshots of the web, which were subsets of crawls by Google in October 1999, August 2000, and June 2001. In each case the dataset was restricted to the set of hosts reachable from a well known reference host with high in and out degree in the hostgraph. We used www.w3.org, which hosts the web site of the World Wide Web Consortium, as our reference host. The exact choice of reference host is unimportant as long as we are certain that it is part of the central strongly connected component in the hostgraph, which includes all the major international hubs. E.g., usingwww.cern.ch,
www.yahoo.com, orwww.dmoz.orgas the reference host would have produced exactly the same hostgraph since they can both reach and are reachable fromwww.w3.org
by a directed path of inter-host hyperlinks.
For the June 2001 data set this restricted the number of nodes in the hostgraph to 12.8 million and the number of edges to 395 million. The sum of all the edge weights (i.e., the number of links between the hosts in the web graph) was 4.7 billion. This hostgraph was computed from a web graph consisting of 1.3 billion web pages, which were connected by 19.5 billion hyperlinks. It follows that 14.8 billion edges, or 76% of the edges, link to pages on the same host. In fact, this figure has stayed constant at 76% across the three hostgraphs.
Below we give the data for the data sets. Table 1 shows the number of web pages and their links that are contained in the hostgraphs.
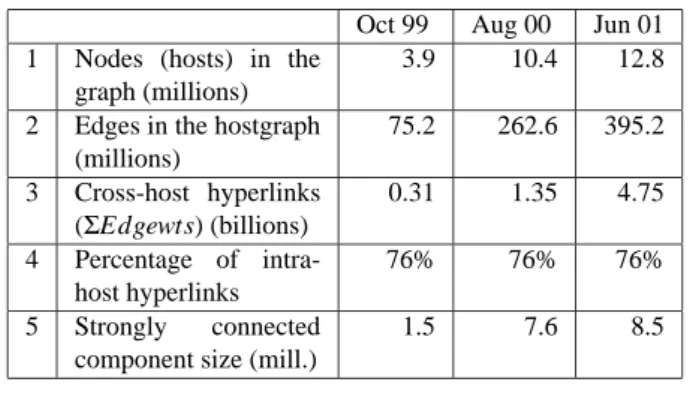
Table 2 gives aggregate statistics for the three host-graphs. Row 3 counts the set of hyperlinks between pages on distinct hosts, which corresponds to the sum of edge weights in the hostgraph, whereas row 2 counts the set of distinct edges in the hostgraph, ignoring weights.
Row 5 counts the number of hosts which are in the strongly connected component ofwww.w3.org, i.e., hosts which can reachwww.w3.orgas well as be reached by
www.w3.orgthrough a directed path of hostgraph edges. Note that the existence of a path in the hostgraph does not imply that there is a path in the page-based web graph, al-though the reverse is true. Hence, this only provides an upper bound on the number of hosts in the largest strongly
Oct 99 Aug 00 Jun 01 1 Nodes (hosts) in the
graph (millions)
3.9 10.4 12.8 2 Edges in the hostgraph
(millions) 75.2 262.6 395.2 3 Cross-host hyperlinks (ΣEdgewts) (billions) 0.31 1.35 4.75 4 Percentage of intra-host hyperlinks 76% 76% 76% 5 Strongly connected component size (mill.)
1.5 7.6 8.5
Table 2.Hostgraphs used in the measurements.
Oct 99 Aug 00 Estimated unweighted
aver-age distance between hosts
4.11 5.27 Estimated weighted average
distance between hosts
3.31 3.71
Table 3.Average distances between hosts.
connected component in the web graph.
In the following we will use indegree to represent the number of distinct edges incident on a node in the host-graph (i.e., the number of distinct hosts which link to the corresponding host), and weighted indegree the sum of their edge weights incident on a node (i.e., the number of hyper-links to pages on corresponding host from other hosts) and likewise for outdegree and weighted outdegree.
3. Average Distance Between Hosts
The distance between two hosts is the length of the short-est path between them measured in number of edges. We es-timated the average distance between any two hosts for two of the graphs. To estimate the average distance we picked 5000 random hosts from the strongly connected component containingwww.w3.organd computed for each host the distance from it to every other host in the host graph. The average distance was computed by averaging the individual distances observed.
As Table 3 shows, the average distance increased from roughly 4 in the Oct 1999 dataset to roughly 5 in the Aug 2000 dataset. A possible explanation is that new hosts are not linked to as much as older hosts and thus the path to them is longer.
Let DW be the average number of cross-host links tra-versed by the shortest path between two pages in the web graph.
Note that the average distance DH in the host graph is in general neither an upper nor a lower bound for DW in the web graph: DH is not an upper bound on DW since the
shortest path in the web graph might not be the one that min-imizes the cross-host links. DH is not a lower bound on DW since it is averaged over all pairs of hosts while DW is aver-aged over all pairs of pages. Consider for example a graph where the hosts form a chain, while almost all pages are contained in two adjacent hosts forming one large clique. Then DW will be close to 1 while DH will be linear in the number of hosts.
Because of this, we also estimated the weighted aver-age distance where each host is weighted by the number of pages on it. The weighted average distance is a true lower bound on DW . It is not an upper bound by the same ar-gument as for the unweighted average distance. Table 3 shows that the weighted average distance has increased as well. Note that the weighted average is smaller than 4, i.e. smaller the unweighted average. It follows that the pages are not equally spread out over the hosts, but that instead there is a “core” of hosts whose average distance is smaller than 4 that contains most of the pages.
4. Inverse Power Law Distributions
Previous papers have observed that various properties of the web graph follow a Zipfian distribution (a function of the form 1/nk): Kumar et al. [14] show that the fraction of web pages with indegree i is roughly proportional to 1/i2. Barbarasi and Albert [4] report a Zipfian exponent of 2.1 for the indegree distribution and they also show that the fraction of web pages with outdegree i is roughly propor-tional to 1/i2.45. In a recent paper Broder et al. [8] reported an indegree exponent of 2.1 and an outdegree exponent of 2.72. They also showed that the fraction of connected com-ponents in the undirected graph has a Zipfian distribution.
We show that the link structure at a coarser granularity, namely at the level of hosts and domains, also follows a Zipfian distribution. More specifically, the fraction of hosts of the host graph with weighted indegree i is (roughly) pro-portional to 1/i1.62 and the fraction of hosts of the host-graph with weighted outdegree i is (roughly) proportional to 1/i1.67. We plot these functions in Figure 13. In Sec-tion 6 we give a possible explanaSec-tion why the values for low weighted degree nodes are smaller than predicted by the Zipfian distribution.
We also investigated the distribution of weighted in-and out- degrees for subsets of the hosts in the hostgraph, namely for top level domains such as .com and .uk. For each such subset the weighted indegree and outdegree dis-tributions are again Zipfian. However, the size of the Zipfian exponent increases with the number of hosts in the domain. Figure 2 plots the Zipfian exponent for weighted indegrees and outdegrees versus the log of the number of hosts in the
3The “hump” in the second graph is due to a “spam” cluster of 200,000 highly interconnected hosts
1 10 100 1000 10000 100000 1e+006 1e+007 1e+008 1 10 100 1000 10000 100000 Number of Hosts Weighted Indegree Oct 1999 Aug 2000 Jun 2001 Oct exp 1.73 Aug exp 1.80 Jun exp 1.62 1 10 100 1000 10000 100000 1e+006 1e+007 1e+008 1 10 100 1000 10000 100000 Number of Hosts Weighted Outdegree Oct 1999 Aug 2000 Jun 2001 Oct exp 1.70 Aug exp 1.80 Jun exp 1.67
Figure 1.Weighted degrees are Zipf distributed.
domain. Both Zipfian exponents seem to slowly increase with the logarithm of the size of the domain, suggesting an exponent of the form a+b log n where n is the number of hosts in the domain. In Section 7 we provide a possible explanation for this behavior.
Lastly, the distribution of edge weights in the hostgraph, i.e., the number of distinct hyperlinks between ordered pairs of hosts, is Zipf distributed (see Figure 3).
5. Country Domain Linkage
Table 4 shows some of the affinity between top level country domains in the June 2001 hostgraph. The 20 source domains with the highest weighted outdegree are included in the table; the .com domain is also included for compar-ison. For each source domain, we list the percentage of weighted outdegree into the same domain, into the .com do-main, and into the four most highly linked country domains from that source domain.
In every case, there is a much higher number of links within the domain than to any other country domain; in fact, the next highest country domain typically receives around 1% of all links, in comparison to the 50-90% of intradomain links. There is also a much higher number of links to the
-1 -0.5 0 0.5 1 1.5 2 2.5 100 1000 10000 100000 1e+006 1e+007
Zipf Exponent for Indegrees
Number of Hosts in Domain
-1 -0.5 0 0.5 1 1.5 2 2.5 100 1000 10000 100000 1e+006 1e+007
Zipf Exponent for Outdegrees
Number of Hosts in Domain
Figure 2. Plots of Zipf exponent for weighted indegree and outdegree distributions as a function of domain size for the 144 largest top level domains.
.com domain, and even .net, and .org domains (not shown) usually have higher linkage than other countries, (on the order of 3-7%).
The table also shows that, of the country domains, .de and .uk dominate. This is due to the size of those domains – there are more hosts in each of these two domains than any other country domain except for .jp. With so many web pages in .de and .uk, it’s simply more likely that a host will point into those domains. .jp may not be as highly linked to due to language differences.
If we ignore the presence of .de and .uk in each coun-try domain’s top link destinations, we see that two other trends emerge. The first is that there is often strong ge-ographical connections between a source domain and its most highly linked to domains. For example, Germany’s most highly linked to domains are Switzerland, Austria, the Netherlands, and France. Norway’s are Sweden, Denmark, Estonia, Soviet Union, and Finland. New Zealand’s is Aus-tralia.
The linkages are not always reciprocal, however. For example, while China’s top linkages are to Taiwan, Japan,
1 10 100 1000 10000 100000 1e+006 1e+007 1e+008 1e+009 1 10 100 1000 10000 100000
Number of Host Pairs
Number of Hyperlinks
Oct 1999 Aug 2000 Jun 2001
Figure 3.Edge weights are Zipf distributed.
and Hong Kong, and Hong Kong’s are to Taiwan and China, China and Hong Kong do not show up in Taiwan’s linkages until positions 5 and 6 (again ignoring .de and .uk). As another example, New Zealand’s position on Australia’s list is not first, but fourth. Political and economic relationships might explain these asymmetries.
The other trend is that language affiliations can override geographical affiliations. The strongest example of this is Brazil’s top linkage to Portugal, and Portugal’s to Brazil. Spain doesn’t appear in Portugal’s linkages until position 5, despite its strong geographical connection to Portugal. There is also a strong English language affinity among US, UK, Australia, and New Zealand. Examples like this sup-port the intuition that linkages on the web are strongly in-fluenced by shared language.
6. Mining Related Web Hosts
A natural extension of previous work in connectivity based web data mining would be to look at ways to extract significant relationships between hosts on the web based on connectivity within the hostgraph. Previously Bharat et al. [5] explored the use of similarity in outdegree distributions between hosts to find mirrored web sites. This technique proved to be too weak to find mirrors. However, we found that it often yielded pairs of related or affiliated hosts, rather than true mirrors. This led us to using the hyperlink struc-ture of the hostgraph to discover related web hosts.
We examined two other forms of relatedness in the host-graph.
6.1. Relatedness by Link Frequency
A simple technique to find related hosts is based on the pruning of edges in the hostgraph based on edge weight. Only strong edges remain, revealing connections between hosts that are stronger than mere citation.
% of Weighted Outdegree
com self 1 2 3 4
com 82.9 net 6.5 org 2.6 jp 0.8 uk 0.7
au 27.0 58.8 uk 1.0 ch 0.5 ca 0.4 de 0.3 br 17.8 69.1 uk 0.4 pt 0.4 de 0.4 ar 0.2 ca 19.4 65.2 uk 0.6 fr 0.4 se 0.3 de 0.3 cn 15.8 74.1 tw 0.4 jp 0.2 de 0.2 hk 0.1 cz 8.1 82.4 sk 1.0 de 0.7 uk 0.4 ch 0.1 de 16.0 71.2 uk 0.8 ch 0.6 at 0.5 nl 0.2 dk 13.8 73.0 uk 1.1 de 1.0 int 0.7 no 0.7 es 38.9 42.3 de 1.3 uk 1.0 fr 0.5 int 0.3 fr 20.9 61.9 ch 0.9 de 0.8 uk 0.7 ca 0.5 it 19.3 64.6 de 1.0 uk 0.7 fr 0.4 ch 0.3 jp 17.4 74.5 to 0.8 cn 0.6 uk 0.2 de 0.1 kr 26.5 57.1 jp 0.6 uk 0.5 de 0.3 to 0.3 nl 21.2 61.7 de 1.3 uk 1.1 be 0.6 to 0.5 no 16.1 65.6 de 1.2 se 0.9 uk 0.7 dk 0.6 pl 4.2 92.2 de 0.2 uk 0.1 ch 0.1 nl 0.1 ru 10.0 84.9 ua 0.4 su 0.2 uk 0.2 de 0.2 se 22.6 60.0 nu 1.6 uk 0.9 de 0.7 to 0.6 tw 22.0 66.0 to 1.3 au 0.6 jp 0.6 ch 0.4 uk 34.2 45.9 de 0.7 ca 0.5 jp 0.3 se 0.3 us 34.4 33.1 ca 0.6 uk 0.5 au 0.2 de 0.2
Table 4.Most frequently linked to domains from country domains.
We pruned all edges in the graph with weight less than 500. Quantitatively this reduced the set of edges to 139,900 pairs in August 2000 (i.e., the number of ordered host pairs with at least 500 individual hyperlinks between their pages), and to 34,600 in Oct 1999.
We identified several explanations for strongly con-nected host pairs that didn’t seem to be otherwise related:
Large Hosts: Large hosts like www.geocities.com
and members.aol.com have high mutual edge weights by virtue of their immense size.
Boilerplate: Some hosts use a page template on all pages.
If this template has cross-host links it leads to a high edge weight. ( E.g., mirrors of Open Directory tend to point towww.dmoz.orgon every directory page. )
Multi-Host Sites: A site that spans multiple hosts may
have many references between the hosts; e.g.,
archive.soccerage.comhad 17 million links in the August dataset towww.soccerage.com.
Spam: A large factor is the activities of “search engine
optimizers” who try to manufacture highly connected graphs to promote specific web sites (especially for pornography).
Affiliate Programs: Web sites like Amazon encourage
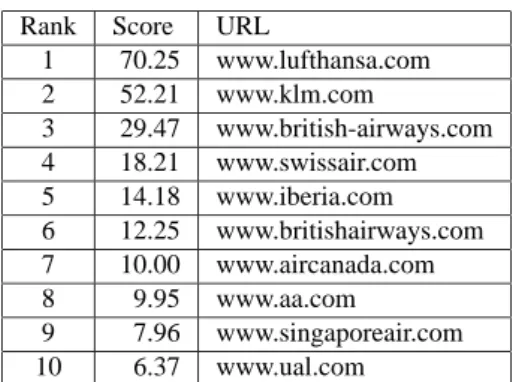
Rank Score URL 1 70.25 www.lufthansa.com 2 52.21 www.klm.com 3 29.47 www.british-airways.com 4 18.21 www.swissair.com 5 14.18 www.iberia.com 6 12.25 www.britishairways.com 7 10.00 www.aircanada.com 8 9.95 www.aa.com 9 7.96 www.singaporeair.com 10 6.37 www.ual.com
Table 5.Related hosts forwww.airfrance.com.
content on their site (e.g., specific books), rewarding them for the traffic sent through.
In addition to citation we could also use co-citation to identify affiliated or related parts of the web.
6.2. Relatedness by Co-citation
Dean and Henzinger [10] showed that cocitation anal-ysis on the web graph works well for finding related web pages. Their best algorithm achieved a precision @ 10 of 0.4. We extended the idea to the hostgraph. Our approach is as follows:
Let B be a set of up to 100 hosts that point to a given host S with outlink count<50. We impose this limitation on outlink count since hosts which link to lots of other hosts tend to introduce noise due to spurious co-citation. We con-sider a host, C, a candidate if it is pointed to by at least 4 hosts in B. Let BS(C)be the hosts in B that point to C.
We compute for each candidate, C, a score which is use to rank potential hosts, as follows:
SCORE(C) =K(C)·ΣX∈BS(C) W T(X,S)·W T(X,C) outdeg(X)2 where K(C) = |BS(C)| 2
max{1,indeg(C)/indeg(S)}.
Note that K(C)boosts candidates that are frequently co-cited with the start host, and simultaneously reduces the bias towards candidates that are highly popular link targets (i.e, candidates with high inlink counts). Both proved invaluable in improving precision.
For example on the querywww.airfrance.comthe algorithm gives the following results. We list them together with their score in table 5.
We collected the output of the algorithm for 100 ran-domly chosen hosts for which at least 1 related host was
generated. The top 3 results in each case were hand evalu-ated to compute the fraction of the returned results that were useful. Of these 21 would not load or were in a foriegn lan-guage, 14 were pornographic or spam hosts, and of the re-maining (159 pairs) 65% were found to be relevant. In other words our algorithm has a precision at 3 of 0.65.
7. Web Graph Modeling
7.1. Previous Graph Evolution Models
In recent years, a number of evolutionary models have been proposed to explain the structure of the web [12, 8]. Each model consists of a random process that creates a graph having properties similar to properties of the web, namely, Zipfian degree distributions and a large number of small bipartite cliques. Such modeling is useful for a variety of reasons. First, the process can explain how the web actu-ally evolves, which might be helpful for companies exploit-ing the web structure, such as search engines. Secondly, this can prompt further research, such as analyzing or modeling sociological and economic issues surrounding the internet.
Traditionally, these models were page-based, i.e. nodes corresponded to single pages, and edges corresponded to links between them. We first describe a model introduced for the page graph called the “copy model”. We then adapt it directly to the hostgraph setting. However, we show that this model does not agree with two key observations that we made on the hostgraph. We then propose a modified model for the hostgraph to accommodate both observations.
A first version of the “copy model” was introduced in [12]. Kumar et al [13] slightly modified it and analyzed it in detail. They showed that the model predicts a Zipfian indegree distribution. We present the second model:
• The web graph is created by adding one node u (i.e., a page) at a time, with a fixed outdegree d.
• Link destinations of u are randomly chosen:
– First, one picks a random existing node v. – Then for i=1,2, . . . ,d, the i-th link of u points to
a random existing node with probabilityα, and to the destination of v’s i-th link with 1−α. This corresponds to an author creating a new webpage on a topic by copying links from an already existing web-page. It has the natural effect that a page with many links pointing to it already is more likely to receive additional links pointing to it than a page that nobody links to.
This model can be used on the hostgraph (since the intu-ition holds) except for two unexplained observations:
1. The observed indegree distribution is almost, but not entirely Zipfian (see Figure 1). While the observed
frequencies agree almost perfectly with the prediction for high indegree hosts, the number of small inde-gree hosts is considerably smaller than predicted by the model. E.g., see Figure 1 where the data points fall below the line representing the Zipfian distribution. 2. The exponent in the Zipfian distribution in the copy
model depends only on α, and so stays constant in-dependent of the size of the web. As we observed in Figure 2, when restricted to individual countries these Zipfian exponents actually depend on the number of hosts in the particular country.
We now discuss how the copy model can be modified to account for these observations.
7.2. Our Hostgraph Model
We next suggest a modification to the copy model that would explain why we observe fewer hosts of low indegree than predicted by the model and also provide a possible ex-planation for the different Zipfian exponents. We call the model the “re-link model”.
• As before, the web graph is created in discrete time steps. At each time step, with probabilityβ, we select a random already existing node, u, and add new addi-tional out links to it. These out links are computed as follows:
– First, one picks a node v at random among all
already existing nodes. Second, one picks d ran-dom outgoing edges from v.
– Then for i=1,2, . . . ,d, the i-th new link of u
points to a random existing node with probabil-ityα, and to the destination of the i-th link picked from v with probability 1−α.
• With probability 1−β, we add a new node and then add out-links to it, just as in the copy model.
This model captures the fact that the web not only changes by adding hosts, but also by hosts changing what other hosts they link to (“re-linking”). It is different from the copy model because it makes it possible to add new links without adding new hosts. Since new hosts start out with in-degree 0, this reduces the number of low inin-degree hosts in comparison to the copy model. The parameterβcontrols how many new hosts are created. Ifβ=0 the re-link model reduces to the copy model.
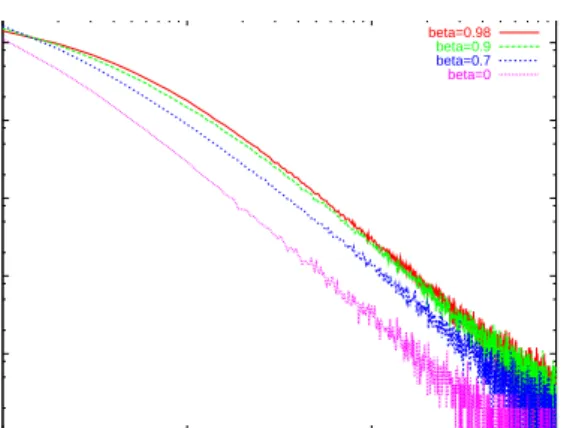
To verify our intuition we generated a graph of 1,000,000 nodes with d=7 andα=0.05 using the re-link model. Fig-ure 4 shows the indegree distribution for various values ofβ. The largerβbecomes, the smaller the probability that a new host is created and the more edges a graph with 1,000,000
1 10 100 1000 10000 100000 1 10 100 1000 No of Hosts In-degree beta=0.98 beta=0.9 beta=0.7 beta=0
Figure 4. indegree distribution as predicted by the “re-link model” with varyingβvalues.
nodes has. Thus, the curve flattens for low indegree hosts. Additionally, the curve becomes steeper, i.e., the Zipfian ex-ponent increases. One reason might be that hosts quickly grow from small indegree to medium indegree while it takes them longer to become large indegree hosts.
Thus, the model also provides a possible explanation for different Zipfian exponents for different domains. Different domains can have differentβvalues which leads to different Zipfian exponents. The Zipfian exponent grows inversely asβ. One way to interpret the parameterβis to say that it reflects the cost of establishing a new host versus creating new links from an already existing host. This cost can vary in different domain - the lesser developed the domain, the higher the cost of adding a new host is likely to be and hence the higher theβvalue. The higher theβvalue, the lower the Zipfian exponent, which explains the distributions seen in Figures 2.
8. Related Work
There is related work in the area of evolution of the web as well as in web graph analysis.
In the area of web evolution, Pitkow et al [17] presented a model that explains some factors in the survival and change dynamics of documents. Cho et al [9] computed the lifespan of pages in five different domains, namely .gov, .net, .org, .edu, and .com, and showed that it varies widely. Smaller studies on how often web pages change were performed by Wills et al [19] and Douglis et al [11]. Huberman et al [1] presented a theory for the growth dynamic of the Web that takes into account the growth rates in the number of pages per site, as well as the fact that new sites are created at dif-ferent times. Brewington [7] developed a difdif-ferent model of web page changes.
In the area of web graph analysis, Barbarasi et al [4] es-timated the diameter of the Web and presented the Zipfian
indegree and outdegree distributions of web pages (see also comments by Adamic et al [2] on this work.) Kumar et al [14] presented various properties of the web graph, one of them being the Zipfian distribution of indegrees as well. They also showed that the web contains a large number of small bipartite cliques. Kleinberg et al [12] presented a copy model, which was analyzed in detail in [13]. Broder et al. [8] analyzed the structure of the graph of web pages and predicted the shape of the web. They also gave a new es-timate of the web’s diameter disagreeing with Barbarasi et al.
9. Conclusions and Future Work
Our main contribution is the notion of the hostgraph, both as an abstraction to study the web, and as an explictly computed data-structure for use in profiling the growth of the web and for web data mining applications. We show that the hostgraph exhibits many of the properties of the web graph, providing another example of the fractal nature of web connectivity. A key contribution is the observation that the distributions of indegrees and outdegrees within top level domains of the web seem correlated with the size of the domain. We provide a modified “copy model” to explain this. We show, using three examples (data from Oct 1999, Aug 2000 and Jun 2001) that preserving host connectivity information can be useful in web monitoring and growth tracking. We present comparisons of changes in web site size and connectivity, inter-domain connectivity and web diameter estimate, to illustrate this. The host graph was also intended as a resource of data mining. We demonstrate how co-citation at the level of hosts can be mined and describe an algorithm which outputs related hosts with a precision of 0.65 at rank 3.
The hostgraph is only an approximation of what we would really like to compute - a graph of web sites. To achieve this one would need to combine multiple hosts un-der the some domain into the same node, which is not hard to do. One would also need to identify hosts that contain in-dividual web sites, e.g., educational institutions which host web sites belonging to students, and decompose them. This is an open problem. Several link based page clustering ap-proaches have been taken in the past to extract aggregates from hypertext, including strong connectivity [6], clustering based on routes likely to be taken by users [18], and spread-ing activation computations [16]. A combination of these techniques could be used in the future to decompose large host such asgeocities.cominto actual web sites. This, and the collapsing of multiple hosts that share the same do-main, will allow for the creation of “site graph” that more accurately reflects the linkage between web sites.
Acknowledgements: We would like to thank Daniel Dulitz
for computing the June hostgraph data.
References
[1] L. Adamic and B. Huberman. Evolutionary dynamics of the world wide web. Nature, September 1999.
[2] L. Adamic and B. Huberman. Scaling behavior on the world wide web. Science, 286, October 1999.
[3] R. Albert, H. Jeong, and A.-L. Barabasi. Diameter of the world wide web. Nature, 401:130–131, September 1999. [4] A. Barabasi and R. Albert. Emergence of scaling in random
networks. Science, 286:509, October 1999.
[5] K. Bharat, A. Broder, J. Dean, and M. Henzinger. A compar-ison of techniques to find mirrored hosts on the www.
Jour-nal of the American Society for Information Science, 2000.
[6] R. Botafogo and B. Shneiderman. Identifying aggregates in hypertext structures. In Proc. Hypertext ’91, Dec. 1991. [7] B. Brewington and G. Cybenko. How dynamic is the web?
In Proc. 9th WWW Conference, 2000.
[8] A. Broder, R. Kumar, F. Maghoul, P. Raghavan, S. Ra-jagopalan, R. Stata, A. Tomkins, and J. Wiener. Graph struc-ture in the web. In Proc. 9th WWW Conference, 2000. [9] J. Cho and H. Garcia-Molina. The evolution of the web and
implications for an incremental crawler. In VLDB 2000. [10] J. Dean and M. Henzinger. Finding related pages in the
world wide web. In Proc. 8th WWW Conference, 1999. [11] F. Douglis, A. Feldmann, B. Krishnamurthy, and J. Mogul.
Rate of change and other metrics: a live study of the world wide web. In Proc. USENIX Symposium on Internet
Tech-nologies and Systems, 1997.
[12] J. Kleinberg, S. R. Kumar, P. Raghavan, S. Rajagopalan, and A. Tomkins. The web as a graph: Measurements, models, and methods. In Proc. ICCC, 1999.
[13] R. Kumar, P. Raghavan, S. Rajagopalan, D. Sivakumar, A. Tomkins, and E. Upfal. Stochastic models for the web graph. In Proc. Conference on Foundations of Computer
Science (FOCS), 2000.
[14] R. Kumar, P. Raghavan, S. Rajagopalan, and A. Tomkins. Trawling the web for cyber communities. In Proc. 8th WWW
Conference, 1999.
[15] W. Li, N.F. Ayan, O. Kolak, and Q. Vu. Constructing multi-granular and topic-focused web site maps. In Proc. 10th
WWW Conference, 2001.
[16] P. Pirolli, J. Pitkow, and R. Rao. Silk from a sow’s ear: Extracting usable structure from the web. In Proc. ACM
SIGCHI, 1996.
[17] J. Pitkow and P. Pirolli. Life, death, and lawfulness on the electronic frontier. In Proc. ACM SIGCHI, 1997.
[18] K. Tajima, K. Hatano, T. Matsukura, R. Sano, and K. Tanaka. Discovery and retrieval of logical information units in web (invited paper). In Proc. ACM Digital Library
Workshop on Organizing Web Space (WOWS), 1999.
[19] C. Wills and M. Mikhailov. Towards a better understanding of web resources and server responses for improved caching. In Proc. 8th WWW Conf, 1999.