HEALTH SYSTEMS DATA INTEROPERABILITY AND IMPLEMENTATION
by
MANDLENKOSI NGWENYA
Submitted in accordance with the requirements for the degree of
MASTER OF SCIENCE
in the subject
COMPUTING
at the
UNIVERSITY OF SOUTH AFRICA
SUPERVISOR: PROF F O BANKOLE
i DECLARATION
1. I declare that “Health Systems and Data Management ” is my own work and that all the sources that I have used or quoted have been indicated and
acknowledged by means of complete references.
2. This study has never been submitted to any other institution or organization before.
3. I have used the 6th Edition of APA (American Psychological Association) for citation and referencing.
4. I have not allowed and will never allow anyone to copy my work for any intention.
___________________________
M. A. W Ngwenya January 2018
ii ACKNOWLEDGEMENTS
I would like to thank and appreciate my supervisor Professor Felix Bankole for his continuous support, guidance and the patience he displayed throughout the progress of my study.
I would like to thank my great friend Nomalungelo for the support and encouragement I received from her.
My gratitude goes to the language editors Genevieve Wood, and Sandy Tolosana for their effort in editing my work.
Lastly, I want to thank my God for the opportunity to study, the ideas and the passion He instilled in me for the field of science.
iii ABSTRACT
Objective
The objective of this study was to use machine learning and health standards to address the problem of clinical data interoperability across healthcare institutions. Addressing this problem has the potential to make clinical data comparable, searchable and exchangeable between healthcare providers.
Data sources
Structured and unstructured data has been used to conduct the experiments in this study. The data was collected from two disparate data sources namely MIMIC-III and NHanes. The MIMIC-III database stored data from two electronic health record systems which are CareVue and MetaVision. The data stored in these systems was not recorded with the same standards; therefore, it was not comparable because some values were conflicting, while one system would store an abbreviation of a clinical concept, the other would store the full concept name and some of the attributes contained missing information. These few issues that have been identified make this form of data a good candidate for this study. From the identified data sources, laboratory, physical examination, vital signs, and behavioural data were used for this study.
Methods
This research employed a CRISP-DM framework as a guideline for all the stages of data mining. Two sets of classification experiments were conducted, one for the classification of structured data, and the other for unstructured data. For the first experiment, Edit distance, TFIDF and JaroWinkler were used to calculate the similarity weights between two datasets, one coded with the LOINC terminology standard and another not coded. Similar sets of data were classified as matches while dissimilar sets were classified as non-matching. Then soundex indexing method was used to reduce the number of potential comparisons. Thereafter, three classification algorithms were trained and tested, and the performance of each was evaluated through the ROC curve. Alternatively the second experiment was aimed at extracting patient’s smoking status information from a clinical corpus. A sequence-oriented classification algorithm called CRF was used for learning related concepts from the given clinical corpus.
Hence, word embedding, random indexing, and word shape features were used for understanding the meaning in the corpus.
iv Results
Having optimized all the model’s parameters through the v-fold cross validation on a sampled training set of structured data ( ), out of 24 features, only ( 8) were selected for a classification task. RapidMiner was used to train and test all the classification algorithms. On the final run of classification process, the last contenders were SVM and the decision tree classifier. SVM yielded an accuracy of 92.5% when the and parameters were set to and . These results were obtained after more relevant features were identified, having observed that the classifiers were biased on the initial data. On the other side, unstructured data was annotated via the UIMA Ruta scripting language, then trained through the CRFSuite which comes with the CLAMP toolkit. The CRF classifier obtained an F-measure of 94.8% for “nonsmoker” class, 83.0% for “currentsmoker”, and 65.7% for “pastsmoker”. It was observed that as more relevant data was added, the performance of the classifier improved. The results show that there is a need for the use of FHIR resources for exchanging clinical data between healthcare institutions. FHIR is free, it uses: profiles to extend coding standards; RESTFul API to exchange messages; and JSON, XML and turtle for representing messages. Data could be stored as JSON format on a NoSQL database such as CouchDB, which makes it available for further post extraction exploration.
Conclusion
This study has provided a method for learning a clinical coding standard by a computer algorithm, then applying that learned standard to unstandardized data so that unstandardized data could be easily exchangeable, comparable and searchable and ultimately achieve data interoperability. Even though this study was applied on a limited scale, in future, the study would explore the standardization of patient’s long-lived data from multiple sources using the SHARPn open-sourced tools and data scaling platforms such Hadoop.
v
Table of Contents
DECLARATION ... i
ACKNOWLEDGEMENTS ... ii
ABSTRACT ...iii
LIST OF FIGURES ... viii
LIST OF TABLES ... x
LIST OF ABBREVIATIONS AND ACRONYMS ...xii
1. INTRODUCTION ... 1
1.1 BACKGROUND TO THIS STUDY ... 2
1.2 AN OVERVIEW OF DATA MANAGEMENT AND DATA PROCESSING METHODS ... 4
1.3 DEFICIENCIES IN PAST LITERATURE ... 5
1.4 THE SIGNIFICANCE OF THE STUDY ... 7
1.5 THE OBJECTIVE OF THE STUDY ... 8
1.5.1 RESEARCH QUESTIONS ... 9
1.5.2 HYPOTHESIS DEVELOPMENT ...10
1.6 RESEARCH DESIGN ...10
1.7 THE OUTLINE OF THE STUDY ...13
2. LITERATURE REVIEW ...14
2.1 INTRODUCTION...14
2.1.1 BACKGROUND AND FUTURE OF BIG DATA IN HEALTH CARE ...14
2.2 THE CHARACTERISTICS OF BIG DATA ...16
2.2.1 VOLUME ...16
2.2.2 VARIETY ...19
2.2.3 VELOCITY ...22
2.2.4 VERACITY ...23
2.2.5 THE RISKS OF BIG DATA ...25
2.3 HEALTH SYSTEM APPLICATIONS AND THE INFLUENCE OF BIG DATA ...26
2.3.1 HEALTH INFORMATION SYSTEMS ...27
2.3.2 COLLECTION OF HEALTH BIG DATA THROUGH GIS LAYERS ...29
2.3.3 M-HEALTH AND TELEHEALTH ...31
2.4 STANDARDS FOR SYSTEMS INTEROPERABILITY ...33
2.4.1 CODING STANDARDS ...39
vi 2.5.1 DATA CLEANING ...42 2.6 DATA INTEGRATION ...45 2.6.1 FEATURE SELECTION ...45 2.6.2 SIMILARITY MEASURE ...47 2.6.3 INDEXING TECHNIQUES ...51
2.6.4 DATA SET MATCHING ...52
2.6.5 TEXT CLASSIFICATION ALGORITHMS ...55
2.6.6 STORAGE MECHANISMS FOR BIG HEALTH DATA ...58
2.6.7 CONCLUSION ...60
3. RESEARCH METHODOLOGY ...62
3.1 INTRODUCTION...62
3.2 THEORETICAL PERSPECTIVE TO THE PROPOSED SOLUTION ...62
3.3 FORMULATION OF RESEARCH QUESTIONS ...67
3.4 CRISP-DM FRAMEWORK AND DESIGN SCIENCE RESEARCH ...67
3.5 DATA UNDERSTANDING ...70
3.5.1 DATA SOURCES ...72
3.5.2 DATA EXPLANATION ...73
3.6 DATA PREPARATION ...77
3.6.1 DATA PRE-PROCESSING FOR STRUCTURED DATA ...77
3.6.2 DATA PRE-PROCESSING FOR UNSTRUCTURED DATA ...80
3.7 NOTATION USED ...82
3.8 CLASSIFIERS AND PROBABILISTIC GRAPHICAL MODELS USED ...83
3.9 TOOLS AND DATABASES ...93
3.10 ETHICAL CLEARANCE ...96
3.11 CONCLUSION ...96
4. MODELLING ...98
4.1 INTRODUCTION...98
4.2 FEATURE ENGINEERING AND SELECTION ...99
4.3 FEATURE SELECTION FOR MATCHING SOURCE TO TARGET ... 108
4.4 ANNOTATING THE CLINICAL CORPORA ... 110
4.5 MODEL SELECTION AND OPTIMISATION... 115
4.6 EXPERIMENTAL PROCEDURES ... 127
4.6.1 SYSTEMS SET UP ... 127
4.6.2 EVALUATION MEASURES ... 127
vii
5. EVALUATIONS ... 132
5.1 INTRODUCTION... 132
5.2 RESULTS FROM SIMILARITY MEASURES ... 133
5.2.1 MATCHING DISCUSSION ... 134
5.3 FIRST EXPERIMENT: STRUCTURED DATA ... 136
5.3.1 SUPPORT VECTOR MACHINES ... 136
5.3.2 MULTIPLE MODEL PERFORMANCES ... 138
5.4 SECOND EXPERIMENT: UNSTRUCTURED DATA ... 142
5.5 FIRST EXPERIMENT DISCUSSIONS ... 145
5.6 SECOND EXPERIMENT DISCUSSIONS ... 150
5.7 CONCLUSION ... 160
6. IMPLICATIONS OF THE FINDINGS ... 161
6.1 INTRODUCTION... 161
6.2 IMPLICATION OF THE FINDINGS BASED ON CRISP-DM PROCESS ... 161
6.3 IMPLICATION OF THE FINDINGS ... 163
6.3.1 INTEROPERABILITY FOR STRUCTURED DATA ... 164
6.3.2 INTEROPERABILITY FOR UNSTRUCTURED DATA ... 165
6.4 LIMITATIONS, FUTURE AND ADVICE ... 167
6.5 CONCLUSION ... 170
REFERENCES ... 171
APPENDIX A-1: ETHICAL CONSENT LETTER FROM UNISA ... 195
APPENDIX A-2: REPORT TO AUTHORIZE THE USE OF MIMIC-III DATABASE FOR RESEARCH ... 197
APPENDIX B: PROCESS FLOW FOR ROC RESULTS COMPARISON BETWEEN SVM, DECISION TREES AND LOGISTIC REGRESSION ... 199
APPENDIX C: DECISION TREE, SPLITTING CRITERION EVALUATION ... 200
APPENDIX D: SCREENSHOT OF THE PROGRAM THE RESEARCHER WROTE FOR THE PURPOSE OF EXTRACTING SMOKING INFORMATION FROM A LARGE TEXT FILE ... 201
APPENDIX E: SETUP FILES AND RESULTS FROM EXPERIMENT 1 AND EXPERIMENT 2 ... 202
Author ke ywords: Supervised Machine Learning Algorithm s; Big Data; Healthcare Coding Standards; Record Linkage; Natural Language Processing; Health Inform atics;
Unstructured Inform atio n Managem ent Architecture; Health Data Standardization; CRISP -DM, Structured and Unstructured data
viii
L
IST OF FIGURESFIGURE 1. 1: CRISP-DM PROCESS FLOW (SOURCE: (OLSON & DELEN, 2008)) ... 12
FIGURE 2. 1: DIMENSIONS OF BIG DATA (SOURCE: (FELDMAN ET AL., 2012)) ... 16
FIGURE 2. 2: INTERNET OF THINGS PRODUCTS AND PROTOTYPES (SOURCE: ISLAM, KWAK, KABIR, HOSSAIN, & KWAK, 2015) ... 18
FIGURE 2. 3: UNSTRUCTURED DATA WORD CLOUD ... 21
FIGURE 2. 4: FACTORS AFFECTING DATA QUALITY (SOURCE: JERRY GAO ET AL., 2016) ... 25
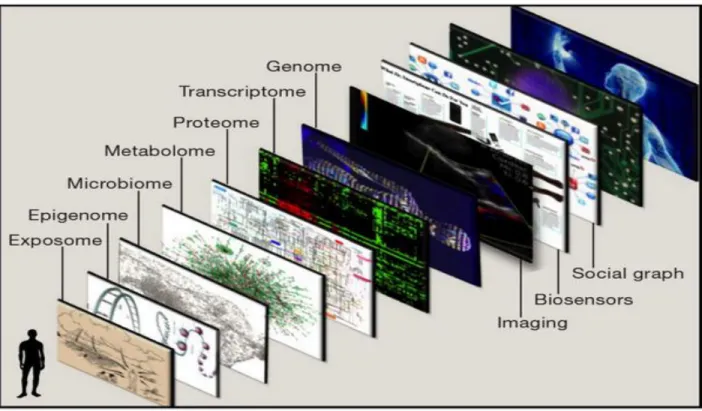
FIGURE 2. 5: GEOGRAPHIC INFORMATION SYSTEM OF A HUMAN BEING (SOURCE: TOPOL, 2014) ... 29
FIGURE 2. 6: ITRIAGE MOBILE HEALTH APPLICATION (SOURCE: HTTP://HISTALKMOBILE.COM) ... 32
FIGURE 2. 7: LEADING STANDARDS EVALUATION MATRIX (SOURCE: (CSIR & NDOH, 2014)) ... 35
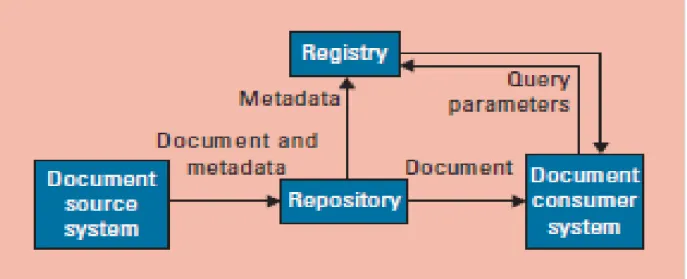
FIGURE 2. 8: CROSS-ENTERPRISE DOCUMENT SHARING ARCHITECTURE AND DATA FLOW SOURCE: (NOUMEIR, 2011) ... 38
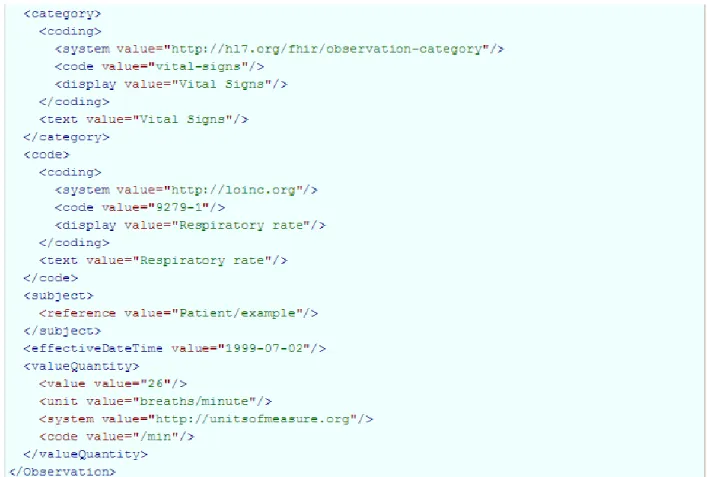
FIGURE 2. 9: FHIR OBSERVATION EXAMPLE FOR REPRESENTING PATIENT’S RESPIRATORY RATE USING FHIR RESOURCES (SOURCE: FHIR, 2011) ... 39
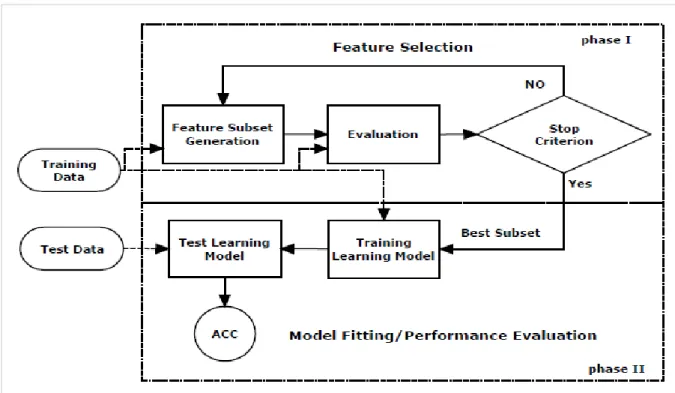
FIGURE 2. 10: A UNIFIED VIEW OF A FEATURE SELECTION PROCESS (SOURCE: LIU, MOTODA, SETIONO & ZHAO, 2010) ... 46
FIGURE 2. 11: TRAINING A SUPERVISED ALGORITHM ... 55
FIGURE 2. 12: EXAMPLE OF TRAINING EXAMPLES FOR DETERMINING WHETHER TO GRANT LOAN TO THE APPLICANT OR NOT (SOURCE: (GORUNESCU, 2011)) ... 56
FIGURE 2. 13: RULES THAT USE CONJUNCTIONS AND DISJUNCTIONS TO DETERMINE WHETHER TWO RECORDS MATCH OR NOT (SOURCE: (CHRISTEN, 2012))... 57
FIGURE 3. 1: HYPOTHESIS EVALUATION PROCESS ... 63
FIGURE 3. 2: HIGH VARIANCE AND HIGH BIAS (SOURCE: (HAMEL, 2009)) ... 65
FIGURE 3. 3: CRISP-DM FOR DATA UNDERSTANDING AND DATA PREPARATION (SOURCE: (OLSON & DELEN, 2008)) ... 70
FIGURE 3. 4: SIGMOID FUNCTION OR LOGISTIC FUNCTION ... 84
FIGURE 3. 5: SVM DECISION BOUNDARIES (SOURCE: (NASIEN ET AL., 2010)) ... 86
FIGURE 3. 6: MAPPING INPUT SPACE TO FEATURE SPACE (SOURCE:(HOFMANN, 2006))... 87
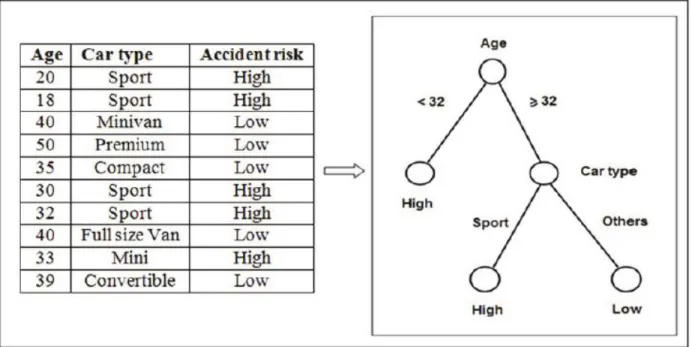
FIGURE 3. 7: RISK PREDICTION BASED ON THE TYPE OF CAR AND THE DRIVER’S AGE (SOURCE: (GORUNESCU, 2011)) ... 89
FIGURE 3. 8: HIDDEN MARKOV MODEL GRAPH FOR ESTIMATING THE ATMOSPHERIC PRESSURE (SOURCE: (KOLLER & FRIEDMAN, 2009)) ... 91
FIGURE 3. 9: A LINEAR CHAIN CRF MODEL SHOWING OBSERVABLE STATES DENOTED SHOWN AS GREY NODES, AND HIDDEN STATES SHOWN AS CLEAR NODES (SOURCE: (KOLLER & FRIEDMAN, 2009))... 93
FIGURE 3. 10: CTAKES PROCESSING OF A CLINICAL TEXT DOCUMENT (SOURCE: SAVOVA ET AL. (2010)) ... 95 FIGURE 4. 1: CRISP-DM FRAMEWORK FOR MODEL SELECTION (SOURCE: (OLSON & DELEN, 2008)) 99 FIGURE 4. 2: INITIAL RULES FOR DETERMINING IF TWO RECORDS MATCHES OR NOT. 109 FIGURE 4. 3: A SAMPLE RULE FOR DETECTING A SMOKING STATUS OF A PATIENT FOR A GIVEN CLINICAL NOTE. 113 FIGURE 4. 4: FEATURE EXTRACTION FROM CLINICAL TEXT USING NAMED ENTITY RECOGNITION 115 FIGURE 4. 5: FEATURE EXTRACTION FROM CLINICAL TEXT USING NAMED ENTITY RECOGNITION 115
ix
FIGURE 4. 6: NUMBER OF TRAINING EXAMPLES FOR DATASETS 116 FIGURE 4. 7: TESTED MODEL WITHOUT CROSS-VALIDATION 117 FIGURE 4. 8: PREDICTED MODEL WITHOUT CROSS-VALIDATION 118 FIGURE 4. 9: PICTORIAL VIEW OF A 10-FOLD CROSS-VALIDATION (SOURCE: (D. L. OLSON & DELEN, 2008)) 119 FIGURE 4. 10: ANNOTATION PROCESS (SOURCE: (PUSTEJOVSKY & STUBBS, 2013)) 123 FIGURE 4. 11: SHOWS THE USAGE RESULTS OF TWO SETS OF NGRAMS BETWEEN THE YEAR 1800 AND 2008, THIS IS A COMPARISON BETWEEN 3-GRAM WHICH IS (DOES NOT SMOKE) AND A 2-GRAM (NEVER SMOKED). 124 FIGURE 4. 12: WORD CLUSTERED BASED ON CONTEXT AND RELATEDNESS FROM AN INPUT OF 260 741-WORD
VOCABULARY (SOURCE: (BROWN ET AL., 1992)) 125
FIGURE 4. 13: ROC CURVE WITH MULTIPLE CLASSIFIERS (SOURCE: (OLSON & DELEN, 2008)) 131 FIGURE 5. 1: CRISP-DM FRAMEWORK FOR MODEL EVALUATION (SOURCE: (OLSON & DELEN, 2008)) 133 FIGURE 5. 2A: RESULTS FROM RUNNING A 10-FOLD CROSS-VALIDATION AND GRID-SEARCH FOR PARAMETER
OPTIMISATION OF SVM 137
FIGURE 5. 2B: RESULTS FROM RUNNING A 10-FOLD CROSS-VALIDATION AND GRID-SEARCH FOR PARAMETER
OPTIMISATION OF LOGISTIC REGRESSION 140
FIGURE 5. 2C: RESULTS FROM RUNNING A 10-FOLD CROSS-VALIDATION AND GRID-SEARCH FOR PARAMETER
OPTIMISATION OF DECISION TREE 141
FIGURE 5. 3: ROC CURVE FOR DECISION TREE, LOGISTIC REGRESSION AND SVM 142
FIGURE 5. 4: SVM MODEL CLASSIFICATION ERROR 147
FIGURE 5. 5 A: ANNOTATIONS FROM CLAMP’S PREDEFINED RULES 151 FIGURE 5. 5 B: ANNOTATIONS FROM THE CUSTOM DEVELOPED RULES 151 FIGURE 5. 6: A DOUBLE CLASS ANNOTATION WHERE A RECORD IS CLASSIFIED AS “CURRENTSMOKER” AND
“NONSMOKER” AT THE SAME TIME. 151
FIGURE 5. 7: PREDICTED NAMED ENTITIES FROM THE CRF CLASSIFIER 156 FIGURE 6. 1: CRISP-DM PROCESS FLOW (SOURCE: (OLSON & DELEN, 2008)) 162
x LIST OF TABLES
TABLE 1. 1: RESEARCH SUB-QUESTIONS FOR THIS RESEARCH STUDY ... 9
TABLE 2. 1A: DATA SET FROM PROVIDER A ... 19
TABLE 2. 1B: DATA SET FROM PROVIDER B ... 19
TABLE 2. 2: MAPPING FUNCTIONS TO PROFILES AND STANDARDS ... 37
TABLE 2. 3 MAPPING FUNCTIONS TO PROFILES AND STANDARDS ... 40
TABLE 2. 4A WORD STEMMING FOR SOURCE DATA ... 50
TABLE 2. 4B TARGET VITAL SIGNS FEATURES ... 50
TABLE 2. 4C TARGET VITAL SIGNS FEATURES ... 51
TABLE 2. 5 MAPPING LEGACY DATA SET AND ATTRIBUTES TO FHIR RESOURCE ... 53
TABLE 3. 1 VARIABLES OF THE STUDY ... 66
TABLE 3. 2 RESULTS OF RECORDS TO BE COMPARED WITH BLOOD PRESSURE RECORD ... 66
TABLE 3. 3 SIMILARITIES BETWEEN DSRM AND CRISP-DM ... 68
TABLE 3. 4A STANDARDIZED TESTS FROM LABEVENTS AND D_LABITEMS MIMIC TABLES ... 71
TABLE 3. 4B UNSTANDARDIZED OBSERVATIONS FROM CHARTEVENTS AND D_ITEMS MIMIC TABLES ... 71
TABLE 3. 5 MECHANISMS FOR MINING ABBREVIATION EXPANSIONS ... 78
TABLE 3. 6 EXAMPLE ABOUT RELATION EXTRACTION TO SHOWCASE THE SHORTCOMINGS OF HMM ... 91
TABLE 4. 1 MIMIC-III SOURCE OBSERVATION DATASET ... 100
TABLE 4. 2A SOURCE FEATURES WITH SOUNDEX BLOCKING KEYS ... 101
TABLE 4. 2B TARGET FEATURES WITH SOUNDEX BLOCKING KEYS ... 103
TABLE 4. 3 BLOCKING KEY VALUES ... 103
TABLE 4. 4 OBSERVATIONS WITH SOUNDS THAT DIFFER FROM LOINC OBSERVATION ... 104
TABLE 4. 5 CLINICAL TEXT ABOUT PATIENT’S SMOKING INFORMATION AND THE MEANING ... 106
TABLE 4. 6 ATTRIBUTES SIMILARITY COMPARISON ... 108
TABLE 4. 7 SMOKING STATUS EXAMPLES ... 111
TABLE 4. 8 MODEL SELECTION CRITERIA ... 120
TABLE 4. 9 EVALUATION METRICS FOR THE CLASSIFIER ... 128
TABLE 5. 1A EDIT DISTANCE SIMILARITY RESULTS FOR OBSERVATION NAME AND UNIT OF MEASURE ... 133
TABLE 5. 1B JARO-WINKLER SIMILARITY RESULTS FOR OBSERVATION NAME AND UNIT OF MEASURE ... 134
TABLE 5. 2A CONFUSION MATRIX FOR SUPPORT VECTOR MACHINES... 136
TABLE 5. 2B CONFUSION MATRIX FOR A LOGISTIC REGRESSION CLASSIFIER ... 138
TABLE 5. 2C CONFUSION MATRIX FOR A DECISION TREE CLASSIFIER ... 140
TABLE 5. 3 RESULTS FOR SMOKING STATUS DETECTION PRODUCED BY A CRF SEQUENCE CLASSIFIER ... 143
TABLE 5. 4A CONFUSION MATRIX FOR A DECISION TREE CLASSIFIER WITH ACCURACY: 91.00% +/- 5.83% (MIKRO: 91.00%) ... 149
xi
TABLE 5. 4B CONFUSION MATRIX FOR THE SVM CLASSIFIER WITH ACCURACY: 92.50% +/- 5.12% (MIKRO: 92.50%) ... 149 TABLE 5. 5 AN EARLIER TEST RESULTS FOR THE NAMED ENTITY EXTRACTION FOR THE PATIENT’S SMOKING STATUS
AND OTHER RELEVANT INFORMATION THROUGH A CRF SEQUENCE CLASSIFIER ... 154 TABLE 5. 6 LATER TEST RESULTS FOR THE NAMED ENTITY EXTRACTION FOR THE PATIENT’S SMOKING STATUS AND
OTHER RELEVANT INFORMATION THROUGH A CRF SEQUENCE CLASSIFIER ... 155 TABLE 5. 7 RESULTS FROM EXECUTING RULES ON CLINICAL TEXT DATA ... 157 TABLE 5. 8 SNOMED-CT CODING INFORMATION ACCORDING TO THE UMLS METATHESAURUS ... 157
xii LIST OF ABBREVIATIONS AND ACRONYMS
CDA Clinical Document Architecture CMS Council of Medical Schemes CPT Current Procedural Terminology
CRISP-DM Cross-Industry Standard Process for Data Mining CSIR Council for Scientific and Industrial Research EHR Electronic Health Record
EMR Electronic Medical Record
HIS Health Information Systems
HL7 Health Level Seven Standard
HNSF Health Normative Standards Framework ICD International Classification of Diseases
LOINC Logic Observation Identifiers Names and Codes MIMIC-III Medical Information Mart for Intensive Care
m-Health Mobile Health
NDoH National Department of Health NDP National Development Plan
NHANES National Health and Nutritional Examination Survey
NHI National Health Insurance
PHR Personal Health Record
REST Representative State Transfer SDK Software Development Kit
SNOMED Systematic Nomenclature of Medicine Clinical Terms
SVM Support Vector Machines
TFIDF Term Frequency Inverse Document Frequency UMLS Unified Medical Language Systems
1
CHAPTER 1: Introduction
1. INTRODUCTION
Health care facilities in South Africa still find it difficult to share, trace and efficiently search for patients’ medical data on their health information systems. According to (Masilela, Foster, & Chetty, 2013) health information systems are characterised by fragmentation and a lack of coordination. The report further adds that there is prevalence of manual systems and the lack of automation in health care, and between those systems that have been automated, there is a lack of interoperability.
(Mxoli, Mostert-Phipps, & Gerber, 2014) have defined interoperability in health care systems as the ability of information and communication technology (ICT) systems to share and exchange patients’ health data. In health care, standardization concepts have been considered to be the potential solution to the fragmented and siloed health systems (Smith, Fridsma, & Johns, 2014). Data management standards have enabled seamless exchange of information and have reduced the complexity when sharing data between multiple systems (Adebesin, Kotzé, Greunen, & Foster, 2013; Gruenheid, Dong, & Srivastava, 2014; Nagy, Preckova, Seidl, & Zvarova, 2010).
Even though there are standards in place designed to ensure consistency and interoperability between systems, the adoption rate in South Africa remains low. This has been attributed to the lack of human resources for implementing the standards, lack of implementation guidelines, a limited participation in standards development, and a lack of standards’ development prioritisation (Adebesin, Kotzé, et al., 2013). Another problem is that standards evolve and change over time, for instance HL7 health Version 2 standard organises data in a “comma separated value” file system, while Version 3 uses a complex XML file format. FHIR is the latest version of HL7 standards, it is resource-based and organizes information in XML, JSON, and turtle syntax. (Smits & Cornet, 2014) in their findings have reported FHIR to be completely different and not compatible with the previous versions of HL7 standard. Therefore, the researcher
2
claims that as the standards evolve, the health systems implementing those standards would need to adapt to that change. Now the problem comes when the data in system A in not easily retrievable, or comparable, or exchangeable with system B. Therefore, this study addresses the problems mentioned through health standards and machine learning.
As such, this research study addresses the data interoperability problem that is currently experienced by the health care industry in both developing and developed countries. In the United States of America, they introduced the Meaningful Use programme, aimed at improving quality, safety, and the efficiency of Electronic Health Records (EHR) systems, and thus reducing health disparities (D’Amore et al., 2014). Here in South Africa, the National Department of Health (NDoH) has introduced the Health Normative Standards Framework (HNSF), which is an interoperability guideline that provides guidance for eHealth standards implementation between information technology systems (CSIR & NDoH, 2014). These are some of the items that this study aims to address. Below is an overview of the current chapter.
In section 1.1 the researcher gives the background of this study, and a brief detail about data management is covered in section 1.2. Deficiencies in past literature and the significance of the study is then covered in section 1.3 and 1.4 respectively. While the objective and research questions are detailed in section 1.5 and in its subsections. Section 1.6 gives an outline and the proposed research methods for this study, and later in this section, the limitations of the study are identified, proposed tools and instruments are mentioned, and the validity of the instruments and data analysis methods are described. Section 1.7 gives a summary of what lies beyond this chapter.
1.1 BACKGROUND TO THIS STUDY
It could be said with great confidence that standards are put in place to format and organise data, regardless of the industry. In health care as well, standards can be used to achieve data exchange (Gay & Leijdekkers, 2015), however, health data comes in many forms. Some of the data is produced from wearable devices, and does not follow
3
a certain health standard, yet wearable device data is considered to be a treasure trove when it comes to health care (Topol, 2015). If it can be possible to integrate this data to the clinicians’ or hospitals’ health systems, then it can be possible to achieve high quality health care, due to the availability of useful data that is passively generated. Patients are able to generate their own data from their devices (smartphones and sensors), and are taking advantage of m-Health applications to improve and assist their health, said (Paschou, Sakkopoulos, Sourla, & Tsakalidis, 2012).
According to (Swan, 2012), data from patients’ devices can be treated as personalised preventative medicine and can be used to prevent, diagnose and treat diseases. Personalised preventive medicine does not only focus on disease management, but has the following advantages: reduction of patients’ hospital readmission rates; extension of the patients’ lifespan and reduction of disability; and also prevent conditions from rising.
Patients with chronic diseases are constantly required to monitor their health, and some use their smartphones, while others, especially diabetics, use a glucose tracker device to monitor their health. Data produced from these devices cannot be easily combined with data at the clinician’s office. Data from wearable sensors is said to be heterogeneous, unstructured, and noisy (Chen, Mao, Zhang, & Leung, 2014), and as a result, it is difficult to integrate, and is costly to manage and exchange.
To make the data interoperability picture clearer, in the Eastern Cape, the South African Society of Cardio-vascular Intervention has observed that different doctors are not able to share their medical notes. As a result, they don’t know the history of the patients’ treatments and often during consultations, patients would be requested to do lab scans, lab tests, and be prescribed to medicine that another doctor previously prescribed but that did not work (The Competition Commission South Africa, 2016). The current health data management system is costly and inefficient. Hence, this study is targeted at collecting patient’s data from multiple data sources, then classifying it based on health standards, such that patients’ information can be easily searchable, shareable and comparable for patterns.
4
1.2 AN OVERVIEW OF DATA MANAGEMENT AND DATA PROCESSING METHODS
The South African health information systems policy states that information that can be gathered in health facilities includes the following:
Health status information: which includes morbidity, mortality, births, deaths, injuries and disease burden;
Health related information: which includes demographic, social economic, residential and other related information;
Health service information: which is about utilisation of health services; and Health management information: which is about the administrative services. Even though the policy clearly categorises the types of information in health facilities as listed above, the type of information collected in the private health sector is not similar to that collected in the public sector (Matshidze & Hanmer, 2007). In the private sector, the Council of Medical Schemes (CMS) has developed a minimum data set that stipulates which information the medical aid scheme ought to collect.
There is also disparity in health services between health facilities in rural and in urban areas. (Coleman, Herselman, & Potass, 2012) have found that in urban areas, internet connection is much faster and more reliable than it is in rural areas, even though the ICT infrastructure and systems are not integrated. Furthermore, (Coleman et al., 2012) have also stated that the PAAB system is used to collect and send patient demographic information to the head office of the North-West Health Department on a monthly basis. Urban hospitals in Rustenburg and Klerksdorp are able to share x-ray images electronically.
The ability of certain hospitals to share data amongst themselves does not remove the interoperability issues. The National Health Insurance (NHI) Plan aims to achieve interoperability between health systems by implementing the health information exchange middleware, while clinically-generated data will be shared and exchanged
5
using the middleware (South Africa Department of Health, 2015). However, wearable device data, such as heart rate, blood pressure, glucose measurements, sleep patterns, activity measurements, and so forth cannot be easily integrated into the national patient-based information system because at the moment there is no standard that stipulates how wearable data should be stored (Li et al., 2017). If data stored or shared uses a similar standard, then it would be similar in structure, thus making it easier to manage.
The health care industry is flooded with both structured and unstructured data, and when structured data is shared between health care organizations, the original data ends up being semi-structured, due to the lack of standardization. In health care, unstructured data comes in the form of medical reports, medical scans, doctors’ notes, and more. (Sarawagi, 2007) suggests that structure could be given to unstructured data through information extraction methods. Extraction methods include: rule-based learning and statistical methods. A number of statistical models have been used to assign labels to tokens in a sentence. Sarawagi also stated that Support Vector Machines (SVM) have been used for classifying each token to an entity type, e.g. a person’s name would be classified to a “person” entity, depending on a list of available entities. Classification helps with the task of choosing the correct target class for a given input.
SVMs are not only useful for classifying sentences into entities, but other researchers such as (Cheng, Zhang, Xie, Agrawal, & Choudhary, 2012; Zhao, Wang, Bi, Gong, & Zhao, 2011) have used SVM classifiers for classifying hierarchical data, such as web pages and xml documents. Therefore, the researcher proposes the use of machine learning algorithms and data coding standards for achieving data interoperability across manifold datasets that are not standardized, or that are fragmented.
1.3 DEFICIENCIES IN PAST LITERATURE
Fragmented and disparate health care systems in South Africa can achieve interoperability through the standardization of health care systems (Adebesin, Foster, Kotzé, & Van Greunen, 2013; Orgun & Vu, 2006). To ensure that health standards are
6
developed in health care, the National Department of Health (NDoH) has commissioned the Meraka Institute of CSIR to develop a Health Normative standards framework (Masilela et al., 2013). The framework will provide guidance and the know-how of the eHealth standards to the Health Department. However, existing systems would have to comply with the framework, which means redevelopment of these systems, and begs the question as to how the old data before the enrolment of the standard ought to be standardized.
The old data would have to be captured, or exported, and be structured based on the standard that was implemented, if data is sourced from different providers; which use different standards, then the problem of interoperability resurfaces. For example, (Ding, Yang, & Wu, 2011) have stated that different sources of health data, such as data from a wearable sensor, can have different semantics and data structures, which increase the difficulties in data processing. Hence, previous literature on data management shows that the focus has been on implementing a standard at systems-level and not at data-level. The standardization of structured data solves a fraction of the interoperability problem, however as it has been stated, 80% of organizations’ data is unstructured (Barrett, Humblet, Hiatt, & Adler, 2013). Unstructured data is also dormant in health care. In a hospital setting, vital clinical information is recorded in a human-readable language such as English. Recording the information in a human readable language makes it easier and faster for clinical personnel to record into the EHR (Electronic Health Record) than to record the data in a structured format.Unstructured data is often easier to read by humans but it is much more difficult to manage via computers (Barbulescu et al., 2013; Rosenbloom et al., 2010). Even in such a case, the volume of this data is overwhelming for clinicians to manage manually, and to organize via computers. Therefore one would have to apply Natural Language Processing (NLP) algorithms in order to easily manage this data. Therefore, there is a need to also standardize unstructured data.
Another method of standardizing data is through the use of SDKs. APPLE provides an SDK HealthKit to third party devices and application developers. The SDK is aimed at
7
making patients' data collatable and shareable between applications and devices. Nevertheless, in order to use the SDK, developers or data users must own an iPhone smartphone, and they would also have to redevelop their applications using Apple’s SDK HealthKit, which runs on the Macintosh operating system (Hattersley, 2014).
Other data management techniques include Data Fusion, which has been used to combine multiple data sources in order to ensure data management. Another technique is using record-linkage algorithms that are aimed at finding attributes that are shared between data sources, where they can be used to match records across different sources. (Hassanzadeh et al., 2013) used a record-linkage algorithm to create a framework for discovering linkage points over large semi-structured web data. This framework was only focused on web data sources, and they saw a need to extend their framework to accommodate syntactic, semantic, and lexical matching functions. Other researchers such as (Viangteeravat et al., 2011) have presented a prototype for the implementation of HL7 Reference Information Model mapping for data integration of distributed clinical data sources. These researchers have recognised the need for an automatic mapping service that uses semantic mapping, pattern matching and machine learning techniques for mapping traditional health data to an appropriate RIM-based classes and attributes.
1.4 THE SIGNIFICANCE OF THE STUDY
The study of the integration and management of patients’ data in South Africa is of paramount importance, because without relevant data, it is impossible to make correct decisions. It is mentioned by (Mayosi et al., 2012) that, “detection, management, and outcomes of care for individuals with non-communicable diseases are suboptimum” (p. 10). With the introduction of the National Health Insurance (NHI) plan, there is a need to standardize clinical data so that data can be easily sharable between health care institutions. Standardizing data ensures that common reimbursement codes are used for the clinical services being provided, and hence preventing fraud by overcharging the services provided in health care.
8
More relevant data is needed to understand the patient so that decision-making in health care can be improved through the use of integrated patient information. If the data is integrated and is easily retrievable, then it can be easy to extract useful information (Hinssen, 2012). Integrated patients’ data would allow the physician to search for treatments that worked for a similar patient to the one being treated; and data can be filtered by age, gender or any other relevant characteristics (Barbarito et al., 2015). However, currently health data is not integrated, and a large portion of it cannot be used for secondary purposes because it is not structured in the same way and is stored in different locations (Rea et al., 2012).
Data is difficult to manage manually, which is why this study proposes the use of computer algorithms to organise patients’ data. In addition, (Fu, Christen, & Boot, 2010) suggest that linked information facilitates improved retrieval of information, and it also improves the quality of the data, which in return offers more value and opportunities in data usage for further analysis. (Porter & Lee, 2013) have suggested that in order to enable universal comparison of health outcomes, and for stimulating improvements in health care, it is vital to measure outcomes by conditions, and the researcher suggests that standardizing health data would improve how outcomes are measured in health care.
1.5 THE OBJECTIVE OF THE STUDY
The objective of this study is to use standardized clinical observation data as input on a learning algorithm, where the algorithm would learn a function for identifying patterns in the input data, such that when the algorithm is given new but related unstandardized observation data, it would be able to classify the data to the related standard. The researcher has planned to use the SVM classifier as the learning algorithm, and laboratory data that is standardized (also known as gold standard), based on the LOINC standard. This objective is meant to address the problem of data interoperability, by ensuring that clinical observation data is searchable, comparable and exchangeable between health care facilities. Clinical observation data includes but is not limited to vital signs, laboratory data, and social history such as tobacco use.
9 1.5.1 RESEARCH QUESTIONS
The following research questions have been identified, and are aimed at addressing clinical observation data interoperability across health care facilities. The researcher has identified two main questions for this study, and sub-questions are extracted from these main questions:
1. When will health information systems in South Africa be standardized in order to be able to seamlessly exchange and share consolidated patients’ data?
2. How can the process of data compliance across health care providers be automated through machine learning concepts?
In order for these questions to be answered, the following sub-questions have been identified as mentioned in Table 1.1.
Table 1. 1: Research sub-questions for this research study
# Research sub-question
i. What type of health-related data sets will this research study focus on?
ii. What methods are being used to classify objects accordingly in other industries, and how can those methods be applied in healthcare in order to achieve semantic and syntactic interoperability?
iii. How were features selected for structured data?
iv. How were features selected for unstructured data
v. What methods are used to automatically map source dataset (unstandardized) to the target dataset (standardized) with high level of accuracy? And which one is appropriate for health-related data?
vi. What features will be used to determine similarity between two records?
10 1.5.2 HYPOTHESIS DEVELOPMENT
From accomplishing the objective of the study as stated in section 1.5, the researcher claims interoperability will be achieved, therefore the following hypothesis statements have been developed:
- Patients’ data is not easily exchangeable, searchable and comparable because it’s not structured; therefore, in order to give it a structure, one must apply a working standard, and to automate the process of data standardization one can use a learning algorithm.
- Support Vector Machine algorithm can learn better than logistics regression and Decision Tree algorithms because they are sensitive to outliers, and it maximizes the margin that separates the positive and negative training examples.
On the discussion section of this study, the researcher proves the hypothesis he has developed.
1.6 RESEARCH DESIGN
The output of this research study is evaluated through a design science research (DSR) approach, whereby a model prototype is developed in order to test if the learning algorithm is able to make correct predictions on unknown data. The DSR approach helps design research experiments that can be reproduced by other researchers. In addition, the researcher uses Knowledge Discovery and Data (KDD) mining process models as a guideline for implementing data mining projects. Few of the KDD process models are: Sample Explore Modify Model Assess (SEMMA), Cross-Industry Standard Process for Data Mining (CRISP-DM), and Integrated Knowledge Discovery and Data Mining (IKDDM). SEMMA was developed by SAS, and it uses an iterative experimental cycle of five steps which makes up its name. The SEMMA data mining process is as follows: firstly, the data is sampled where training set, cross-validation set and test set are selected and partitioned; selected data is then explored for anomalies and outliers; thereafter modified through the identification of additional features and removal of redundant features; then the model is built by using modelling techniques such Decision Trees, Support Vector Machines (SVM), and more; then lastly, the selected model is
11
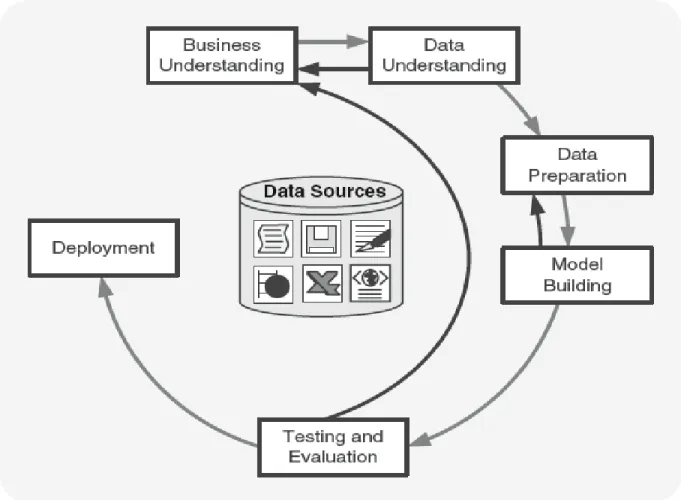
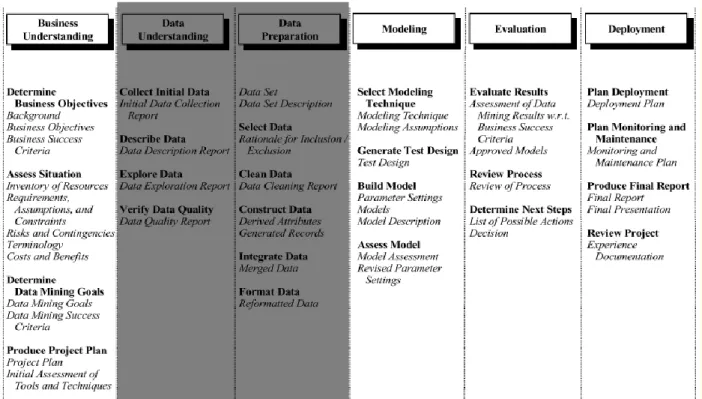
assessed in order to predict its performance on test data (Olson & Delen, 2008). Alternatively, CRISP-DM and IKDDM consists of six phases namely: business understanding, data understanding, data preparation, modelling, evaluation, and deployment (Rivo et al., 2012) see Figure 1.1 for a process flow.
The researcher starts by defining the phases in relation to CRISP-DM. The business understanding phase is meant to assess the need, significance and the objective of a DM and KD project. From section 1.1 through to 1.5, the researcher provides the business understanding for this research study. The second step of the CRISP-MD methodology is data understanding, which includes the process of data collection, data defining, data review and exploration, and the verification of the authenticity of the data. The third step is data preparation, where, during this step, the collected sampled dataset is cleaned of redundant data values, missing values are filled, and outliers are identified and fixed. Part of data preparation includes data normalization, indexing, attribute and record comparisons, feature selection, feature preparation, and feature weighing and vectorisation.
12
Figure 1. 1: CRISP-DM process flow (Source: (Olson & Delen, 2008))
The fourth step of CRISP-DM is data modelling, where the data is loaded into software such as RapidMiner, MATLAB, Octave, or R for visual exploration of the data points. During this step, the data is partitioned into three sets, namely training data, cross-validation data and the testing data. Thereafter the data mining technique is identified, where classification algorithms such as Decision Trees, SVM, and Logistic Regression are identified. The data is then evaluated during the fifth step of CRISP-DM, where the evaluation is based on recall, precision and accuracy. Finally, the last step is deployment, which involves applying the results of the learned model on a live system, and observing the performance (Olson & Delen, 2008). Similarly, IKDDM also defines the same phases as CRISP-DM. IKDDM is an integrated version of CRISP-DM whereby links are formed between tasks within a phase and between phases. The IKDDM
13
approach has been reported to provide an efficient and an effective implementation of DM and KD processes. Furthermore, IKDDM was designed to address the fragmented approach of CRISP-DM (Mansingh, Bryson, & Asnani, 2016; Sharma & Osei-Bryson, 2010). However, with all the features that IKDDM offers, the researcher has struggled to find documentation on the uses of IKDDM. Therefore, the researcher has considered the use of CRISP-DM since its documentation is easily accessible, even (Krzysztof Cios, Witold Pedrycz, Roman Swiniarski, & Lukasz Kurgan, 2007) declared that its documentation is good and easy to follow. In addition (Kurgan & Musilek, 2006) have reported that CRISP-DM can be used by novice data miners, it is suitable for industrial projects, and has been regarded as a successful and extensively applied framework in multiple industries. With the CRISP-DM base set, in Chapter Three, the researcher shows the relationship between the DSR approach and CRISP-DM.
1.7 THE OUTLINE OF THE STUDY
Chapter Two presents a review of literature, and is aimed at giving a summary of the studies consulted when conducting this study. During this chapter, the researcher will define the components of this study such as health data, health care data standards, and data mining concepts. Chapter Three will provide research methodologies, approaches and strategies.
Chapter Four will analyse the data collected in this study. Chapter Five will provide the results and discuss the findings, and finally Chapter Six will present the applicability, impact and the implication of the findings.
14 CHAPTER 2:
Health Data, Coding Standards and Data Integration Techniques
2. LITERATURE REVIEW
2.1 INTRODUCTION
This chapter builds the foundation for this study by establishing the attributes that makes up big data, and discussing how to manipulate this data using computer algorithms and international standards, for health data. The domain of this study is health care, specifically data about clinical observations, which include(s) vital signs, laboratory data, device measurements, and social history, such as tobacco usage. The researcher starts section 2.2 by describing the characteristics of big data. Section 2.3 is focused on big data applications, information systems in health care, data sources from which to collect data from, and lastly, mobile health care delivery systems, are discussed in section 2.3.3.
Section 2.4 discusses the health standards to be used for this study; standards ensure interoperability between disparate systems in different health care facilities. Section 2.5 describes the details about data cleaning, for structured, and semi-structured data. In section 2.6 the researcher provides methods for preparing the collected data sets so that machines are able to read the contents of this data, thereafter, also in this section schema and attribute mapping methods are covered. Data storage, querying, and data exchange are covered in section 2.6.
2.1.1 BACKGROUND AND FUTURE OF BIG DATA IN HEALTH CARE
Big data has been deemed as the key driver for creating value and transforming health care providers, however, health care providers have been reported to discard 90% of the data that they generate (Hinssen, 2012). Even though health care providers collect massive amounts of data, however, this collection has been motivated by patients’ care, compliance, regulatory requirements, and record-keeping (Raghupathi & Raghupathi, 2014). Apart from what big data has been used for previously, it can also be used for managing decision support systems, disease surveillance, and population health
15
management, but then, in order to achieve all of this, health organizations need to be data-driven. According to a report by (IBM, 2013),
To thrive, or even survive, in this time of massive change, health care organizations [sic] must become data driven. They must treat data as a strategic asset and put processes and systems in place that allow them to access and analyse the right data to inform decision-making processes and drive actionable results (p. 2).
In support of this statement (Groves, Kayyali, Knott, & Van Kuiken, 2013; Shah & Tenenbaum, 2012) emphasise that data-driven medicine will enable the discovery of new treatment options, discover hidden trends in data, identify patterns related to readmissions and drug side-effects, deliver patient-centered care, and reduce health care costs. Data-driven health care systems have a strong focus on big data, but what does big data entail?
Big data definition
(Villars & Olofson, 2011) have defined big data as “a growing challenge that organizations [sic] face as they deal with large and fast-growing sources of data or information that also present a complex range of analysis and use problems” (p. 2). (Kaisler, Armour, Espinosa, & Money, 2013) define big data as the amount of data that is beyond the current computer storage and the processing power, and regard big data as a moving object, because it constantly changes in structure. The data is difficult to store and process, because some is correctly ordered (structured), while some is without order (unstructured). The properties of big data includes:
- the lack of available computer processing for ingesting, validating and analysing large volumes of data;
- the lack of methods to deal with unstructured or schemaless data; and - the lack of methods to deal with real-time collection and analysis of data.
While On the other hand, (Feinleib, 2014) defines big data based on the impact that this data has, noting that it is the ability to capture and analyse data and gain actionable
16
insight from that data at a much lower cost than was historically possible, that makes it valuable.
In a similar way to (Feinleib, 2014), (Feldman, Martin, & Skotnes, 2012) have defined big data as a natural resource with a high value by stating that “big data is the fuel, it is like oil. If you leave it on the ground it does not have a lot of value” (p. 7). A succinct definition that covers all the aspects of big data is that one of (Demchenko, De Laat, & Membrey, 2014), they have defined it as: “high-volume, high-velocity and high-variety information assets that demand cost-effective, innovative forms of information processing for enhanced insight and decision making” (p. 9). Common dimensions for big data are: volume, variety, velocity, and veracity as it is shown in Figure 2.1.
2.2 THE CHARACTERISTICS OF BIG DATA
Figure 2. 1: Dimensions of big data(Source: (Feldman et al., 2012))
Figure 2.1 summarises the dimensions of big data, where in this case, the ‘Four Vs’ that are used to define big data.
2.2.1 VOLUME
The first “V” in Figure 2.1 is the volume of the data, which indicates its size or quantity. The greater the number of electronic devices there are, the bigger the volume of data
17
produced from those devices, where it can therefore be deduced that the rate of growth of the number of electronic device is directly proportional to the growth of data from those devices. In 2011, (Friess & Vermesan, 2011) predicted that the growth of connected devices will reach 16 billion by 2020, and a year later (Swan, 2012) predicted 50 billion to be reached by 2020. With the expanding production of electronic devices, data is growing in immeasurable quantities as well.
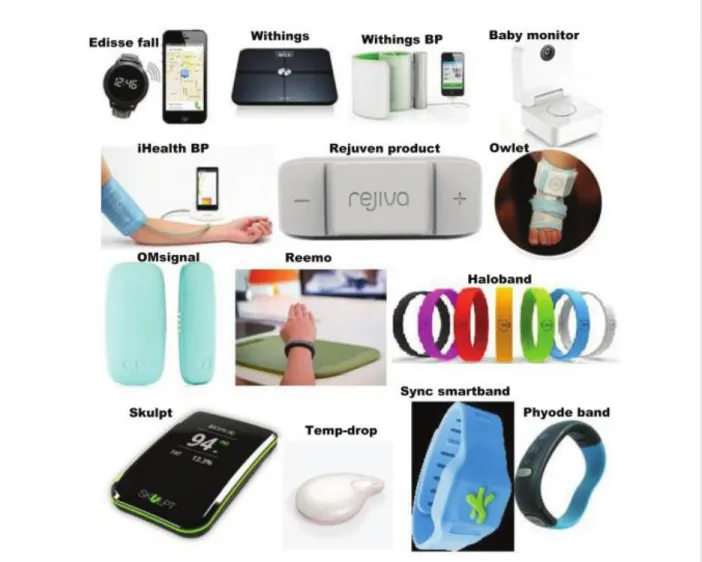
In 2011, (Hinssen, 2012) estimated that the size of big data was 150 exabytes, which is equivalent to 250 million DVDs of data, noting that this data is growing at a rate of 1.2 to 1.4 exabytes per year. (Chen et al., 2014) cements the relationship between data and electronic devices by stating that, the growth of IoT (internet of things or connected electronic devices) and cloud computing promotes a sharp growth of data. Figure 2.2 gives a glimpse of IoT products that are currently being used in delivering care to patients, noting that all these devices generate exabytes of data that could be useful to health care facilities if they could be collected and analysed. This proliferation of data is caused by the fact that these devices provide more processing power; more storage; more value for money; and are smaller in size, in such a way that their users can carry them around. This is in keeping with Moore’s Law, which states that the overall processing power of computers doubles every two years. Increased processing power means more transistors can be fitted into the device’s microchips, and there is and more memory storage, and ultimately more data, which can be generated quicker than it can be stored. As a result, it is termed ‘big data’. In addition (Philip Chen & Zhang, 2014; Villars & Olofson, 2011) supposed that the rate of growth of data has extended beyond Moore’s Law.
18
Figure 2. 2: Internet of Things products and prototypes (Source: Islam, Kwak, Kabir, Hossain, & Kwak, 2015)
The effective use of big data has the potential to transform economies and to deliver production growth, however, big data includes data that is inconsistent, incomplete, lacks privacy, is semi-structured, and unstructured (Philip Chen & Zhang, 2014). Hence, (Friess & Vermesan, 2011) advise caution, saying that the data generated will only be of value if it can be collected, analysed and interpreted. In many instance it remains difficult to obtain value from big data.
19 2.2.2 VARIETY
Similar data sets that are collected from different devices and from different data sources have a high probability of becoming unstructured during data integration, particularly when the target data set and the source data set do not conform to a similar data acquisition standard, data exchange standard, or data storage standard. On the basis of varying data, variety in big data can be defined as data acquired from diverse data sources, and from multiple data sets. The attribute of variety means that the data is extremely heterogeneous at the data set (schema) level as well as at the metadata level (Dong & Srivastava, 2013). Big data varies in structure because it holds the qualities of being structured, semi-structured and unstructured (Demchenko et al., 2014; Raghupathi & Raghupathi, 2014). Structured data can be easily stored, queried, analysed, recalled and manipulated (Feldman et al., 2012), whereas semi-structured data is defined as being neither raw, nor of a strict type or characteristic.
Incomplete columns in the data sets might even have extra information such as annotations, and similar information that is stored differently in multiple tables (Abiteboul, 1997). Figure 2.1A and Figure 2.1B reveal some of the properties of semi-structured data as defined by (Abiteboul, 1997). Data in both features represent a single patient, however the patient’s laboratory data is stored differently across health care provider A and B.
Table 2. 1A: Data set from Provider A
HOSPITAL ITEM VALUE UOM RESULTSTATUS
Medico Glucose (serum) 121 Normal
Medico Blood Pressure systolic 137 mmHg
Medico Blood saturation 95 % Normal
Table 2. 1B: Data set from Provider B HOSPITAL
NAME
LABEL Sample OBS_VALUE UNIT OF
MEASURE
OBSERVATION
Steve Lancet Manual BP [Systolic] 20 Mmol/ml True
Steve Lancet Glucose Serum -
20
Both Table 2.1A and Figure 2.1B can be distinctly classified as structured data, but if the data from Table 2.1A and Table 2.1B were to be integrated, the data would then be semi-structured. The process of exchanging the data between provider A and provider B would be difficult due to the following issues in the data:
- Metadata integrity: Observation name and sample is concatenated into one field called Item in provider A, whereas for provider B there is a column for the sample called sample.
- Metadata and data inconsistency: Both providers have similar database attribute names, where even the method of measuring test units is not the same. Provider A uses mmHg for blood pressure unit of measure, while Provider B uses mmol/ml.
- Data integrity: Provider A stores the full observation name for oxygen saturation, while Provider B only stores an abbreviated (spO2) version of the analyte.
- Missing data: The sample attribute in Provider B does not have a value and this is an important attribute when managing laboratory tests.
Therefore, it can deduced that the above data is dirty or messy, it is filled with conflict, and this sort of data can mislead data analysis if the data cleaning process is not carried out correctly (Do, 2009). More details about data cleaning are covered in the current chapter in section 2.5.1, where the researcher will delve deeper into data cleaning strategies, including which ones are appropriate for clinically-based data. Thus far, the focus has been solely on data that is stored in tabular form such as tables, relations, arrays and spreadsheets, and this form of data storage is suitable for structured and semi-structured data.
Meanwhile, unstructured data is a lot more complex, because it is difficult to acquire, to store, to analyse, and to visualise. This sort of data is collected from different sources, at different intervals, and as a result, the data has a high possibility of becoming unstructured. Figure 2.3 presents a “word cloud” of unstructured data, which is aimed at giving an overview of what type of data is unstructured in the health care industry.
21 Figure 2. 3: Unstructured data word cloud
Acquiring unstructured data means: getting data from physical file processing systems; scanned files using text-extraction algorithms; organizational email servers; or through voice input. All these inputs require extra processing power and intelligence in order to extract and transform the data into a machine-understandable format. Hence, (Barbulescu et al., 2013) roughly defined unstructured data as the type of data that is easily understood by humans, but least understood by computers. Once the data is acquired, it is then to be stored in a format that allows it to be easily retrieved using a suitable query language.
It is reported that 80% to 85% of business information exists as unstructured data, which includes: organizational documents, images, emails, reports and more (Abdullah & Ahmad, 2013; Jing Gao & Koronios, 2015; Gharehchopogh & Khalifelu, 2011). It is thus a challenge for organizations to create value from this data, because it is not structured in a manner that would allow for accurate data analysis. Storing big data in the popularly used Relational Database Management Systems (RDBMS) would be a challenge, and more details about big data storage is covered in Section 2.6.6.
Once the unstructured data has been stored in a format that allows it to be queried and retrieved, then data analysis and even visualization can be performed on this data. Inasmuch as unstructured data poses a lot of challenges, it also presents a lot of
22
opportunities for organizations that are prepared to use efficient computer algorithms to analyze the data and create value from it. Algorithms that were fed lots of messy but relevant data performed better than the same algorithms with less but accurate data.
In that regard, IBM and Google’s language translation algorithms were compared against each other for performance. IBM is said to have fed their translation algorithm lots of accurate data sets for translation between English and French languages, where the algorithm performed fairly well. However, Google later fed their messy data sets from multiple and various data sources, including voice as input. At first, the translation was accurate to some degree, but with glitches. Over time, however, it performed better translating more than 60 languages, where even uncommon translations, such as from Hindi to Catalan, proved possible (Mayer-Schönberger & Cukier, 2013).
2.2.3 VELOCITY
It can be assumed that measuring a phenomenon gives one an advantage in gaining valuable information about that phenomenon. This emanates from observing environments where data is constantly being collected in huge quantities, over short time periods, and from various data sources, with the aim of identifying areas that could cause problems, or that could create value for organizations.
A Controller Area Network (CAN) is a valuable asset in mobile vehicles, because it constantly collects data while monitoring every state of the vehicle. The same can be said about a critically ill patient in a hospital bed, where the patient can be monitored at different intervals by machines and even by humans; and data is collected in real-time, with the objective of improving the patient’s outcomes. Patients with heart conditions can be given a wearable electrocardiogram (ECG) device that they can wear while at home, and this device constantly streams ECG measurements to the patient’s electronic health record system.
23
In 2004, Google started a project of digitising the world’s textbooks, and by 2012, 15% of those books had already been digitised. An estimated 130 million distinct books have been published since the invention of the printing press between 1440 and 1450, so Google was able to digitise 20 million unique textbooks in eight years. Not only was the content digitised, but it was also transformed into usable data that can be indexed, and comparable for analysis. The indexing of books reveals the need to use the data generated by hospital telemetry devices, where, as it stands, the ECG telemetry device connected to a patient is able to generate 1000 readings per second (Mayer-Schönberger & Cukier, 2013). However, this data is underused and thus wasted (Belle et al., 2015).
Digitising and indexing data raises challenges for the privacy and security of the organizations collecting data, where data is classified, and some has limited availability. The next section introduces data quality assurance as big data is acquired, stored, analysed and visualised.
2.2.4 VERACITY
Veracity results from collecting large sums of data. Where the data has been collected, the following questions ought to be asked to ensure data quality:
- How accurate is the data?
This quality indicator measures the correctness of data values stored for an object. e.g., a short date format for a South African date format is as follows “yyyy/MM/dd”, where storing date values as “2016/13/10” is not accurate, because the maximum month value is 12.
- Is the data recent?
This measures how up-to-date is the data. When it comes to health, doctors require relevant data to make informed decisions, where they need to measure the amount of cholesterol in the patient’s blood, the most recent information would be more relevant than old one, because the patient’s body changes over time, hence old information becomes irrelevant over time.
24
This measures the data uniformity, where, when sharing data, the data values and the metadata must always be consistent. If a “gender” field name is used to store gender information, at any point in the future, the same field must be used instead of alternating to a “sex” field name.
- Is it accessible, or is it private?
This measures how easily accessible the data is, and whether the data can be searched and retrieved. Other data is confidential, and should therefore always be treated as private data. This is sometimes encrypted, therefore, it should be possible to decrypt encrypted data.
- Can organizations trust this data?
This measures the integrity of the data in relation to where the data originates, and whether the data provider can be trusted. This question is even asked of the data manager themselves.
Since organizations share information between one another, it is of paramount importance that measures are taken to determine the trustworthiness of the data as well as the data providers (Dai, Lin, Bertino, & Kantarcioglu, 2008).
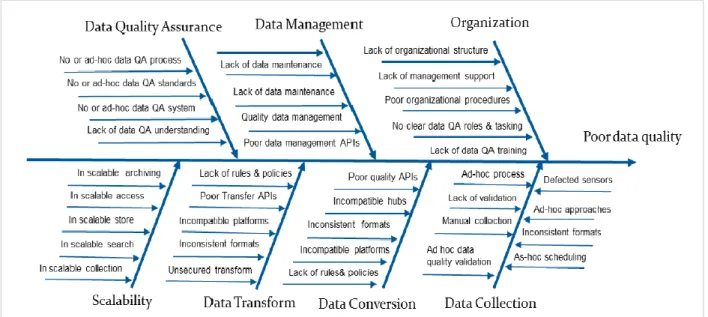
Answering these questions about the data ensures data quality assurance, which is defined as: the process of profiling the data to discover inconsistency, inaccuracy, incompleteness, and other anomalies in the data (Gao, Xie, & Chuanqi, 2016). Data cleaning, extraction, aggregation, transformation, and loading are all part of the data quality process.
When big data is collected, there is a high chance that the data will be unstructured as it was mentioned in Section 2.2.2, and some of the data might be redundant. Therefore, applying redundancy reduction and data compression can reduce redundancy, without affecting the validity of the values, thereby compressing the magnitude of the data for efficient data storage (Chen et al., 2014). In addition, there are other data issues that must be eliminated in order to improve data quality (see Figure 2.4). (Gao et al., 2016) suggested that organizations do not understand their data quality, and have difficulty understanding the reasons to invest in data quality.
25
Figure 2. 4: Factors affecting data quality(Source:(Jerry Gao et al., 2016))
In other instances, it is difficult to achieve data quality, because the data is deliberately messy, and is encrypted to ensure that confidentiality is not compromised. Health data has a high chance of being private, anonymous and secured, because it is sensitive, and an incorrect change to it could lead to wrong prescriptions being given to incorrect patients. According to (Kleynhans, 2011), in South Africa health information is not easily accessible because majority of the health institutions record patient information on a paper-based filing system. While South Africa lags behind in the digitisation of health records, in the United States of America (USA), patients are able to download their data using the blue button programme, so that patients and doctors can easily access this information (Turvey et al., 2014). Once the data has been downloaded, it can be accessible to authorised personnel, but, what are the risks to be mitigated that comes with big data?
2.2.5 THE RISKS OF BIG DATA
The availability of relevant information gives companies a competitive edge in business. Amazon can recommend ideal books to its users, while Google can rank and list the most relevant websites to its users, Facebook gives you the platform to find your long-lost friends, and governments use the census data to improve service delivery to its citizens. However, the government can turn this information into a system of repression,
26
where for example in 2013, Edward Snowden exposed mass data collection by the National Security Agency, who uses this data to spy on American citizens (Bilbao-Osorio, Dutta, & Lanvin, 2013).
Companies can misuse the data that users share on their platforms, selling it for revenue to advertisers without the platform users knowing that their personal information is being shared. It is not only the users’ privacy that is a concern with the use of big data, but in addition, there are the dangers of predictive analysis, when big data is used with algorithms to predict in advance whether a certain person is culpable for future actions. Actuaries use data predictively, and can calculate subjects such as, “men over 50 are prone to prostate cancer”, and therefore, any man that is over 50 years of age may pay more for health insurance, irrespective of their state of health. Predicting events before they happen could lead to discrimination against certain groups of people and also lead to guilt by association. In the US, the Department of Homeland Security uses big data to try and identify potential terrorists by monitoring body language, and other physiological patterns, and this could turn into a weapon of dehumanisation if big data and algorithms are used inappropriately (Mayer-Schönberger & Cukier, 2013).
It remains crucial to acknowledge that big data can offer incredible benefits to governments, companies and individuals, and contrarily, incorrect uses of big data pose privacy risks, discriminatory predictions, and overreliance on data. In order to minimise these risks, government policy makers should assess the value of data usage against the risks. A risk matrix framework can be developed to measure the use of data against potential risks, and they can also develop methods aimed at evaluating the practicality of obtaining true and informed consent to use the data. The most important societal values in communities are: public health, national security, environmental protection, and economic efficiency, and therefore, the ideas of privacy and data protection should be geared towards these areas (Tene & Polonetsky, 2012).
2.3 HEALTH SYSTEM APPLICATIONS AND THE INFLUENCE OF BIG DATA
In this section of the study the researcher attempts to show which systems are used to manage data in health care. On the following subsection, the researcher covers the