GRAU D’ENGINYERIA INFORMÀTICA
Facultat de Matemàtiques i Informàtica
Universitat de Barcelona
Collaborative filtering employing
users’ interactions in web
applications
Author: Sara Galindo Martínez
Supervisor:
Dr. Eloi Puertas i Prats
Co-supervisor: Guillermo Blasco Jiménez
Conducted at:
Departament de
Matemàtiques i Informàtica
Abstract
Currently, thanks to the Internet anyone has access to a large amount of data and for this reason it is essential to create new systems that help to understand that information in a little time. Recommender Systems are engines which allow to filter the information depending on people’s interests. There are different kinds of Recommenders and each of them has a different purpose. In this project, a case of use of aCollaborative filteringRecommender System is introduced employing every interaction users do while surfing the Stilavia web site as data input. In order to carry out this task, some scoring functions are required to generate a model. This model will be extrapolated throughout the whole dataset space thanks to a Machine Learning algorithm calledAlternating Least Squares(ALS) that is available in a library of the Apache Spark framework. Lastly, the results of each scoring function will be tested and evaluated employing a statistic estimator.
Keywords: Recommender systems, Data analysis, Collaborative filtering, Predictions, Machine learning, Business Intelligence.
Resumen
Hoy en día, cualquier persona tiene acceso a una gran cantidad de datos gracias a Internet y por ello es necesario crear nuevos sistemas que ayuden a digerir esa información en poco tiempo. Los Sistemas de Recomendación son motores que permiten filtrar la información dependiendo de los intereses de las personas. Exis-ten varios tipos y cada uno de ellos tiene un objetivo distinto. En este proyecto, se presenta un caso de uso de un Sistema de Recomendación tipoCollaborative Filter-ingen el que se usa como entrada de datos todas las interacciones producidas por los usuarios que navegan por la página web Stilavia . Para ello es necesario definir varias funciones de puntuación para poder generar así un modelo. Este modelo se extrapolará para todo el espacio del conjunto de datos gracias a un algoritmo de Machine Learning llamado Alternating Least Squares (ALS) el cual se encuentra disponible en una librería del frameworkApache Spark. Finalmente, se evaluarán los resultados para todas las funciones de puntuación conocidas utilizando un estimador estadístico.
Palabras clave: Sistemas de recomendación, Análisis de datos, Filtrado colaborativo, Predicciones, Aprendizaje automático, Inteligencia de negocio.
Actualment, qualsevol persona té accés a una gran quantitat de dades gràcies a Internet i, per aquest motiu, és necessari crear nous sistemes que ens perme-tin digerir aquesta informació en poc temps. Els Sistemes de Recomanació són motors que ens ajuden a filtrar la informació depenent de l’interès de cada per-sona. Existeixen diversos tipus i cadascun d’ells té un objectiu diferent. En aquest projecte, es presenta un cas d’ús d’un Sistema de Recomanació de tipus Collabora-tive Filteringque utilitza com a entrada de dades totes les interaccions produïdes pels usuaris que naveguen per la pàgina web Stilavia. Per dur a terme aquesta tasca, és necessari definir diferents funcions de puntuació per poder generar així un model. Aquest model s’extrapolarà per tot l’espai del conjunt de dades util-itzant un algoritme deMachine Learning anomenatAlternating Least Squares (ALS) el qual es troba disponible a una llibreria delframeworkApache Spark. Finalment, s’avaluaran tots els resultats per a totes les funcions de puntuació fent servir un estimador estadístic.
Paraules clau: Sistemes de recomanació, Anàlisi de dades, Filtrat col·laboratiu, Prediccions, Aprenentatge automàtic, Intel·ligència de negoci.
Acknowledgements
I would like to express my deepest gratitude to all those who gave me support to fulfil this project. I am especially grateful to my supervisor for helping me during these months offering me an extensive knowledge about the research field. Nevertheless, I am also grateful to my co-supervisor, for giving me the opportu-nity of having an internship in Stilavia. Also for introducing me in the Big Data world, a branch of Computer Engineering in which I was interested in having a bigger understanding about it and, finally for supporting me when I was not able to move on.
Last but not the least, I would like to thank my family, friends and, particularly, my boyfriend for giving me advice when I most needed it.
1 Introduction 1
1.1 Motivation . . . 2
1.2 Objectives . . . 2
1.3 Planning and organization . . . 2
1.4 Notation and terminology . . . 4
1.5 Dissertation structure . . . 5
2 Recommender systems 7 2.1 Goals of recommender systems . . . 7
2.2 Types of recommender systems . . . 9
2.2.1 Collaborative filtering . . . 9
2.2.2 Content-based filtering . . . 10
2.2.3 Hybrid recommender systems . . . 11
2.3 Advantages and disadvantages of recommender systems . . . 11
2.3.1 Collaborative filtering . . . 12
2.3.2 Content-based filtering . . . 13
2.3.3 Hybrid recommender systems . . . 13
3 Apache Spark 15
3.1 History . . . 15
3.2 Resilient Distributed Datasets . . . 18
3.3 Spark Ecosystem . . . 19
3.4 Spark Architecture . . . 20
4 Collaborative filtering for implicit feedback for Stilavia site 23 4.1 Analysis . . . 23
4.1.1 Scoring functions . . . 26
4.1.2 Matrix factorization . . . 28
4.2 Design . . . 29
4.2.1 System architecture . . . 29
4.2.2 Decisions about technology . . . 31
4.3 Implementation . . . 32
5 Results 35 5.1 Results of PRS . . . 37
5.2 Results of PBRS . . . 40
6 Conclusion 45 6.1 Conclusions and Future work . . . 45
6.2 Conclusions about the project . . . 47
Bibliography 49
Appendices 57
Types of events 59
.1 Results of PRS . . . 67 .2 Results of PBRS . . . 73
1.1 Project tasks planning employing a Gantt diagram. . . 3
2.1 Long tail function shows that most people have mainstream tastes. . 12
3.1 Description of MapReduce Programming Model performing a word count application. . . 17 3.2 Components of Apache Spark. . . 20 3.3 Overview of Spark architecture. . . 22
4.1 Number of events that have been triggered daily during 30 days grouped by type. . . 25 4.2 Number of events that have been triggered hourly during 24 hours
grouped by type. . . 25 4.3 Application’s pipeline. . . 30 4.4 Communication between the batch and the web API application. . . 31 4.5 K-folds Cross Validation method employed to evaluate how good is
the resulting model. . . 34
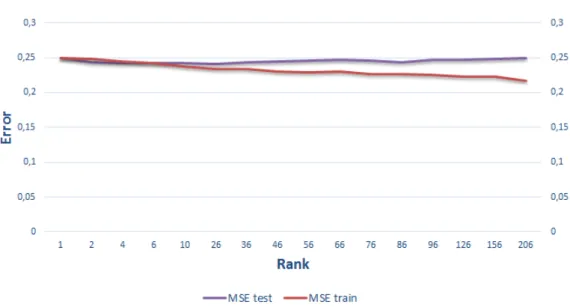
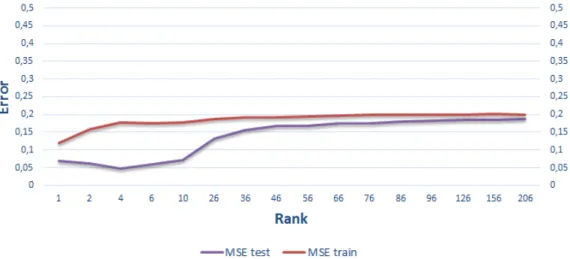
5.1 Training and testing MSE trend of PRS using the scoring function S3 and the parameter Set 1. . . 38 5.2 Training and testing MSE trend of PRS using the scoring function
S3 and the parameter Set 2. . . 40 ix
5.3 Training and testing MSE trend of PBRS using the scoring function S3 and the parameter Set 1. . . 41 5.4 Training and testing MSE trend of PBRS using the scoring function
S3 and the parameter Set 2. . . 43 1 Training and testing MSE trend of PRS using the scoring function
S1 and the parameter Set 1. . . 68 2 Training and testing MSE trend of PRS using the scoring function
S1 and the parameter Set 2. . . 69 3 Training and testing MSE trend of PRS using the scoring function
S2 and the parameter Set 1. . . 71 4 Training and testing MSE trend of PRS using the scoring function
S2 and the parameter Set 2. . . 72 5 Training and testing MSE trend of PBRS using the scoring function
S1 and the parameter Set 1. . . 73 6 Training and testing MSE trend of PBRS using the scoring function
S1 and the parameter Set 2. . . 75 7 Training and testing MSE trend of PBRS using the scoring function
S2 and the parameter Set 1. . . 76 8 Training and testing MSE trend of PBRS using the scoring function
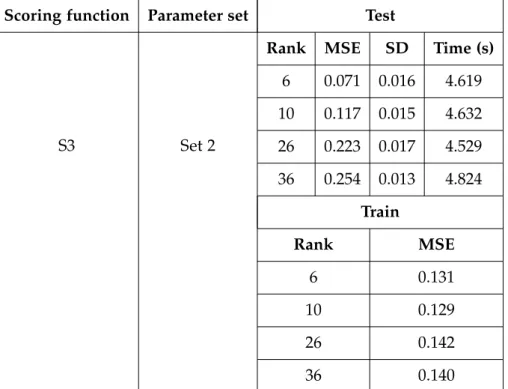
5.1 Set of parameters used in the evaluation stage. . . 35 5.2 Scoring functions employed in the evaluation stage. . . 36 5.3 Evaluation of PRS using the scoring function S3, which takes into
account the types of events and the time when they were triggered, and the parameter Set 1, which its purpose is focused on buying products. . . 38 5.4 Evaluation of PRS using the scoring function S3, which takes into
account the types of events and the time when they were triggered, and the parameter Set 2, which its purpose is focused on engaging users. . . 39 5.5 Evaluation of PBRS using the scoring function S3, which takes into
account the types of events and the time when they were triggered, and the parameter Set 1, which its purpose is focused on buying products. . . 41 5.6 Evaluation of PBRS using the scoring function S3, which takes into
account the types of events and the time when they were triggered, and the parameter Set 2, which its purpose is focused on engaging users. . . 42
1 Types of events . . . 59
2 Evaluation of PRS using the scoring function S1, which takes into account the types of events, and the parameter Set 1, which its pur-pose is focused on buying products. . . 67
3 Evaluation of PRS using the scoring function S1, which takes into account the types of events, and the parameter Set 2, which its pur-pose is focused on engaging users. . . 69 4 Evaluation of PRS using the scoring function S2, which takes into
account when the events were triggered, and the parameter Set 1, which its purpose is focused on buying products. . . 70 5 Evaluation of PRS using the scoring function S2, which takes into
account when the events were triggered, and the parameter Set 2, which its purpose is focused on engaging users. . . 71 6 Evaluation of PBRS using the scoring function S1, which takes into
account the types of events, and the parameter Set 1, which its pur-pose is focused on buying products. . . 73 7 Evaluation of PBRS using the scoring function S1, which takes into
account the types of events, and the parameter Set 2, which its pur-pose is focused on engaging users. . . 74 8 Evaluation of PBRS using the scoring function S2, which takes into
account when the events were triggered, and the parameter Set 1, which its purpose is focused on buying products. . . 75 9 Evaluation of PBRS using the scoring function S2, which takes into
account when the events were triggered, and the parameter Set 2, which its purpose is focused on engaging users. . . 77
Introduction
Some time ago, when a company was looking for a way to understand the data they are producing, they had to ask for external services in order to find out rele-vant information that helps them to make strategic decisions about its own busi-ness. These services consisted of a group of employees whose job was to carry out an in-depth investigation based on analysing data manually with the purpose of discovering regular patterns and trends applying statistic methods. This ana-lytical study took considerable time, effort and the results were not immediate. In addition, it represented a significant cost to the company because they had to pay intermediary companies periodically, as data are constantly changing and new reports were required. Over the time, technology has evolved and currently analysing data is automated and developed by computers. Thanks to databases and Big Data technologies, this task has become simpler every time and the results are obtained quickly and efficiently depending only on its own IT department and not in an external company. This investigation area has suffered a vertical integra-tion, going from an external service, to being integrated in the main business. Data analysis is an essential process that enables to know how the business is go-ing. It allows to discover which are the strengths and weaknesses of the business process, even to learn if there are unexpected trends that can be taken into account especially when starting an advertising campaign. Businesses can take advantage of this information maintaining the good service in everything which is already working properly and enhancing what is not running as intended. In order to find trends and regular patterns in customers’ behaviour or tastes, there exists some engines called Recommender Systems which its aim is basically to find correla-tions in data. Combining these systems with the analysis task is key as they are
Chapter 1. Introduction 2
able to predict what the customers are likely to prefer in the future studying all the available data.
1.1
Motivation
Stilavia is an E-commerce website that offers clothes, shoes and accessories that can be bought in Spain and United Kingdom. They have available a stylist wizard that helps users to find products that best fit them. In order to do this, there is a section where users can fill in a profile adding information about their hair, eyes and skin colour. Later, they can express their opinion about different parts of their body they want to enhance or reduce. From this information, the system is able to recommend products based on the users’ physical appearance and their body aspirations.
Sometimes recommending products taking into account only users’ features is not enough to encourage buying the recommended products. For this reason, setting up a new recommender system which analyses all the interactions users do during their visit could be the key to increase the volume of sales and achieve loyal users which are essential in this kind of websites. Analysing the actions users do when surfing the site is useful as their tastes can be used particularly in marketing strategies. It makes sense to recommend those products users have visited several times.
1.2
Objectives
The main objectives of this project are basically three: (1) creating a recommender system employing implicit feedback and applying it to two different concepts (Products and Product Box), (2) defining different scoring functions for this recom-mender system and, finally, (3) evaluating these scoring functions and discussing which of them obtains better results.
1.3
Planning and organization
Figure 1.1 shows the period of time in which the project was developed. It starts on the 12th of September and ends on the 26th of January. The diagram displays
the different tasks that have been done during this time classifying them in three stages: Documentation, Code and Thesis.
Chapter 1. Introduction 4
The first task that was carried out is the Documentation stage. It includes tasks that are related to learn the main concepts of the technologies that are going to be used in later stages. Learning about the technology before using it is essential as it avoids wasting time on developing features that they do not support. Some technologies that were checked out are: Elasticsearch and Kibana as tools that help visualizing data. Several academic papers were studied during two weeks in order to acquire further knowledge about some Recommender Systems. Finally, Pyspark was chosen as the default Big Data framework. At the end of the Documentation stage, some scoring functions were analysed in order to have some options that could be used in the next stage.
Once this stage was complete, the main task was the development of the software. While the code was being developed, some drafts of the dissertation were also written in order to gather all the details of what was being done. This was a good decision as at the moment of writing the final dissertation these drafts were really useful.
1.4
Notation and terminology
During the section 4.1, which is focused on the analysis of the project, the same set of variables and functions are used to achieve a greater understanding of the problem that is going to be solved later. Here is available a list that contains the symbols and descriptions:
Symbol Description u User p Product U Set of users P Set of products L Subset ofU×P
s(L) Function that returns all the scores
¯
s(u,p) Real score of useruon product p
e Event
Eu,p Set of all possible events
w Event’s weight
Symbol Description
τ(e) Function that returns the type of an event
Se Generic event scoring function
t Time
m Curve slope
Sig(x) Sigmoid Function that normalizes a score between 0 and 1
N Number of users
M Number of products
RN×M Rating or scoring matrix
Q Products’ matrix in Matrix Factorization
T Users’ matrix in Matrix Factorization
K Number of features in Matrix Factorization method
k Number of folds in a K-Folds Cross Validation method
1.5
Dissertation structure
The project is divided into 6 different chapters and each of them is going to be briefly described in the following lines:
• Chapter 1 - Introduction: This chapter explains the background, motivation and the objectives of this project. In addition, there is a schedule where the period of time when every task was developed is shown. Finally, it also includes a section that introduces the notation that is used when analysing the problem in Chapter 4.
• Chapter 2 - Recommender Systems: This chapter explains one of the states of the art of this project. Basically, here it is introduced every type of rec-ommender system including which is the objective of every different recom-mender and a short discussion about the advantages and disadvantages that they produce while being used.
• Chapter 3 - Apache Spark: This chapter talks about the second state of the art of the project which is the framework Apache Spark. First, it explains this software history in order to know the reasons why it was created, next a data type specially developed for this framework is widely explained, and finally the available libraries and the architecture are discussed.
Chapter 1. Introduction 6
• Chapter 4 - Collaborative filtering for implicit feedback for Stilavia site: This chapter contains the main purpose of the project as it explains the analysis, design and implementation of the project itself. In the analysis section the problem is mathematically defined in order to be solved, then, in the design section appears the existing system architecture and also all the reasons for choosing a specific technology instead any other. Lastly, in the implementa-tion secimplementa-tion it is explained the soluimplementa-tion that is carried out to solve the given problem.
• Chapter 5 - Results: This chapter includes all the output obtained in the evaluation stage using different tables and charts.
• Chapter 6 - Conclusion: Finally, this chapter sums up the whole project giving the conclusions about the project, adding some personal opinions and offering advice about what could be added in the implementation stage in a future work.
After the 6 main chapters, there is available a compilation of the websites and books that have been used and visited in order to achieve the implementation. At the end there are also 3 appendices that include further details about the informa-tion used during the project development.
Recommender systems
Currently, there is a wide range of items available on-line to choose from and con-sequently, a lot of users spend several hours in front of a screen deciding which are the most suitable items for them. Recommender systems have become very pop-ular in nowadays applications, as they solve this challenge helping users make decisions in order to obtain personal and high-quality recommendations. These engines are used in different areas and suggest items such as videos (Youtube), movies (Netflix), music (Spotify), news (Google News), books (Amazon), restau-rants (Tripadvisor) and so on.
This chapter is organized as follows: Section 2.1 discusses the main objectives of a recommender systems and explains the two different ways in which data could be obtained; Section 2.2 introduces the different types of recommender systems; Section 2.3 focuses on the strengths and weaknesses of each type of recommender system.
2.1
Goals of recommender systems
Recommender systems suggest items to users depending on their needs, tastes and preferences. It is a useful and powerful tool that allow users to filter through a considerable number of items.
Such applications need to pick up information about every user to know about their interests or habits. The information collected, which is completely crucial to make recommendations, comes from the feedback users generate when interacting
Chapter 2. Recommender systems 8
with the platform. This feedback can be acquired in two different ways: explicitly and implicitly.
On the one hand, explicit feedback means that the platform needs to ask users directly their opinion, for example using surveys or simply, rating or scoring some items using a numerical scale. On the other hand, implicit feedback requires to observe and track users behaviour to record information such as clicks, purchases, mouse movements, how much time users spend watching a specific page or even, demographic data.
In explicit feedback, ratings indicate users preferences, likes or dislikes. An exam-ple could be a typical scale from 1 to 5, namely a five-level Likert scale, where 1 means "totally dislike" and 5 "really like". However, in implicit feedback, numer-ical values represent the level of confidence which can describe the frequency of actions or the amount of times a certain action is done by a user.
After selecting a way to collect data and before developing this kind of systems, it is important to keep in mind which are the main goals to achieve. The most common goals are explained below.
First of all, relevance is the most important objective of recommender systems because they are supposed to recommend items which are relevant to users. Users are more likely to consume items they find interesting.
Secondly, serendipity which refers to recommend items which are unexpected and completely appropriate for the user. Recommender systems must surprise users suggesting items that they do not know they might appeal. The surprise factor is key and it could enhance the expected profit of a business if its aim is selling products.
Thirdly, novelty which is basically the ability of suggesting new items. These sys-tems usually recommend isys-tems relying on what users have not seen yet. This technique is very helpful but it becomes inefficient when the system tends to re-peat recommendations. This problem can also reduce the items diversity.
Lastly, diversity draws attention to the fact that the system should recommend very different products to the same user. This factor is directly related to novelty because it is necessary to offer innovative items in order to keep users attention. However, there is the drawback that users might get bored and will stop using the application.
them are taken into account, the consequences will be very positive. For example, the number of loyal users could grow as well as the traffic in the platform or maybe, the amount of sales.
2.2
Types of recommender systems
Recommender systems are generally divided into three distinct groups which are based on different approaches. They are called Collaborative filtering, which makes recommendations using past experiences of similar users; Content-based filtering, which suggests items taking into account only the taste of the user and the items’ characteristics; and Hybrid recommender systems, which is a combina-tion of the two previous methods.
2.2.1 Collaborative filtering
The main objective of Collaborative filtering is to employ users’ information to predict which items a user is likely to prefer relying on similar users, which are also known as peer users, or similar items. In this case, information about items is not required to make recommendations. These two approaches are commonly known as user-based Collaborative filtering and item-based Collaborative filtering. In respect of the user-based strategy, users are considered like-minded if they have been interested in the same items. This kind of recommender system assumes that if users have had the same tastes until now, they are unlikely to change in the future. So, image that there is a dataset about music. For example, if user X and user Y have a similar purchase history and user X has recently bought a song that user Y has not listened to, the main idea is to recommend that song to user Y. Furthermore, in item-based approaches the main idea is to find similarities be-tween items and not bebe-tween users. Two items are similar if a large amount of users have expressed the same opinion about them. Using as reference the previ-ous example, if many people who have bought song 1, including user X, tend to buy song 2 and user X has not bought it, the aim of this strategy is to recommend song 2 to user X. This idea was invented by Amazon and nowadays they employ it when users add products to their shopping cart or while users are watching a product in particular.
Chapter 2. Recommender systems 10
that is, their past transactions or actions carried out in the platform.
These transactions can also be converted to ratings aggregating weights depend-ing on the type of action users have triggered. Unfortunately, it is impossible to know what items users dislike because of the absence of negative feedback. It is reasonable to believe users do not like that items which they did not interact with. However, this is not completely true because the user may not have know of their existence. Actually, there are no procedures to specify displeasure for an item. In addition, some actions cannot reflect users’ preferences, such as buying an item as a gift or staying a long time watching the same item because they have fallen asleep.
To summarize, explicit feedback is the most precise method to know users’ opin-ions because it is obtained directly from them. Although implicit feedback has some drawbacks, such as the lack of negative opinions and the existence of data which does not represent users’ tastes, there is no mechanism to recognise and filter these data.
In section 2.3.1, the advantages and disadvantages of this method will be dis-cussed.
2.2.2 Content-based filtering
Content-based filtering is a non-collaborative method that recommend items based only on the content, not on users’ opinions. Content refers to items’ descriptions or characteristics that could be introduced in the system manually or extracted automatically looking for keywords in a document or media. The aim is to figure out the items which match the users’ interests best. For this reason, this technique creates a profile for every user in order to indicate their interests for each item characteristics.
The typical examples of content-based recommenders are systems that recom-mend new textual documents such as articles, web sites, blogs or books. In this case, it is necessary to scan all the document in order to identify which are the attributes of each item looking for keywords. This is a challenging task because it is necessary to find a correlation between words
Supposing there is a dataset, this time about movies. In this case the possible keywords or characteristics might be metadata such as the genre, the author, the
actors, etc. For instance, if one user have watched every episode of the Star Wars saga, this user is likely to prefer science-fiction movies, other films created by George Lucas or perhaps, any movie where Harrison Ford appears.
In section 2.3.2, the advantages and disadvantages of this method will be dis-cussed.
2.2.3 Hybrid recommender systems
The two previous recommendation approaches can be combined in order to achieve the best of both worlds. The process of combining those methods is called hy-bridization. Hybrid recommender systems create a robust model that improves the performance of each recommender system overcoming some of the problems they have. This kind of systems allows the obtaining of more accurate recommen-dations.
There are many possible implementations to create a hybrid recommender system as there are multiples ways to combine the recommendation techniques together. There is no clearly defined structure for implementing hybrid systems because each of them is different and unique.
In section 2.3.3, the advantages and disadvantages of this method will be dis-cussed.
2.3
Advantages and disadvantages of recommender systems
Each type of the commented recommender systems has its own strengths and weaknesses. However, there is a setback that these three methods have in com-mon which is called cold start and it generally occurs when the system has been set up. This issue implies that there are not enough data to recommend items consequently, recommendations will not make sense and will be surely wrong. In the case of Collaborative filtering, it usually happens when there is no infor-mation of similar users or a new item is introduced. Nevertheless, Content-based filtering methods suffer this problem because of the lack of content or information about items.
Below, the advantages and disadvantages of each type of recommender are going to be discussed individually.
Chapter 2. Recommender systems 12
2.3.1 Collaborative filtering
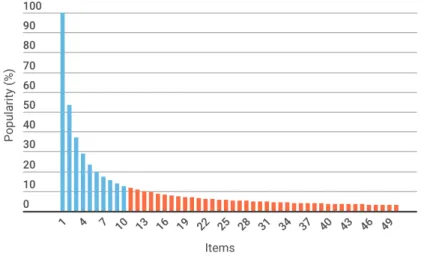
Collaborative filtering methods are valued for their simplicity but they do not work properly in all situations. The main challenge of this method is that data is sparse due to the fact that people only express their opinion on a small fraction of the large wide range of available items. This is one of the reasons why this kind of systems suffers from the cold start problem. Nevertheless, this problem does not happen when data is collected implicitly, unless users give approval to collect the data they produce, because any user can give their opinion whenever they feel. Finding a right recommendation for people with non-mainstream tastes is ex-tremely difficult. This situation is known as Long tail phenomenon and is also a consequence of the data sparsity. It is trivial to recommend popular items because they are rated by many people but, when items have only little feedback, namely niche items, the task becomes very complex.
Figure 2.1: Long tail function shows that most people have mainstream tastes.
Figure 2.1 shows a Long tail function plotted in two different colours. To the right in orange, there is the long tail referring to niche items which represent 80% of the total items; to the left, there are items that most people like or rate which represent the remaining 20%. It is commonly said that this 20% of items generates 80% of sales or benefits. For this reason, businesses are interested in selling items that are more market demanded. However, the real meaning of long tail is that benefits would be higher if businesses focused on the 80% of rare items.
not require information about items because it does not use the item information to make recommendations. Therefore, it is not necessary to update the description or characteristics of the available items, which is time-consuming.
In addition, the fact that recommendations are not defined through items’ de-scription means that they are personalized according to other users’ experiences. Hence, the possibility of finding out a surprising and interesting suggestion is quite high.
Finally, a major appeal of Collaborative filtering is that it is domain free and so it can cope with difficult data aspects that other techniques cannot identify.
2.3.2 Content-based filtering
Content-based filtering does not depend on users’ preferences, therefore recom-mendations are more objective and are focused on the item itself. New items can be suggested as soon as their information or attributes are available. However, the system is not effective at suggesting recommendations for new users because they do not have any history of their preferences to rely on.
Sometimes, this method provides obvious and irrelevant recommendations be-cause the use of the items’ characteristics. For example, if a user has never watched horror films the system will not recommend any film of that genre to them. This fact reduces the diversity of the recommended items leaving behind one of the main goals of recommender systems.
2.3.3 Hybrid recommender systems
As discussed in the previous section 2.2.3, this kind of systems could be more effective in some cases using each approach, Collaborative filtering and Content-based filtering, separately.
This approach can be implemented in various ways and, in all of them, some of the common problems of recommender systems disappear, such as sparsity or cold start.
Apache Spark
Due to the growth of data, some of the usual tools used for Big Data applications have become obsolete and old-fashioned as they cannot manage such a quantity of data efficiently. Apache Spark appeared just in time improving the existent methods and providing new innovative features. Currently, Apache Spark has become one of the most used frameworks in this area.
This chapter is organized as follows: Section 3.1 introduces the popular frame-work Apache Spark explaining mainly which is the main reason of its creation; Section 3.2 focuses on an object structure that is key in Spark framework; Section 3.3 provides a high-level overview of what components Apache has available; Sec-tion 3.4 explains which architecture Spark uses including a brief discussion of its components.
3.1
History
Apache Spark is an open source cluster computing framework originally devel-oped in 2009 in UC Berkeley’s AMPLab, which it started being a simple research project. It was first open sourced in 2010 and it was in 2013 when the project was transferred to Apache Software Foundation as a top-level project. Since its cre-ation, many people have been interested in being part of it helping freely, so that a community was created with the purpose of contributing in each release. Nowa-days, this community is very active and the number of contributors is growing as time goes by. Some of the major contributors to Spark include Databricks, Yahoo! and Intel.
Chapter 3. Apache Spark 16
The researchers of UC Berkeley had been working on Hadoop MapReduce and they realized this kind of operation was inefficient for iterative and interactive computing jobs because of the high-latency. Spark was created to overcome this problem as it was lightning-fast and general purpose. It was thought as an al-ternative or enhancement of Hadoop MapReduce rather than a replacement of it.
This big data processing platform explores data interactively, when before its cre-ation, people were waiting minutes or even hours processing data. Spark is faster because it holds intermediate results in memory instead of writing them to disk, which is time-consuming, and also because of its efficient fault recovery. If this engine cannot store the whole dataset in memory, the system has no choice but to store the remaining data on disk. In comparison with Hadoop MapReduce, Spark applications run up to 100 times faster in memory and even 10 times faster even when running on disk. That was possible thanks to the concept of Resilient Distributed Dataset (RDD) that will be explained in detail in section 3.2.
This engine let programmers write parallel computations using a set of high-level operators without having to bother about work distribution or fault tolerance. Spark is written in Scala Programming Language and runs on Java Virtual Ma-chine (JVM) environment and lets programmers write applications in different languages as it offers APIs for Scala, Java, Python and R, among others.
MapReduce is a programming model for large scale parallel and distributed pro-cessing in clusters. As it was earlier pointed out, one of the most popular open-source implementation is Hadoop. As its name suggests, there are two basic pro-cedures in MapReduce which are map and reduce, and they are supposed to be written by the programmer. This kind of operations allows the handling of a big amount of data that is difficult to fit in memory. Actually, there are two more extra phases transparent to programmers which are splitting and shuffling. The first one is executed before the mapping procedure whereas the second is carried out after mapping and before the reducing phase.
The splitting phase divides the input dataset into pieces of information following a specific criteria. After that, the map procedure takes those pieces and transforms them into a series of key/value pairs producing a set of intermediate key/value pairs. Then, the shuffling phase groups all the intermediate values, associated with the same key, together. This new key/value pairs are going to be the input of the reduce procedure. Finally, the reduce function, iterates through the values
that are associated with a specific key, it merges together these values and lastly, it produces a single output which could be just zero.
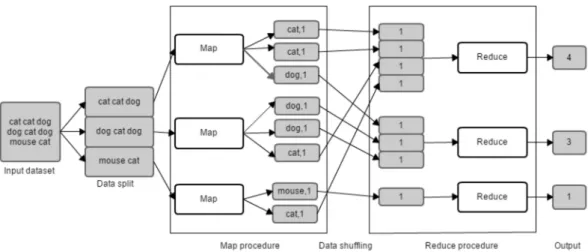
A typical example of MapReduce is a simple application that counts the number of occurrences of each word in a given input set. In figure 3.1, there are shown the different phases of performing that example using the MapReduce framework.
Figure 3.1: Description of MapReduce Programming Model performing a word count application.
First of all, data is divided into portions in order to speed up work. Each partition is going to be parallelized in different mappers or machines. Arrows symbolize parallelization. In this case, the dataset is composed by a text so that, it will be splitted up into sentences. Hence, keys will be words and values will represent the frequency in which that words appear in the analysed sentence.
Next, each sentence will be processed by a mapper and shuffled by key for the purpose of grouping all values of the same word.
Lastly, the reducing phase makes an aggregation of each group of values produc-ing an unique number. There will be as many numbers representproduc-ing the number of occurrences as distinct keys.
Chapter 3. Apache Spark 18
3.2
Resilient Distributed Datasets
Resilient Distributed Dataset or RDD is the core concept in Spark framework. For-mally, it is defined as a read-only collection of records partitioned across multiple machines or nodes. It can be created through different deterministic operations: (1) parallelizing an existing collection, (2) obtaining data in stable storage like a file system or (3) transforming a new RDD.
These type of structures allows programmers to reuse data persisting intermediate results in memory, tp control partitions in order to optimize memory and, finally, to manipulate data using a wide set of operations.
RDD supports two types of operations: transformations and actions. Transfor-mations return a new RDD. Some examples of transformation functions are map, filter, reduceByKey, aggregateByKey and groupByKey. However, actions evaluate, return the result value and let the system materialize the RDD. Some examples of action operations are collect, reduce, count, max, min first and take.
Despite the fact that RDD are immutable, RDD can be modified with a transfor-mation that will return a new RDD while the original RDD will remain the same. Transformations are lazy which is to say that they are applied only once they are materialized. Lazy evaluation helps with the optimization of the overall data processing workflow. RDDs keep the information about how it was derived in a transformations queue. When it is time for materialization, each transformation of that queue, which was previously optimized, is applied sequentially to the RDD and then, it is materialized with an action operation. Consequently, if a partition of an RDD is lost, this object has enough information to be able to recreate and recompute that partition in a short time. Hence, recovery does not need to main-tain a material replica of the RDD or to take a snapshot of the whole application, which is an advantage.
Next, there is again the example of a word count application where a RDD is transformed in order to build a dataset composed by pairs of (String, Int). RDD is created in the first line through a file system using the function textFile. Then, some transformations are applied to this RDD such as flatMap which splits the text into sentences, map which creates a new key/value pair that assigns a value to each key or word and finally reduceByKey, that sums all values by key. This last operation is an action responsible for materializing the RDD and it returns how many times each word appears. After materialization, the RDD is stored into a new file using the function saveAsTextFile.
t e x t _ f i l e = s c . t e x t F i l e ( " hdfs : / / . . . " )
counts = t e x t _ f i l e . flatMap (lambda l i n e : l i n e . s p l i t ( " " ) ) \ .map(lambda word : ( word , 1 ) ) \
. reduceByKey (lambda a , b : a + b ) counts . s a v e A s T e x t F i l e ( " hdfs : / / . . . " )
Finally, only two aspects of RDD can be controlled by the programmer: persistence and partitioning. It can be chosen which RDD to keep in memory in order to be faster or even, it can also be indicated how to distribute each element across machines. By default, RDDs are persisted in memory but the system can spill them if there is not enough RAM.
3.3
Spark Ecosystem
The Spark core is focused on the RDD abstraction and it has different tasks to schedule such as memory management, fault recovery and interacting with stor-age system. As shown in 3.2, there are additional libraries that are part of the Spark ecosystem and support extra features related to Big Data analytics and Ma-chine Learning areas. These libraries are the following:
Spark SQL
Spark SQL is a module that works with structured data and it allows querying data via SQL, as well as different variants of it, providing a programming abstrac-tion called DataFrames.
Spark Streaming
Basically, this component enables programmers to process real-time streaming data. Is a powerful library designed to provide the same fault tolerance char-acteristics and scalability as Spark Core.
Chapter 3. Apache Spark 20
MLlib
MLlib, an acronym for Machine Learning library, is composed by different com-mon learning algorithms and utilities, such as classification, regression, clustering, collaborative filtering and so on. It has quickly emerged as an essential piece in mining Big Data for actionable insights.
GraphX
GraphX is a library designed to manipulate graphs and performing graph-parallel computations. It includes a huge collection of graph algorithms and builders with the intent to simplify graph analytic tasks.
Figure 3.2: Components of Apache Spark.
3.4
Spark Architecture
Spark uses a master/slave architecture where the main coordinator is called driver program which runs the main process of the application creating the SparkCon-text1.
The objective of the driver program is to divide the application into small pieces of work called tasks. Each task is going to be send to one executor, therefore the driver program needs to talk to the cluster manager, also known as master, to decide which executor to send that task to. Executors are slaves processes that are able to run a specific task or tasks. In Spark environment slaves are called workers.
Figure 3.2 shows the main components of Spark architecture that are going to be analysed individually.
Driver program
As mentioned above, the driver program runs the application creating a Spark-Context instance that connects to a cluster of workers and coordinates them the execution of certain tasks. It has a web UI2, typically running in port 4040, that displays information about running tasks, executors and storage usage.
Cluster manager
The cluster manager is an external service that represents the master and acquires the resources of the cluster. Spark can support three types of cluster managers: Standalone manager, Mesos and YARN.
The Spark Standalone manager is included with the Spark distribution and it makes easy to set up a cluster because it is resilient to worker failures. It can run on Linux, Windows, or Mac OSX. Standalone mode is the easiest way to configure a cluster manager if programmers have never used this framework before.
Apache Mesos is a distributed system kernel that can manage resources for appli-cation and support Docker containers. This cluster manager can also run Hadoop MapReduce and service applications. It has APIs for Java, Python, and C++ but can only run on Linux or Mac OSX.
Hadoop YARN3 is a distributed computing framework for job scheduling and the resource manager in Hadoop 2. It can run on Linux and Windows.
The following line of code allows to start a standalone master server: . / s b i n / s t a r t−master . sh
2UI: User Interface.
Chapter 3. Apache Spark 22
Worker Node
A worker node represents a slave that can run application code in the cluster and posses the executor process. Programmers are able to set up how many workers there are and which master each worker is associated to.
The following line of code allows the starting of one or more workers and con-necting them to the master:
. / s b i n / s t a r t−s l a v e . sh <master−spark−URL>
The master’s URL refers to the master’s web UI which is http://localhost:8080 by default.
Executors
Each application has its own executors and its main objective is to run tasks and keep data in memory or disk storage across them.
In following figure, it is shown how the components of Spark interrelate among each other:
Collaborative filtering for implicit
feedback for Stilavia site
After having read the two previous chapters, which introduce the main topics related to the project, it is the right time to focus on the application itself.
This chapter is organized as follows: Section 4.1, in essence, explains what the project is about, mentioning what the system is used for and which problems it solves; Section 4.2 focuses on the technologies used to develop the project; Sec-tion 4.3 provides an explanaSec-tion about the development of the project including algorithms that are key in the process.
4.1
Analysis
The main objectives of E-commerce platforms are basically two: (1) engaging users and (2) selling products. The idea of attracting people is essential in such applica-tions to make the platform more popular and to attract new users. Some of these new users could become loyal users, who are always faithful to the website and generate a regular activity in the website. Regarding selling products, this is also a very important objective because business are interested in increasing the amount of sales, which is to say, achieving more profit.
Some businesses have chosen to integrate recommender systems to their websites as a remarketing tool in order to achieve these two goals. These engines help users to find out items to purchase depending on their tastes. The Stilavia’s website has
Chapter 4. Collaborative filtering for implicit feedback for Stilavia site 24
available items that are products related to fashion, such as clothes, shoes and accessories.
The Stilavia’s recommender system needs to collect and record information from the website to know something about users to make custom recommendations. This information is generated when users surf the web application. Then, numer-ous web events are triggered because they are interacting continunumer-ously with some of the website elements.
An event is an action indicating that something has happened like a mouse click or a keystroke. In this case data is collected implicitly which is a way of collecting data that was explained in detail in section 2.1. because the system is observing users’ behaviour and is not asking users for extra information.
In Stilavia’s website there are different types of events grouped according to their purpose. The table 1 in Appendix A shows all the types of events that the website is able to record with the purpose of tracking users’ actions.
The most relevant actions or events are those that are related to users and products such as buying a product called BUY_PRODUCT, sharing a product composed by FACEBOOK_SHARE, TWITTER_SHARE and PINTEREST_SHARE, saving a product in a wish list called SAVE_PRODUCT or simply, viewing a product called POV_PA-GE_VIEW.
There is another concept called product boxes, these boxes contain a set of prod-ucts with common features. The most relevant events to recommend these boxes are seeing a product box called PRODUCT_BOX_VIEW, clicking in a product box called PRODUCT_BOX_HIT and showing a product box PRODUCT_BOX_IMPRE-SSION.
The following figures are examples of charts that have been obtained during a prior data analysis with the purpose of showing how the data is distributed. Each figure has a caption explaining what the bar charts are showing.
In figure 4.1 it can be seen that the most triggered event is PRODUCT_BOX_IMPRE-SSION that denotes a click in a set of products. The figure shows which day had the highest number of interactions, in this case the 27th of December.
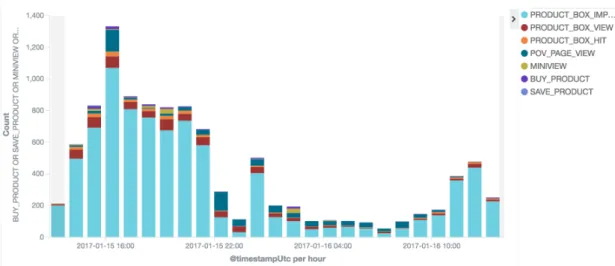
On the other hand, figure 4.2 shows what is the daily hour when users interact more with the Stilavia site. It can bee seen that at 16:00 the site produces more events. On the other hand, after 00:00 the number of interactions decrease due to people will probably be sleeping.
Figure 4.1: Number of events that have been triggered daily during 30 days grouped by type.
Figure 4.2: Number of events that have been triggered hourly during 24 hours grouped by type.
As it is said in chapter 2.1, scores are crucial to determine which products are likely to be preferred by one user. When recommender systems collect data implicitly, scores need to be worked out by the programmer.
Next, the context of the problem is introduced to provide a successful understand-ing of the different scorunderstand-ing functionssthat are immediately analysed afterwards.
Chapter 4. Collaborative filtering for implicit feedback for Stilavia site 26
GivenUa set of users, Pa set of products ands the score of useru on productp.
s:U×P→[0, 1]
The score s is a real number that represents users’ affinity or, in other words, their level of confidence in one product. The value is bounded between 0 and 1 and its meaning depends on the score’s function purpose. In addition, as stated before, s is calculated from the events triggered by users when interacting with the platform.
Let Lbe a subset ofU×Pwhich is the space where the scoreswill be defined.
L⊂U×P
Note that in the real world, users usually interact with some products, not with all of them. For this reason, a high proportion of scores ins(L)are null whereas, the rest are real scores defined as ¯s(u,p). In order to extrapolate the scoring function throughout the rest of U×P space, Collaborative Filtering (CF) methods will be used. s(L) = ( ¯ s(u,p), when(u,p)∈ L 0, otherwise 4.1.1 Scoring functions
First of all, some different scoring functions will be introduced. The first purpose is to sum all weights associated to each event type only if this kind of event has happened.
∑
τ∈{τ(e)|e∈Eu,p
wτ
where e is the event, Eu,p is the event set of one user for one product, wis a real
number that denotes the event’s weight and, lastly, τ representing the type of
event such thatτ∈ {b,shf b,shpt,shtw,s,v}.
One of the advantages of using this function is the fact that the score is already bounded between 0 and 1; and as long as the sum of all weights is 1, that dimen-sioning would be unnecessary. Therefore, there are more downsides to consider
such as the lack of information due to the fat that the amount of events is not taken into account, which is a big mistake because a recurring event usually re-flects users’ interests; and finally, its limited flexibility.
The next step is to create a new function Se, where the way of scoring events is
completely different. This new approach solves the flexibility problem that was mentioned previously.
∑
e∈Eu,p
Se(e)
Firstly, the aim is to take into account how many events have happened of each type:
Se1(e) =w(τ(e))
A disadvantage of this alternative is that the score is not bounded; however, a Sigmoid function could be used in order to bound it.
Sig(x) = 1
1+e−x
wherexwill be the non-dimensioned score.
Actually,Se1 is a simplified formula that can be expressed in the same way as the first purpose
∑
τ∈{τ(e)|e∈Eu,p
w(e)·(#{e|e ∈Eu,p,τ(e) =e})
where the second factor represents the amount of events for a specific type. The problem was that the equation was too long and it was decided to work with the shortest version for convenience.
Now, if one user triggered more than one event of the same type, the score will increase depending on its weight and it is always bounded between 0 and 1 thanks to the Sigmoid function.
Secondly, the aim is to take also into account when the event was triggered. The longer since it has happened, the less relevant it will be.
Se2(e) =2·(1− 1 1+e−t·m)
wheretis the distance of time in days between the time when the event happened and the current time (now) andmis the curve slope bounded between 0 and 1.
Chapter 4. Collaborative filtering for implicit feedback for Stilavia site 28
The reason number 2 appears in the formula is that this is an inverted Sigmoid function and it lies within the interval [0, 1]. The slope m is really important because it figures out what is the expiration date of events. This means that, if the value is set to 0.07, the weight will decrease to 50% about 20 days since it happened.
Once these two scoring functions have been defined, a combination can be done to obtain a new one that considers the amount of events of each type and the time when they happened.
Se3(e) =Se1(e)·Se2(e)
The previous scoring functions are also applied to product boxes. There is no problem to apply the same process to different data, because as said in section 2.3.1, this kind of recommender system1 is domain free, which means that it does not matter what data are used since all of them can be represented and treated as numbers.
4.1.2 Matrix factorization
For simplicity, the following information only refers to products because the pro-cess applied to product boxes is exactly the same.
Supposing there are N users {u1,u2, ...uN}, M products {p1,p2, ...uM} and, after
applying a scoring function, sij that denotes the score of user ui on item pj. Let RN×M be a rating matrix where each row represents a user and each column a product. The main problem of this matrix is that is sparse because users only interact with a small quantity of products.
RN×M = 0.8 0 · · · 0 0 0.1 · · · 0.13 .. . ... . .. ... 0.75 0 · · · 0.35
Collaborative filtering helps to predict the missing scores based on the known scores. One of the key points of this kind of recommender system is that they use
Matrix Factorization to simplify the problem. This method splitsR into two ma-trices: TN×Kfor users andQK×M for products, whereKis the number of features. These features are abstract factors that represent users and products in a feature space. They are carried out by the method itself and are invisible to program-mers. The reason this method is used instead of preserving the whole matrixRis basically because it is efficient in memory and consequently, in time. Supposing now that there is the same number of users and products so the dimension ofRis
N×N. Using Big O notation, this problem has order of O(N2)time complexity; however, storingT and Qis O(N·k) transforming the quadratic order to lineal. The only drawback is that the product ofT andQis an estimation ofR, which is to say, ofU×P.
R' T×Q
Some of the most popular algorithms that can be applied to learn these two ma-trices are Alternating Least Squares (ALS) or Stochastic Gradient Descent (SGD).
4.2
Design
This section is focused on the application’s design, firstly discussing the system architecture and its preconditions, and finally, explaining why the technologies which have been used to develop the recommender system have been chosen in-stead of other possible alternatives.
4.2.1 System architecture
Before explaining the system architecture, it is important to mention some of the preconditions or assumptions that have been taken into account to make some decisions. Previously, Stilavia had defined different Java applications built through the Spring framework and its data were stored in a MariaDB database. Among those applications, there is a process that is responsible for carrying out the task of collecting and storing the events triggered every day by users in an Elasticsearch database. Events are collected every day just when they happen and are stored as JSON elements in that database. The fields of the JSON structure provides information about the event and its context, such as its name, the time when the event was triggered or, even, what is the name of the browser used by the user.
Chapter 4. Collaborative filtering for implicit feedback for Stilavia site 30
For further details, check Appendix B.
Figure 4.3: Application’s pipeline.
Figure 4.3 shows the whole process or pipeline that the application follows to provide recommendations to users since their first interaction with the Stilavia website. The process can be summarized as follows: (1) data storage, (2) data processing, (3) data analysis and, finally, (4) prediction.
As it was said above, the data storage was previously developed. This part is key because it makes the recording of events possible, which is to say, it generates data to analyse. Next, there are two applications whose responsibility is, in broad terms, to generate a prediction model from these data and then, to be able to suggest predictions to users.
In order to do this, the first application which is a batch2 process reads the col-lected events querying the database, transforms the information using map reduce operations, generates a prediction model, then compresses the model as a zip-file and, last but not least, stores it in local storage as well as in a file cloud repository. The model is uploaded in the cloud because it is always a good idea to have avail-able the previous models as a historical register to compare them with the current ones or just to reuse them in the future.
When the zip-file is uploaded in the cloud, the batch application sends a HTTP3 POST4 request to the second application enclosing the name of the zip-file, which contains the model in the body. The second application is a web API5 playing 2A batch process is a program or application that runs in background because it does not need
any user interaction.
3HyperText Transfer Protocol.
4Request method supported by the HTTP protocol that a web server accepts and stores data
enclosed in the body of the request message.
the server role that is always waiting for petitions of the batch application. Figure 4.4 shows the interaction between both applications using a time-line. There are different possible options to send the model to the second application, such as enclosing directly the file in the body or following a polling6 strategy which is time-consuming and computationally expensive. Nevertheless, a POST request enclosing the zip-file name has been chosen because of the speed and basically, because the main purpose of the HTTP methods is to handle text instead of files, as its name suggests. The model can be downloaded from the cloud as soon as the body of the request is read by the web API. After downloading the model, there are only two tasks to be done: making predictions and showing them to users.
Figure 4.4: Communication between the batch and the web API application.
These applications are divided into two different modules due to the fact that the system only needs to generate a model per day. It was decided that generating and uploading models in a short time period it is not worthwhile. Thus, having the part of generating the model isolated as a batch process allows the simplification of the application executing it once a day while the prediction web API is ready to be used all time.
4.2.2 Decisions about technology
As indicated above, after collecting and storing data there are two important appli-cations that enable to generate models and make predictions: the batch application and the web API.
The batch application is written in Python and uses the Apache Spark framework
6Strategy that consists of asking periodically if a resource is ready to be read by other
Chapter 4. Collaborative filtering for implicit feedback for Stilavia site 32
to generate the prediction models. This decision was chosen because both can be integrated easily in notebooks, which are a good tool for testing data, and also because the code can be exported simply as a Python script after the testing stage. For generating predictions models there are other alternatives, such as Hadoop. Altohugh Apache Spark is assembled on Hadoop, it is a high-level framework that disposes of a complete API including many operations, which Hadoop does not have available, and a library dedicated specially to Machine Learning called MLlib. This library has defined useful algorithms to make predictions, such as the Alternating Least Squares. File cloud repository used to store models is Amazon S37as they offer a very helpful API and for a cheap price, that is also an important factor to taken into account when making decisions.
The web API is written in Java using the Spring Framework as the rest of the appli-cations of Stilavia’s project. It is a useful framework for building web appliappli-cations in Java and it is easy to integrate as well as the batch application.
4.3
Implementation
As it was said in subsection 4.2.1, events are daily recorded in an Elasticsearch database. All this events have to be managed by the batch program, so the way in which the batch program accesses to this information is reading them from the Elasticsearch database executing a DSL8 query. This query uses a filter in order to return only the key/value pairs related to product and product box events. Those pairs are the input of the Apache Spark module, whose responsibility is to parallelize and transform those pairs next. Once the information is parallelized or, in other words, distributed throughout this module, the relevant and useful keys are extracted due to there is extra information about events which is not essential to make predictions. The required fields to recommend products are: the session which provides information about who did the event, so about the user, event name, product id and finally, the timestamp to know how old the event is. On the other hand, when the application is looking for boxes recommendations, the application makes use of the same fields except the product id that is replaced by the id of the product box.
After filtering the events by key, it is necessary to apply a MapReduce operation
7Amazon Simple Storage Service (S3) is an online file storage web service offered by Amazon
Web Service.
in order to obtain a tuple (user id, product/product box id, score, time). The oper-ations applied are basically three: map, groupBy and collect. The map operation allows to get only some specific keys, which are the keys mentioned in the pre-vious lines, from the filtered list of events and then these events are grouped by user and product id. Next another map operation is required in order to work out the scores for every product as they do not exist in the system and, finally, this information is materialized using the collect operation. The first three elements of this tuple are used to build the U×P matrix, whereas the time field is used in the Sigmoid function used to dimension the scores obtained by the selected scoring function. As it was mentioned at the end of subsection 4.1.2, there exists two methods that fills in this sparse matrix: ALS and SGD. In this case, the ALS algorithm was chosen as the algorithm is available in the Apache Spark MLlib library along with other interesting functions. The ALS algorithm is an iterative algorithm that helps to complete matrices using a ridge regression9.
This procedure is also applied to boxes so the application generates two models: one product oriented and the other box oriented. Just after their creation, these two models and a user hash table are zipped and saved in the local storage system as well as uploaded in Amazon S3 cloud storage. The user hash table is required because the ALS algorithm needs users to be represented as numbers but in the Elasticsearch database are stored as hash codes which are composed by numbers and strings. Hence, relating each hash code to one integer using a mapping table has been done in order to solve this drawback.
While the bash application is running, the server side, which is the web API ap-plication, is waiting for petitions in background. The server downloads the last uploaded zip in Amazon S3, unzips it and, finally, charges the two models in its own Spark context. Having the models loaded in the server side allows to make predictions defining two main functions: one that predicts products and the other boxes. These functions are internally defined by Spark and are used in the Stilavia’s web site with the purpose of displaying first in their site the products or boxes that users are likely to prefer.
Finally, the performance of the recommender system is evaluated measuring the average error using the MSE10validator. To apply this measure a cross-validation method called K-folds is used. First of all, this method divides the resulting
9Ridge regression is a method that seeks to reduce the MSE by adding some bias and, at the
same time, reducing the variance.
10Mean Squared Error is a statistic term usually used to evaluate recommender systems in order
Chapter 4. Collaborative filtering for implicit feedback for Stilavia site 34
dataset into k equal sets. Then, one of the k slices is used for testing and the
(k−1) remaining are used for training. In other words, there is always a slice hidden for the training set because its responsibility is to learn those unknown values. When the training set has learned those values it is time to compare them with the original values stored in the test set using the MSE formula:
MSE= 1 |R|· N
∑
i=1 M∑
j=1 (s¯ij−sij)2 (4.1)whereRis the cardinality of the set of the known scores,Nis the number of users,
Mis the number of items (products or product boxes), ¯sis the predicted score and
s the real score.
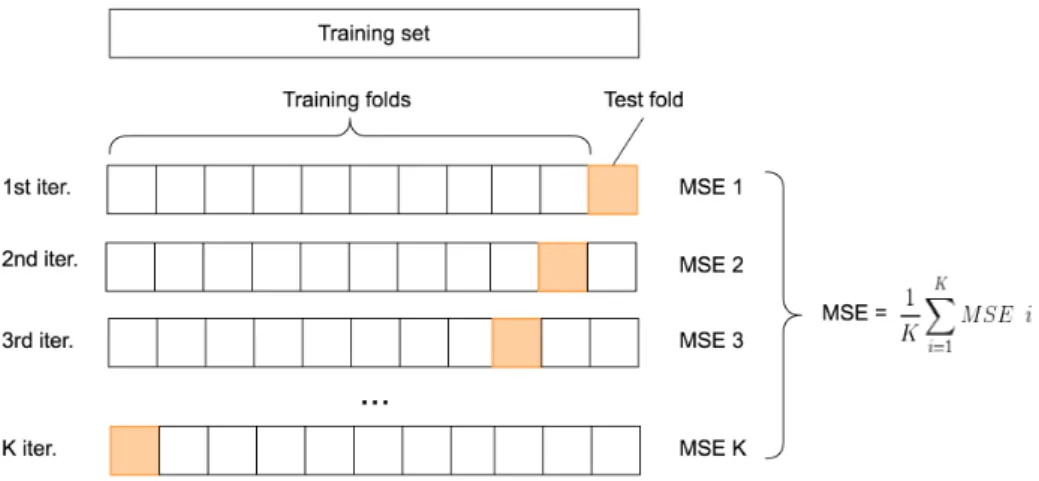
This process is going to be applied to every slice producing a list of MSE errors. Next, the average of this error list is done adding all values and dividing it by the total number of slices, that is,k. This methodology is know as K-folds because the process is repeatedk times. Figure 4.5 shows the k-folds cross validation process. This method is applied so many times because there is not enough information to assume the result is correct applying it only once. Repeating the process ensures the result is right and it was not obtained by chance.
Figure 4.5: K-folds Cross Validation method employed to evaluate how good is the resulting model.
Results
The purpose of this last chapter is showing the results of the implementation that has been carried out during this semester. The results are divided into two sections: (1) evaluation of the Product Recommender System (PRS) and (2) evalu-ation of the Product Box Recommender System (PBRS). In order to evaluate PRS and PBRS in different contexts, two different set of weights have been employed. The set of weights used are shown in the following table:
Set parameters Type of events Event name Weights
Set 1 Product BUY_PRODUCT 0.7 FACEBOOK_SHARE 0.3 TWITTER_SHARE 0.3 PINTEREST_SHARE 0.3 SAVE_PRODUCT 0.5 POV_PAGE_VIEW 0.1 MINIVIEW 0.1 Product box PRODUCT_BOX_VIEW 0.3 PRODUCT_BOX_HIT 0.8 PRODUCT_BOX_IMPRESSION 0.1
Table 5.1: Set of parameters used in the evaluation stage. 35
Chapter 5. Results 36
Table 5.1 – continued from previous page
Set parameters Type of events Event name Weights
Set 2 Product BUY_PRODUCT 0.1 FACEBOOK_SHARE 0.7 TWITTER_SHARE 0.7 PINTEREST_SHARE 0.7 SAVE_PRODUCT 0.1 POV_PAGE_VIEW 0.5 MINIVIEW 0.5 Product box PRODUCT_BOX_VIEW 0.7 PRODUCT_BOX_HIT 0.1 PRODUCT_BOX_IMPRESSION 0.4
These weights were decided by the staff of Stilavia and each set has a completely different purpose. The first set is focused on buying products whereas the second one is focused on engaging users.
The following table shows the generic names that have been given to the different family of scoring functions for easier reading:
∑
e∈Eu,p
Se(e)
Scoring function Equation
S1 Se1(e) =w(τ(e))
S2 Se2(e) =2·(1− 1+e1−t·m)
S3 Se3(e) =Se1(e)·Se2(e)
Table 5.2: Scoring functions employed in the evaluation stage.
As it was said in section 4.1 the scoring function S1 takes into account only the types of events, the scoring functionS2 takes into account only the time when the events have been triggered and, finally, the scoring functionS3 is a combination of the two previous functions. The value ofkused in these equations has been 0.07.
To sum it up, there are two systems, PRS and PBRS, each system employs two different set of parameters, Set 1 and Set 2, and each Set uses three scoring func-tions, S1, S2 and S3. So at the end, the result consists of twelve tables, six for PRS and another six for PBRS. In order to achieve a better understanding each table goes along with a line chart and a brief discussion. In this chapter only the re-sults obtained using the scoring function S3 are shown as it is the most complete and useful scoring function. For further details about the results of the scoring functions S1 and S2 go to Appendix C.
In addition, to evaluate both systems, 5.000 events have been collected. These events were triggered from the 1st of December until the 14th of January.
Once the parameters have been set, the accuracy of the ALS algorithm is tested. The rank value denotes the number of features that the Matrix Factorization method is using when building the users’ matrix T and the products’ matrix Q. The larger the value rank is, the more complex the resulting model will be. For this reason, a K-folds Cross Validation method is used where the k value is 10, so the method will split data in 10 folds. The number of iterations that the ALS algorithm has employed to obtain the models is 10. It has been executed using 16 different rank values using the testing set in order to see the trend in MSE, standard deviation (SD) and execution time. In addition, in order to evaluate the training set the algorithm has been executed again. This time, it has been em-ployed only 1 fold and the whole dataset as testing set. As the testing and training set are using the entire dataset there has not been any change in SD and execution time, therefore it has not been necessary to record them.
It is said that a phenomenon known as Overfitting takes places when the testing MSE exceeds excessively the training MSE. It means that the ALS algorithm pro-duces useless models