University of Wollongong
University of Wollongong
Research Online
Research Online
Faculty of Engineering and Information
Sciences - Papers: Part A
Faculty of Engineering and Information
Sciences
1-1-2008
AdaBoost with SVM-based component classifiers
AdaBoost with SVM-based component classifiers
Xuchun lI
Nanyang Technological University, Singapore
Lei Wang
Nanyang Technological University, Singapore, [email protected]
Eric Sung
Nanyang Technological University, Singapore
Follow this and additional works at: https://ro.uow.edu.au/eispapers
Part of the Engineering Commons, and the Science and Technology Studies Commons
Recommended Citation
Recommended Citation
lI, Xuchun; Wang, Lei; and Sung, Eric, "AdaBoost with SVM-based component classifiers" (2008). Faculty of Engineering and Information Sciences - Papers: Part A. 602.
https://ro.uow.edu.au/eispapers/602
Research Online is the open access institutional repository for the University of Wollongong. For further information contact the UOW Library: [email protected]
Abstract
Abstract
The use of SVM (Support Vector Machine) as component classifier in AdaBoost may seem like going against the grain of the Boosting principle since SVM is not an easy classifier to train. Moreover, Wickramaratna et al. [2001. Performance degradation in boosting. In: Proceedings of the Second International Workshop on Multiple Classifier Systems, pp. 11-21] show that AdaBoost with strong component classifiers is not viable. In this paper, we shall show that AdaBoost incorporating properly designed RBFSVM (SVM with the RBF kernel) component classifiers, which we call AdaBoostSVM, can perform as well as SVM. Furthermore, the proposed AdaBoostSVM demonstrates better generalization performance than SVM on imbalanced classification problems. The key idea of AdaBoostSVM is that for the sequence of trained RBFSVM component classifiers, starting with large s values (implying weak learning), the s values are reduced progressively as the Boosting iteration proceeds. This effectively produces a set of RBFSVM component classifiers whose model parameters are adaptively different manifesting in better generalization as compared to AdaBoost approach with SVM component classifiers using a fixed (optimal) s value. From benchmark data sets, we show that our AdaBoostSVM approach outperforms other AdaBoost approaches using component classifiers such as Decision Trees and Neural Networks. AdaBoostSVM can be seen as a proof of concept of the idea proposed in Valentini and
Dietterich [2004. Bias-variance analysis of support vector machines for the development of SVM-based ensemble methods. Journal of Machine Learning Research 5, 725-775] that Adaboost with
heterogeneous SVMs could work well. Moreover, we extend AdaBoostSVM to the Diverse AdaBoostSVM to address the reported accuracy/diversity dilemma of the original Adaboost. By designing parameter adjusting strategies, the distributions of accuracy and diversity over RBFSVM component classifiers are tuned to maintain a good balance between them and promising results have been obtained on benchmark data sets.
Keywords
Keywords
classifiers, adaboost, svm, component
Disciplines
Disciplines
Engineering | Science and Technology Studies
Publication Details
Publication Details
lI, X., Wang, L. & Sung, E. (2008). AdaBoost with SVM-based component classifiers. Engineering Applications of Artificial Intelligence, 21 (5), 785-795.
Engineering Applications of Artificial Intelligence 21 (2008) 785–795
AdaBoost with SVM-based component classifiers
Xuchun Li
, Lei Wang, Eric Sung
School of Electrical and Electronic Engineering, Nanyang Technological University, Singapore
Received 28 May 2006; received in revised form 22 May 2007; accepted 13 July 2007 Available online 14 September 2007
Abstract
The use of SVM (Support Vector Machine) as component classifier in AdaBoost may seem like going against the grain of the Boosting principle since SVM is not an easy classifier to train. Moreover, Wickramaratna et al. [2001. Performance degradation in boosting. In: Proceedings of the Second International Workshop on Multiple Classifier Systems, pp. 11–21] show that AdaBoost with strong component classifiers is not viable. In this paper, we shall show that AdaBoost incorporating properly designed RBFSVM (SVM with the RBF kernel) component classifiers, which we callAdaBoostSVM, can perform as well as SVM.
Furthermore, the proposedAdaBoostSVMdemonstrates better generalization performance than SVM on imbalanced classification problems. The key idea ofAdaBoostSVMis that for the sequence of trained RBFSVM component classifiers, starting with largesvalues (implying weak learning), thesvalues are reduced progressively as the Boosting iteration proceeds. This effectively produces a set of RBFSVM component classifiers whose model parameters are adaptively different manifesting in better generalization as compared to AdaBoost approach with SVM component classifiers using a fixed (optimal)s value. From benchmark data sets, we show that our
AdaBoostSVM approach outperforms other AdaBoost approaches using component classifiers such as Decision Trees and Neural Networks.AdaBoostSVMcan be seen as a proof of concept of the idea proposed in Valentini and Dietterich [2004. Bias-variance analysis of support vector machines for the development of SVM-based ensemble methods. Journal of Machine Learning Research 5, 725–775] that Adaboost with heterogeneous SVMs could work well. Moreover, we extendAdaBoostSVMto theDiverse AdaBoostSVMto address the reported accuracy/diversity dilemma of the original Adaboost. By designing parameter adjusting strategies, the distributions of
accuracyanddiversityover RBFSVM component classifiers are tuned to maintain a good balance between them and promising results have been obtained on benchmark data sets.
r2007 Published by Elsevier Ltd.
Keywords:AdaBoost; Support Vector Machine; Component classifier; Diversity
1. Introduction
One of the major developments in machine learning in the past decade is the Ensemble method, which finds a highly accurate classifier by combining many moderately accurate component classifiers. Two of the commonly used techniques for constructing Ensemble classifiers are Boost-ing (Schapire, 2002) and Bagging (Breiman, 1996). Compared with Bagging, Boosting performs better when the data do not have much noise (Opitz and Maclin, 1999;
Bauer and Kohavi, 1999). As the most popular Boosting
method, AdaBoost (Freund and Schapire, 1997) creates a
collection of component classifiers by maintaining a set of weights over training samples and adaptively adjusting these weights after each Boosting iteration: the weights of the training samples which are misclassified by current component classifier will be increased while the weights of the training samples which are correctly classified will be decreased. Several ways have been proposed to implement the weight update in Adaboost (Kuncheva and Whitaker,
2002).
The success of AdaBoost can be attributed to its ability to enlarge the margin (Schapire et al., 1998), which could enhance the generalization capability of AdaBoost. Many studies that use Decision Trees (Dietterich, 2000) or Neural Networks (Schwenk and Bengio, 2000; Ratsch, 2001) as component classifiers in AdaBoost have been reported. These studies show good generalization performance of
www.elsevier.com/locate/engappai
0952-1976/$ - see front matterr2007 Published by Elsevier Ltd. doi:10.1016/j.engappai.2007.07.001
Corresponding author. Tel.: +65 9092 7335.
E-mail addresses: [email protected], [email protected]. edu.sg (X. Li).
these AdaBoost. Still, some difficulties remain. When Decision Trees are used as component classifiers, what should be the suitable tree size? When Radial Basis Function (RBF) Neural Networks are used as component classifiers, how could the complexity be controlled to avoid overfitting? Moreover, we have to decide on the optimum number of centers and the width of the RBFs? All of these have to be carefully tuned for AdaBoost to achieve better performance. Furthermore, diversity is known to be an important factor which affects the generalization perfor-mance of Ensemble classifiers (Melville and Mooney, 2005;
Kuncheva and Whitaker, 2003). Some methods are
proposed to quantify the diversity (Kuncheva and
Whi-taker, 2003; Windeatt, 2005). It is also known that there is
an accuracy/diversity dilemma in AdaBoost (Dietterich, 2000), which means that the more accurate the two component classifiers become, the less they can disagree with each other. Only when the accuracy and diversity are well balanced, can the AdaBoost demonstrate excellent generalization performance. However, the existing Ada-Boost algorithms do not explicitly take sufficient measures to deal with this problem.
Support Vector Machine (SVM) (Vapnik, 1998) is developed from the theory of Structural Risk Minimiza-tion. By using a kernel trick to map the training samples from an input space to a high-dimensional feature space, SVM finds an optimal separating hyperplane in the feature space and uses a regularization parameter,C, to control its model complexity and training error. One of the popular kernels used in SVM is the RBF kernel, which has a parameter known as Gaussian width,s. In contrast to the RBF networks, SVM with the RBF kernel (RBFSVM in short) can automatically determine the number and location of the centers and the weight values (Scholkopf
et al., 1997). Also, it can effectively avoid overfitting by
selecting proper values ofCands. From the performance analysis of RBFSVM (Valentini and Dietterich, 2004), we know thatsis a more important parameter compared toC: although RBFSVM cannot learn well when a very low value ofCis used, its performance largely depends on thes value if a roughly suitableCis given. This means that, over a range of suitableC, the performance of RBFSVM can be changed by simply adjusting the value ofs.
Therefore, in this paper, we try to answer the following questions: Can the SVM be used as an effective component classifier in AdaBoost? If yes, what will be the general-ization performance of this AdaBoost? Will this AdaBoost show some advantages over the existing ones, especially on the aforementioned problems? Furthermore, compared with the individual SVM, what is the benefit of using an AdaBoost as a combination of multiple SVMs? In this paper, RBFSVM is adopted as component classifier for AdaBoost. As mentioned above, there is a parametersin RBFSVM which has to be set beforehand. An intuitive way is to simply apply a single s to all RBFSVM component classifiers. However, we observed that this way cannot lead to successful AdaBoost due to the weak or
over-strong RBFSVM component classifiers encountered in Boosting process. Although there may exist a single bests, we find that AdaBoost with this single bestsobtained by cross-validation cannot lead to the best generalization performance and also doing cross-validation for it will increase the computational load. Therefore, using a single sin all RBFSVM component classifiers should be avoided if possible.
The following fact opens the door for us to avoid searching the single bestsand help AdaBoost achieve even better generalization performance. It is known that the classification performance of RBFSVM can be conveni-ently changed by adjusting the kernel parameter, s. Enlightened by this, the proposedAdaBoostSVMapproach adaptively adjusts the s values in RBFSVM component classifiers to obtain a set of moderately accurate RBFSVMs for AdaBoost. As will be shown later, this gives rise to a better SVM-based AdaBoost. Compared with the existing AdaBoost approaches with Neural Networks or Decision Tree component classifiers, our proposedAdaBoostSVMcan achieve better generalization performance and it can be seen as a proof of concept of the idea suggested by Valentini and Dietterich (2004) that Adaboost with heterogeneous SVMs could work well. Furthermore, compared with individual SVM,
Ada-BoostSVMcan achieve much better generalization
perfor-mance on imbalanced data sets. We argue that in
AdaBoostSVM, the Boosting mechanism forces some
RBFSVM component classifiers to focus on the misclassi-fied samples from the minority class, and this can prevent the minority class from being considered as noise in the dominant class and be wrongly classified. This also justifies, from another perspective, the significance of exploring AdaBoost with SVM component classifiers.
Furthermore, since AdaBoostSVM provides a conveni-ent way to control the classification accuracy of each RBFSVM component classifier by simply adjusting the s value, it also provides an opportunity to deal with the well-known accuracy/diveristy dilemma in Boosting methods. This is a happy ‘‘discovery’’ found during the investigation of AdaBoost with RBFSVM-based component classifiers. Through some parameter adjusting strategies, we can tune the distributions of accuracy and diversity over these component classifiers to achieve a good balance. We also propose an improved version of AdaBoostSVM called
Diverse AdaBoostSVM in this paper. It is observed that,
benefiting from the balance between accuracy and diver-sity, it can give better generalization performance than
AdaBoostSVM.
2. Background 2.1. AdaBoost
Given a set of training samples, AdaBoost (Schapire and
Singer, 1999) maintains a weight distribution, W, over
Then, AdaBoost calls ComponentLearn algorithm repeat-edly in a series of cycles (Table 1). At cycle t, AdaBoost provides training samples with a distribution Wt to ComponentLearn. In response, the ComponentLearn trains a classifier ht. The distribution Wt is updated after each cycle according to the prediction results on the training samples. ‘‘Easy’’ samples that are correctly classified ht get lower weights, and ‘‘hard’’ samples that are misclassified get higher weights. Thus, AdaBoost focuses on the samples with higher weights, which seem to be harder for ComponentLearn. This process continues for T cycles, and finally, AdaBoost linearly combines all the component classifiers into a single final hypothesis f. Greater weights are given to component classifiers with lower training errors. The important theoretical property of AdaBoost is that if the component classifiers consis-tently have accuracy only slightly better than half, then the training error of the final hypothesis drops to zero exponentially fast. This means that the component classifiers need to be only slightly better than random.
2.2. Support Vector Machine
SVM was developed from the theory of Structural Risk Minimization. In a binary classification problem, the decision function of SVM is
fðxÞ ¼ hw;fðxÞi þb, (1)
wherefðxÞis a mapping of samplexfrom the input space to a high-dimensional feature space.h;i denotes the dot product in the feature space. The optimal values ofwandb
can be obtained by solving the following optimization problem: minimize: gðw;xÞ ¼1 2kwk 2þCX N i¼1 xi ð2Þ subject to: yiðhw;fðxiÞi þbÞX1xi; xiX0, ð3Þ
wherexiis theith slack variable andCis the regularization parameter. According to the Wolfe dual form, the above minimization problem can be written as
minimize: WðaÞ ¼ X N i¼1 ai þ1 2 XN i¼1 XN j¼1 yiyjaiajkðxi;xjÞ ð4Þ subject to: X N i¼1 yiai¼0; 8i:0paipC, ð5Þ
whereaiis a Lagrange multiplier which corresponds to the sample xi, kð;Þ is a kernel function that implicitly maps the input vectors into a suitable feature space
kðxi;xjÞ ¼ hfðxiÞ;fðxjÞi. (6)
Compared with RBF networks (Scholkopf et al., 1997), SVM automatically calculates the number and location of centers, weights, and thresholds in the following way: by the use of a suitable kernel function (in this paper, the RBF kernel, kðxi;xjÞ ¼expðkxixjk2=2s2Þ, is used), the sam-ples are mapped nonlinearly into a high-dimensional feature space. In this space, an optimal separating hyper-plane is constructed by the support vectors. Support vectors correspond to the centers of RBF kernels in the input space. The generalization performance of SVM is mainly affected by the kernel parameters, for example, s, and the regularization parameter, C. They have to be set beforehand.
3. Proposed algorithm: AdaBoostSVM
This work aims to employ RBFSVM as component classifier in AdaBoost. But how should we set the svalue for these RBFSVM component classifiers during the AdaBoost iterations? Problems are encountered when applying a singlesto all RBFSVM component classifiers. In detail, having too large a value ofsoften results in too weak a RBFSVM component classifier. Its classification accuracy is often less than 50% and cannot meet the requirement on a component classifier given in AdaBoost. On the other hand, a smallersoften makes the RBFSVM component classifier stronger and boosting them may become inefficient because the errors of these component classifiers are highly correlated. Furthermore, too small a value of s can even make RBFSVM overfit the training samples. Hence, finding a suitable s for these SVM component classifiers in AdaBoost becomes a problem. By using model selection techniques such ask-fold or leave-one-out cross-validation, a single best smay be found for these component classifiers. However, the process of model selection is time consuming and should be avoided if possible. Hence, it seems that SVM component classifiers do not perform optimally if only one single value of s is used.
Table 1
Algorithm:AdaBoost (Schapire and Singer, 1999)
1. Input:a set of training samples with labelsfðx1;y1Þ;. . .;ðxN;yNÞg, a
ComponentLearn algorithm, the number of cyclesT. 2. Initialize:the weights of training samples:w1
i ¼1=N, for all
i¼1;. . .;N. 3. Do fort¼1;. . .;T
(1) Use the ComponentLearn algorithm to train a component classifier,
ht, on the weighted training samples.
(2) Calculate the training error ofht:t¼PNi¼1wti;yiahtðxiÞ.
(3) Set weight for the component classifierht:at¼12lnð 1t
t Þ.
(4) Update the weights of training samples:wtþ1 i ¼
wtiexpfatyihtðxiÞg Ct ,
i¼1;. . .;N
whereCtis a normalization constant, andPNi¼1wtiþ1¼1. 4. Output:fðxÞ ¼signðPTt¼1athtðxÞÞ.
3.1. Influence of parameters on SVM performance
The classification performance of SVM is affected by its model parameters. For RBFSVM, the model parameters include the Gaussian width, s, and the regularization parameter,C. The variation of either of them leads to the change of classification performance. However, as reported
in Valentini and Dietterich (2004), although RBFSVM
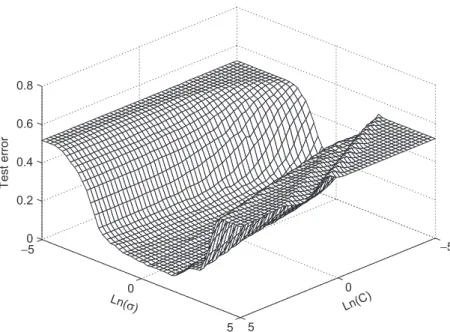
cannot learn well when a very low value ofC is used, its performance largely depends on the s value if a roughly suitable Cis given. An example is shown inFig. 1, which plots the test error of SVM against the values ofCandson a non-separable data set used in Baudat and Anouar
(2000). Clearly, changingsleads to larger variation on test
error than changingC. This means that, over a large range of C, the performance of RBFSVM can be adjusted by simply changing the value of s. It is known that, in a certain range, a larger s often leads to a reduction in classifier complexity but at the same lowers the classifica-tion performance. Also, a smaller s often increases the learning complexity and leads to higher classification performance in general. Therefore, this gives a chance to get around the problem resulted from using a fixedsfor all RBFSVM component classifiers. In the following, a set of moderately accurate RBFSVM component classifiers is obtained by adaptively adjusting theirs values.
3.2. Proposed algorithm: AdaBoostSVM
When applying Boosting method to strong component classifiers, these component classifiers must be appropri-ately weakened in order to benefit from Boosting
(Dietterich, 2000). Hence, if RBFSVM is used as
compo-nent classifier in AdaBoost, a relatively largesvalue, which corresponds to a RBFSVM with relatively weak learning
ability, is preferred. In the proposed AdaBoostSVM, without loss of generality, the re-weighting technique is used to update the weights of training samples.
Ada-BoostSVMcan be described as follows (Table2): Initially,
a large value is set to s, corresponding to a RBFSVM classifier with very weak learning ability. Then, RBFSVM with thissis trained as many cycles as possible as long as more than half accuracy can be obtained. Otherwise, thiss value is decreased slightly to increase the learning capability of RBFSVM to help it achieve more than half accuracy. By decreasing thes value slightly, this prevents the new RBFSVM from being too strong for the current weighted training samples, and thus moderately accurate RBFSVM component classifiers are obtained. The reason why moderately accurate RBFSVM component classifiers are favored lies in the fact that these classifiers often have larger diversity than those component classifiers which are very accurate. These larger diversities may lead to a better generalization performance of AdaBoost. This process
−5 0 5 −5 0 5 0 0.2 0.4 0.6 0.8 Ln(C) Ln(σ ) Test error
Fig. 1. The test error of SVM vs.sandCvalues. Table 2
Algorithm:AdaBoostSVM
1. Input:a set of training samples with labelsfðx1;y1Þ;. . .;ðxN;yNÞg; the
initials,sini; the minimals,smin; the step ofs,sstep.
2. Initialize:the weights of training samples:w1
i ¼1=N, for all
i¼1;. . .;N. 3. Do Whileðs4sminÞ
(1) Train a RBFSVM component classifier,ht, on the weighted training
set.
(2) Calculate the training error ofht:t¼PNi¼1wti;yiahtðxiÞ.
(3) Ift40:5, decreasesvalue bysstepand goto (1).
(4) Set the weight of component classifierht:at¼12lnð 1t
t Þ.
(5) Update the weights of training samples:wtþ1 i ¼
wt
iexpfatyihtðxiÞg Ct
whereCtis a normalization constant, andPNi¼1wtiþ1¼1. 4. Output:fðxÞ ¼signðPTt¼1athtðxÞÞ.
continues until the s is decreased to the given minimal value.
4. Improvement: diverse AdaBoostSVM 4.1. Accuracy/diversity dilemma of AdaBoost
Diversity is known to be an important factor affecting
the generalization performance of Ensemble methods
(Melville and Mooney, 2005; Kuncheva and Whitaker,
2003), which means that the errors made by different component classifiers should be uncorrelated. If each component classifier is moderately accurate and these component classifiers largely disagree with each other, the uncorrelated errors of these component classifiers will be removed by the voting process so as to achieve good ensemble generalization performance (Shin and Sohn, 2005). This also applies to AdaBoost. As mentioned before, there exists a dilemma in AdaBoost between the classification accuracy of component classifiers and the diversity among them (Dietterich, 2000), which means that the more accurate the two component classifiers become, the less they can disagree with each other. The Accur-acy–Diversity diagram in Fig. 2 is used to explain this dilemma. Following Margineantu and Dietterich (1997)
and Domeniconi and Yan (2004), the Kappa statistic is
used to measure the diversity.
This diagram is a scatter-plot where each point corresponds to a component classifier. The x coordinate value of a point is the diversity value of the corresponding component classifier while the y coordinate value is the accuracy value of the corresponding component classifier. From this figure, it can be observed that, if the component classifiers are too accurate, it is difficult to find very diverse ones, and combining these accurate but non-diverse classifiers often leads to very limited improvement (
Wind-eatt, 2005). On the other hand, if the component classifiers
are too inaccurate, although we can find diverse ones, the combination result may be worse than that of combining both more accurate and diverse component classifiers. This is because if the combination result is dominated by too many inaccurate component classifiers, it will be wrong most of the time, leading to poor classification result. Hence, how could we maximize the diversity under the condition of obtaining a fairly good component classifier accuracy in AdaBoost?
In AdaBoostSVM, the obtained RBFSVM component
classifiers are mostly moderately accurate, which gives chances to select more diverse component classifiers. As aforementioned, through adjustment of thesvalue, a set of RBFSVM component classifiers with different learning abilities is obtained. This provides an opportunity of selecting more diverse component classifiers from this set to deal with the accuracy/diversity dilemma. Hence, we proposed a Diverse AdaBoostSVM approach (Table 3), and it is hoped to further improve the generalization performance ofAdaBoostSVM.
4.2. Improvement of AdaBoostSVM: diverse AdaBoostSVM
Although the matter of how diversity is measured and used in Ensemble methods is still an open problem
(Kuncheva and Whitaker, 2003), some promising results
(Melville and Mooney, 2005; Dasgupta and Long, 2003)
have been reported recently. By increasing the diversity of component classifiers, these methods can achieve higher generalization accuracy. In the proposed Diverse
Ada-BoostSVM approach, we use the definition of diversity in
Melville and Mooney (2005), which measures the
disagree-ment between one component classifier and all the existing component classifiers. In the Diverse AdaBoostSVM, the diversity is calculated as follows: IfhtðxiÞis the prediction label of thetth component classifier on the samplexi, and
Accuracy
Diversity
Fig. 2. Accuracy and diversity dilemma of AdaBoost.
Table 3
Algorithm:Diverse AdaBoostSVM
1. Input:a set of training samples with labelsfðx1;y1Þ;. . .;ðxN;yNÞg; the
initials,sini; the minimals,smin; the step ofs,sstep; the threshold on diversityDIV.
2. Initialize:the weights of training samples:w1
i ¼1=N, for all
i¼1;. . .;N. 3. Do Whileðs4sminÞ
(1) Train a RBFSVM component classifier,ht, on the weighted training
set.
(2) Calculate the training error ofht:t¼PNi¼1wti;yiahtðxiÞ:
(3) Calculate the diversity ofht:Dt¼PNi¼1dtðxiÞ.
(4) Ift40:5 orDtoDIV, decreasesbysstepand goto (1).
(5) Set the weight of component classifierht:at¼12lnð 1t
t Þ.
(6) Update the weights of training samples:wtþ1 i ¼
wt
iexpfatyihtðxiÞg Ct
whereCtis a normalization constant, andPNi¼1wtiþ1¼1. 4. Output:fðxÞ ¼signðPTt¼1athtðxÞÞ.
fðxiÞ is the combined prediction label of all the existing component classifiers, the diversity of the tth component classifier on the samplexi is calculated as:
dtðxiÞ ¼
0 if htðxiÞ ¼fðxiÞ 1 if htðxiÞafðxiÞ
(
(7) and the diversity of AdaBoostSVM with T component classifiers onNsamples is calculated as
D¼ 1 TN XT t¼1 XN i¼1 dtðxiÞ. (8)
At each cycle of Diverse AdaBoostSVM, the diversity value, D, is calculated first. If D is larger than the predefined threshold,DIV, this new RBFSVM component classifier will be selected. Otherwise, this component classifier will be discarded. Through this mechanism, a set of moderately accurate and diverse RBFSVM compo-nent classifiers can be generated. This is different from the aboveAdaBoostSVM which simply takes all the available RBFSVM component classifiers. As seen from the follow-ing experimental results, the Diverse AdaBoostSVMgives better generalization performance. We think that the improvement is due to its explicit dealing with the accuracy/diversity dilemma.
5. Experimental results
In this section, our proposedAdaBoostSVMandDiverse
AdaBoostSVM are compared with the commonly used
AdaBoost, which takes Neural Networks or Decision Tree as component classifiers. Then, they are compared with several state-of-the-art imbalanced classification algo-rithms to show the significance of exploring SVM-based AdaBoost algorithms applied to some imbalanced data sets.
5.1. Comparison on benchmark data sets
5.1.1. Data set information and parameter setting
Thirteen benchmark data sets from UCI Repository, DELVE, and STATLOG are used to evaluate the general-ization performance of two proposed algorithms. The dimensions of these data sets range from 2 to 60, the numbers of training samples range from 140 to 1300, and the numbers of test samples range from 75 to 7000. Detailed information about these data sets can be found in
hhttp://mlg.anu.edu.au/raetsch/datai. Each data set is partitioned into training and test subsets, usually in the ratio of 60–40%. 100 such partitions are generated randomly for the experiments. On each partition, the compared algorithms are trained and tested, respectively. The final performance of each algorithm on a data set is the average of the results over the 100 partitions.
As the generalization performance of RBFSVM is mainly affected by the parameter, s, the regularization parameter,C, is empirically set as a value within 10–100 for all experiments. The smin is set as the average minimal distance between any two training samples and thesini is set as the scatter radius of the training samples in the input space. Although the value of sstep affects the number of
AdaBoostSVM learning cycles, it has less impact on the
final generalization performance, as shown later. There-fore,sstepis set to a value within 1–3. The threshold ‘‘DIV’’ in the Diverse AdaBoostSVM is set as ZDt
max, where Z2
ð0;1 and Dt
max denotes the maximal diversity value obtained in past t cycles. In this experiment, Z¼0:7 is used to handle the possible small variation on diversity.
5.1.2. Evaluation of the generalization performance
Firstly, we give the generalization errors with standard deviation of the six algorithms on the benchmark data sets in
Table 4: AdaBoost with Decision Tree component classifier
(ABDT), AdaBoost with Neural Networks component
Table 4
Generalization errors with standard deviation of algorithms: AdaBoost with Decision Tree component classifiers,ðABDTÞ, AdaBoost with Neural
Networks component classifiers ðABNNÞ, AdaBoost with SVM component classifiers using single best parameters for SVM ðABSVMsÞ, proposed
AdaBoostSVMðABSVMÞ, proposed Diverse AdaBoostSVMðDABSVMÞand SVM
Data set ABDT ABNN ABSVMs ABSVM DABSVM SVM
Banana 13:20:7 12:30:7 14:20:6 12:11:7 11:31:4 11:50:7 B. cancer 32:34:7 30:44:7 30:44:4 25:55:0 24:84:4 26:04:7 Diabetes 27:82:3 26:52:3 24:82:0 24:82:3 24:32:1 23:51:7 German 29:32:4 27:52:5 25:81:9 23:42:1 22:32:1 23:62:1 Heart 21:53:3 20:33:4 19:23:5 15:53:4 14:93:0 16:03:3 Image 3:70:8 2:70:7 6:20:7 2:70:7 2:40:5 3:00:6 Ringnorm 2:50:3 1:90:3 5:10:2 2:11:1 2:00:7 1:70:1 F. solar 37:91:5 35:71:8 36:81:5 33:81:5 33:71:4 32:41:8 Splice 12:00:3 10:10:5 14:30:5 11:11:2 11:01:0 10:90:7 Thyroid 5:62:0 4:42:2 8:52:1 4:42:1 3:72:1 4:82:2 Titanic 23:80:7 22:61:2 25:61:2 22:11:9 21:81:5 22:41:0 Twonorm 3:50:2 3:00:3 5:70:3 2:60:6 2:50:5 3:00:2 Waveform 12:10:6 10:80:6 12:70:4 10:31:7 10:21:2 9:90:4 Average 17:41:5 16:01:6 17:71:5 14:61:9 14:21:7 14:51:5
classifier (ABNN), AdaBoost with SVM component classifier using cross-validated single best parameters for SVM (ABSVMs), proposed AdaBoostSVM (ABSVM), proposed
Diverse AdaBoostSVM(DABSVM) and standard SVM.
Next, the McNemar’s statistical test (Eveitt, 1977) is done to confirm whether proposed algorithms outperform others on these data sets. For a data set, the McNemar’s statistical test of algorithm a and algorithmb is based on the following values of these two algorithms:
N00: number of test data misclassified by both algorithmaand algorithmb
N01: number of test data misclassified by algorithma
but not by algorithmb N10: number of test data
misclassified by algorithmb
but not by algorithma
N11: number of test data misclassified by neither algorithmanor algorithmb
then the following statistic is calculated:
ðjN01N10j 1Þ2
N01þN10
. (9)
If algorithm a and algorithm b perform significantly different, the McNemar’s statistic is greater than w2
1;0:95¼ 3:841459 (Dietterich, 1998). Tables 5 and 6 show the McNemar’s statistical test results of AdaBoostSVM and
Diverse AdaBoostSVM on the 13 benchmark data sets
(‘‘YES’’ or ‘‘NO’’ in the parentheses indicates whether these two algorithms perform significantly different on this data set).
In Table 5, the McNemar’s statistical test results
illustrate that the performance of AdaBoostSVM signifi-cantly differs from that of AdaBoostDTon 10 data sets out of total 13 data sets. This is because on these 10 data sets, Table 5
McNemar’s statistical test results between AdaBoostSVM and the compared algorithms
Data set McNemar’s statistic ðABSVMsABSVMÞ McNemar’s statistic ðABDTABSVMÞ McNemar’s statistic ðABNNABSVMÞ McNemar’s statistic ðSVMABSVMÞ
Banana 5.01843 (YES) 4.73252 (YES) 4.12417 (YES) 2.87183 (NO)
B. cancer 4.76182 (YES) 5.12491 (YES) 4.76512 (YES) 2.91432 (NO)
Diabetes 2.96412 (NO) 4.87432 (YES) 4.51249 (YES) 3.29810 (NO)
German 3.98824 (YES) 5.30991 (YES) 5.10248 (YES) 2.76391 (NO)
Heart 4.27339 (YES) 5.33074 (YES) 5.12457 (YES) 2.98714 (NO)
Image 5.39172 (YES) 4.10342 (YES) 3.15421 (NO) 3.29011 (NO)
Ringnorm 4.93901 (YES) 3.51085 (NO) 3.25994 (NO) 2.87446 (NO)
F. solar 4.87122 (YES) 5.09321 (YES) 4.21548 (YES) 3.54129 (NO)
Splice 3.98532 (YES) 3.79011 (NO) 3.56154 (NO) 2.14102 (NO)
Thyroid 5.09974 (YES) 4.32133 (YES) 4.21457 (YES) 3.41928 (NO)
Titanic 4.28330 (YES) 3.77819 (NO) 3.65223 (NO) 3.01822 (NO)
Twonorm 4.01291 (YES) 4.01121 (YES) 3.91241 (YES) 3.41839 (NO)
Waveform 4.01197 (YES) 3.99871 (YES) 3.89215 (YES) 2.81376 (NO)
Average 4.53086 (12 YES/1 NO) 4.45996 (10 YES/3 NO) 4.11471 (9 YES/4 NO) 3.02710 (0 YES/13 NO)
(‘‘YES’’ or ‘‘NO’’ in the parentheses indicates whether these two algorithms perform significantly different on this data set).
Table 6
McNemar’s statistical test results between Diverse AdaBoostSVM and the compared algorithms
Data set McNemar’s statistic ðABSVMsDABSVMÞ McNemar’s statistic ðABDTDABSVMÞ McNemar’s statistic ðABNNDABSVMÞ McNemar’s statistic ðSVMDABSVMÞ
Banana 5.18291 (YES) 4.89967 (YES) 4.28770 (YES) 3.18921 (NO) B. cancer 4.83708 (YES) 5.30089 (YES) 4.89013 (YES) 3.88942 (YES) Diabetes 3.27817 (NO) 4.93101 (YES) 4.68291 (YES) 3.49284 (NO) German 4.29164 (YES) 5.48552 (YES) 5.33092 (YES) 3.89018 (YES)
Heart 4.40081 (YES) 5.28919 (YES) 5.23980 (YES) 3.48237(NO)
Image 5.51728 (YES) 4.28853 (YES) 3.27116 (NO) 3.52349 (NO)
Ringnorm 5.19374 (YES) 3.67192 (NO) 3.49381 (NO) 2.94509 (NO) F. solar 4.98732 (YES) 5.18392 (YES) 4.37186 (YES) 3.74320 (NO)
Splice 4.19383 (YES) 3.80208 (NO) 3.70918 (NO) 2.53249 (NO)
Thyroid 5.22328 (YES) 4.42862 (YES) 4.38510 (YES) 3.92787 (YES) Titanic 4.39827 (YES) 3.93800 (YES) 3.71902 (NO) 3.34328 (NO) Twonorm 4.11873 (YES) 4.09128 (YES) 3.99808 (YES) 3.64354 (NO) Waveform 4.32891 (YES) 4.11837 (YES) 3.92473 (YES) 2.98234 (NO)
Average 4.61169 (12 YES/1 NO) 4.56950 (10 YES/2 NO) 4.25496 (9 YES/4 NO) 3.42964 (3 YES/10 NO)
(‘‘YES’’ or ‘‘NO’’ in the parentheses indicates whether these two algorithms perform significantly different on this data set).
each McNemar’s statistic (Eq. (9)) is larger than 3.841459. Furthermore, since the generalization errors of
Ada-BoostSVM are less than those of AdaBoostDT on these
10 data sets (see Table 6),AdaBoostSVMperforms better than AdaBoostDT on these 10 data sets. Hence, we can conclude that proposedAdaBoostSVMalgorithm performs better than ABDT in general on these data sets. A similar conclusion can also be drawn from Table 5 that
AdaBoostSVM outperforms ABNN, and is comparable to
the standard SVM. It can be observed that the ABSVMs performs worse than the standard SVM. We think that this is because ABSVMsforces the strong SVM classifiers (SVM with its best parameters) to focus on very hard training samples or outliers more emphatically. This case is also observed in Wickramaratna et al. (2001). Generally speaking, for balanced classification problems, the con-tribution of the proposed AdaBoostSVM lies in the corroborative proof and realization of Valentini and
Dietterich’s (2004) idea, that states that AdaBoost with
heterogeneous SVMs could work well. Furthermore, proposed AdaBoostSVM outperforms other Boosting algorithms on these balanced data sets, which has been justified statistically verified by our extensive experiments based on McNemar’s statistical test.
From Table 6, similar conclusions can also be drawn
that our proposed Diverse AdaBoostSVM outperforms both ABDTand ABNNin general on these benchmark data sets. Moreover, since the Diverse AdaBoostSVM outper-forms the standard SVM on 3 data sets while comparable on the other 10 data sets, we say that proposed Diverse
AdaBoostSVMperforms a little better than standard SVM
in general.
5.1.3. Influence of C andsini
In order to show the influence of parameter C on
AdaBoostSVM, we use the results on the UCI ‘‘Titanic’’
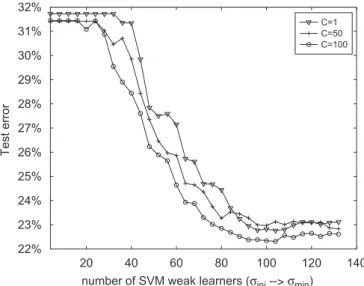
data set for illustration. We vary the value ofCfrom 1 to 100, and perform experiments on 100 random partitions of this data set to obtain the average generalization perfor-mance.Fig. 3shows the comparative results. Over a large range, the variation ofChas little effect (less than 1%) on the final generalization performance. This is also consistent with the analysis of RBFSVM inValentini and Dietterich
(2004) thatC value has less effect on the performance of
RBFSVM. Note that thesvalue decreases fromsinitosmin as the number of SVM component classifiers increases (see the label of horizontal axis inFig. 3). The small platform at the left top corner of this figure means that the test error does not decrease until the s reduces to a certain value. Then, the test error decreases quickly to the lowest value and stabilities there. This shows that thesini value does not have much impact on the final performance of
Ada-BoostSVM.
5.1.4. Influence ofsstep
In order to show the influence of the step size of parameter sstep on AdaBoostSVM, we also use the results
on the UCI ‘‘Titanic’’ data set for illustration. A set of experiments with different sstep values on the ‘‘Titanic’’ data set were performed.Fig. 4gives the results. From this figure, we can find that, although the number of learning cycles inAdaBoostSVMchanges with the value ofsstep, the final test error is relatively stable. Similar conclusions can also be drawn on other benchmark data sets.
5.2. Comparison on imbalanced data sets
Although SVM has achieved great success in many area, such as handwriting recognition (Vapnik, 1998), text classification (Joachims, 1998) and image retrieval (Tong
and Koller, 2001), when handling imbalanced classification
problems, its performance drops significantly. In this section, we will show the performance of our proposed
AdaBoostSVMon imbalanced classification problems and
20 40 60 80 100 120 140 22% 23% 24% 25% 26% 27% 28% 29% 30% 31% 32%
number of SVM weak learners (σini --> σmin)
Test error
C=1 C=50 C=100
Fig. 3. The performance of AdaBoostSVM with differentCvalues.
20 40 60 80 100 120 140 22% 23% 24% 25% 26% 27% 28% 29% 30% 31% 32%
Number of SVM component classifier
Test error
σstep=1
σstep=2
σstep=3
compare it with several state-of-the-art algorithms specifi-cally designed to solve these problems.
5.2.1. Review of current algorithms dealing with imbalanced problems
In the case of binary classification, imbalanced classifica-tion means that the number of negative instances is much larger than that of positive ones, or vice versa, such as imbalanced document categorization (del Castillo and
Serrano, 2004), imbalanced clustering for microarray data
(Pearson et al., 2003), detecting credit card fraud (Fawcett
and Provost, 1997) and many data mining tasks (Aaai’2000
Workshop on Learning from Imbalanced Data Sets, 2000; Icml’2003 Workshop on Learning from Imbalanced Data
Sets (ii), 2003; Editorial: Special issue on learning from
imbalanced data sets, 2004. SIGKDD Explorations).
A common method to handle imbalanced problems is to rebalance them artificially by under-sampling (Kubat and
Matwin, 1997) (ignoring instances from the majority class)
or over-sampling (Chawla et al., 2002) (replicating instances from the minority class) or combination of both under-sampling and over-sampling (Ling and Li, 1998). The popular approach is the SMOTE algorithm (Chawla
et al., 2002), which synthetically over-samples the minority
class. Another type of algorithms focuses on biasing the SVM to deal with the imbalanced problems. Several different ways are used. In Veropoulos et al. (1999), different penalty constants are used for different classes to control the balance between false positive instances and false negative instances.Cristianini et al. (2001)use kernel alignment to adjust the kernel matrix to fit the training samples. Wu and Chang (2005) realize this by kernel boundary alignment. Furthermore, inAkbani et al. (2004), SMOTE and different error costs are combined for SVM to better handle imbalanced problems. Decision tree (
Drum-mond and Holte, 2000) and multiplayer perceptron
(Nugroho et al., 2002) are also modified to improve the
learning performance on imbalanced data sets. InGuo and
Viktor (2004), Boosting combined with data generation is
used to solve imbalanced problems. Another similar work
(Yan et al., 2003) uses SVM ensemble to predict rare
classes in scene classification.
5.2.2. Generalization performance on imbalanced data sets
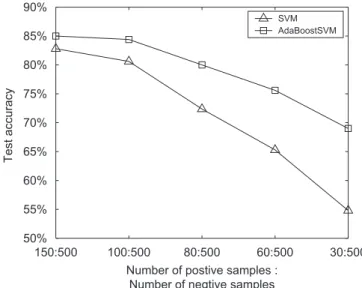
Firstly, we compare our AdaBoostSVM with the standard SVM on the UCI ‘‘Splice’’ data set. The ‘‘Splice’’ data set has 483 positive training samples, 517 negative training samples and 2175 test samples. In the following experiments, the number of negative samples is fixed at 500 and the number of positive samples is reduced from 150 to 30 step-wise to realize different imbalance ratios. From
Fig. 5, it can be found that along with the decreasing ratio
of positive samples to that of negative ones, the improve-ment of AdaBoostSVM over SVM increases monotoni-cally. When the ratio reaches 30:500, SVM almost cannot work and performs like random guess. On the other hand,
AdaBoostSVMcan still work, and the improvement reach
about 15%.
In the following, AdaBoostSVM is compared with four algorithms, which are standard SVM (Vapnik, 1998), SVM with different penalty constants (SVM-DPC) (Veropoulos
et al., 1999), Under-sampling (US) (Kubat and Matwin,
1997) and SMOTE (Chawla et al., 2002). Five UCI imbalanced data sets are used, namely Car(3), Glass(7), Letter(26), Segment(1) and Soybean(12). The class labels in the parentheses indicate the classes selected. For each data set, we randomly split it into training and test sets in the ratio of 70%:30%, and in these two sets, the ratios between the numbers of positive and negative instances are roughly same (Kubat and Matwin, 1997). InTable 7, the general characteristics of these data sets are given including the number of attributes, the number of positive instances and the number of negative instances. It also lists the amount of over-sampling of the minority class for SMOTE as suggested in Wu and Chang (2005). For SVM-DPC, the two penalty cost values are decided according to Akbani
et al. (2004), where their ratio is set as the inverse of the ratio
of the instance numbers in the two classes. For the under-sampling algorithm, the majority class is under-sampled by randomly removing samples from the majority class until it has the same number of instances as minority class.
The commonly used sensitivity and specificity are taken to measure the performance of each algorithm on the imbalanced data sets. They are defined as
Sensitivity¼ #true_positive
#true_positiveþ#false_negative, (10)
Specificity¼ #true_negative
#true_negativeþ#false_positive. (11) Several researchers (Kubat and Matwin, 1997; Wu and
Chang, 2005; Akbani et al., 2004) have used the g-means
150:500 100:500 80:500 60:500 30:500 50% 55% 60% 65% 70% 75% 80% 85% 90%
Number of postive samples : Number of negtive samples
Test accuracy
SVM AdaBoostSVM
Fig. 5. Comparison between AdaBoostSVM and SVM on imbalanced data sets.
metric to evaluate the algorithm performance on imbal-anced problems becauseg-means metric combines both the sensitivity and specificity by taking their geometric mean. Based on sensitivity and specificity, the g-means metric in
Kubat and Matwin (1997) is calculated to evaluate these
five algorithms on the imbalanced data sets. It is defined as follows:
g¼pffiffiffiffiffiffiffiffiffiffiffiffiffiffiffiffiffiffiffiffiffiffiffiffiffiffiffiffiffiffiffiffiffiffiffiffiffiffiffiffiffiffiffiffiffiffisensitivityspecificity. (12) Theg-means metric value of the five algorithms on the UCI imbalanced data sets are shown inTable 8. From this table, it can be found that proposed AdaBoostSVM performs best among the five algorithms in general. It achieves the highest g-means metric value in four out of the five data sets and also obtain the highest average g-means metric value among them. The success of the proposed algorithm lies in its Boosting mechanism forcing part of RBFSVM component classifiers to focus on the misclassified instances in the minority class, which can prevent the minority class from being wrongly recognized as a noise of the majority class and classified into it. Hence, the AdaBoostSVM
achieves better generalization performance on the imbal-anced data sets. Note that the g-means metric value of SVM on ‘‘Car3’’ data set is 0. This is because SVM predict all the instances into the majority class.
Furthermore, the Receiver Operating Characteristic (ROC) analysis has been done. We use the Area Under the ROC curve (AUC) (Bradley, 1997) to compare these five algorithms on these imbalanced data sets. The AUC is defined as the area under an ROC curve. It is known that larger AUC values indicate generally better classifier performance (Hand, 1997). The AUC values listed in
Table 9illustrate thatAdaBoostSVM achieves the highest
average AUC values in all the five data sets. Statistically, the higher AUC values obtained byAdaBoostSVMmeans
that AdaBoostSVM would favor classifying a positive
(target) instance with a higher probability than other algorithms and so it can better handle the imbalanced problems.
6. Conclusions
AdaBoost with properly designed SVM-based compo-nent classifiers is proposed in this paper, which is achieved by adaptively adjusting the kernel parameter to get a set of effective RBFSVM component classifiers. Experimental results on benchmark data sets demonstrate that proposed
AdaBoostSVM performs better than other approaches of
using component classifiers such as Decision Trees and Neural Networks. Besides these, it is found that
Ada-BoostSVMdemonstrates good performance on imbalanced
classification problems. An improved version is further developed to deal with the accuracy/diversity dilemma in Boosting algorithms, giving rising to better generalization performance.
References
Aaai’2000 Workshop on Learning from Imbalanced Data Sets. 2000. Akbani, R., Kwek, S., Japkowicz, N., 2004. Applying support vector
machines to imbalanced datasets. In: Proceedings of the 15th European Conference on Machine Learning, pp. 39–50.
Baudat, G., Anouar, F., 2000. Generalized discriminant analysis using a kernel approach. Neural Computation 12, 2385–2404.
Bauer, E., Kohavi, R., 1999. An empirical comparison of voting classification algorithms: bagging, boosting, and variants. Machine Learning 36 (1), 105–139.
Bradley, A.P., 1997. The use of the area under the roc curve in the evaluation of machine learning algorithms. Pattern Recognition 30, 1145–1159.
Breiman, L., 1996. Bagging predictors. Machine Learning 24, 123–140. Chawla, N.V., Bowyer, K.W., Hall, L.O., Kegelmeyer, W.P., 2002. Smote:
synthetic minority over-sampling technique. Journal of Artificial Intelligence Research 16, 321–357.
Cristianini, N., Shawe-Taylor, J., Elisseeff, A., Kandola, J.S., 2001. On kernel-target alignment. In: Advances in Neural Information Proces-sing Systems, pp. 367–373.
Dasgupta, S., Long, P.M., 2003. Boosting with diverse base classifiers. In: Proceedings of the 16th Annual Conference on Learning Theory, pp. 273–287.
Table 7
General characteristics of UCI imbalanced data sets and the amount of over-sampling of the minority class for the SMOTE algorithm
Data set # Attribute # Minority class # Majority class Over-sampled (%) Segment1 19 330 1980 200 Glass7 10 29 185 200 Soybean12 35 44 639 400 Car3 6 69 1659 400 Letter26 17 734 19 266 400 Table 8
g-means metric results on the five UCI imbalanced data sets
Data set SVM SVM-DPC US SMOTE AdaBoostSVM
Segment1 0.995 0.956 0.945 0.958 0.965 Glass7 0.867 0.874 0.835 0.863 0.885 Soybean12 0.926 0.993 0.921 0.975 0.997 Car3 0 0.382 0.925 0.966 0.975 Letter26 0.818 0.934 0.913 0.927 0.945 Average 0.721 0.827 0.908 0.938 0.953 Table 9
AUS results on the five UCI imbalanced data sets
Data set SVM SVM-DPC US SMOTE AdaBoostSVM
Segment1 0.998 0.982 0.978 0.985 0.991 Glass7 0.943 0.956 0.938 0.941 0.963 Soybean12 0.960 0.998 0.955 0.989 1.000 Car3 0.631 0.762 0.962 0.984 0.997 Letter26 0.933 0.978 0.950 0.964 0.985 Average 0.893 0.935 0.957 0.972 0.987
del Castillo, M.D., Serrano, J.I., 2004. A multistrategy approach for digital text categorization from imbalanced documents. In: ACM SIGKDD Explorations: Special Issue on Learning from Imbalanced Datasets, pp. 39–70.
Dietterich, T.G., 1998. Approximate statistical tests for comparing supervised classification learning algorithms. Neural Computation 10, 1895–1923.
Dietterich, T.G., 2000. An experimental comparison of three methods for constructing ensembles of decision trees: bagging, boosting, and randomization. Machine Learning 40 (2), 139–157.
Domeniconi, C., Yan, B., 2004. Nearest neighbor ensemble. In: Proceedings of the 17th International Conference on Pattern Recognition, pp. 23–26.
Drummond, C., Holte, R., 2000. Exploiting the cost (in)sensitivity of decision tree splitting criteria. In: Proceedings of the 17th International Conference on Machine Learning, pp. 239–246.
Editorial: Special issue on learning from imbalanced data sets. 2004. SIGKDD Explorations 6.
Eveitt, B., 1977. The Analysis of Contingency Tables. Chapman & Hall, London.
Fawcett, T., Provost, F., 1997. Adaptive fraud detection. Data Mining and Knowledge Discovery 1 (3), 291–316.
Freund, Y., Schapire, R.E., 1997. A decision-theoretic generalization of on-line learning and an application to boosting. Journal of Computer and System Sciences 55 (1), 119–139.
Guo, H., Viktor, H.L., 2004. Learning from imbalanced data sets with boosting and data generation: the databoost-im approach. In: ACM SIGKDD Explorations: Special Issue on Learning from Imbalanced Datasets, pp. 30–39.
Hand, D., 1997. Construction and Assessment of Classification Rules. Wiley, UK.
hhttp://mlg.anu.edu.au/raetsch/datai.
Icml’2003 Workshop on Learning from Imbalanced Data Sets (ii). 2003. Joachims, T., 1998. Text categorization with support vector machines:
learning with many relevant features. In: Proceedings of the 10th European Conference on Machine Learning, pp. 137–142.
Kubat, M., Matwin, S., 1997. Addressing the curse of imbalanced training sets: one-sided selection. In: Proceedings of the 14th International Conference on Machine Learning, pp. 179–186.
Kuncheva, L.I., Whitaker, C.J., 2002. Using diversity with three variants of boosting: aggressive conservative and inverse. In: Proceedings of the 3rd International Workshop on Multiple Classifier Systems. Kuncheva, L.I., Whitaker, C.J., 2003. Measures of diversity in classifier
ensembles and their relationship with the ensemble accuracy. Machine Learning 51 (2), 181–207.
Ling, C.X., Li, C., 1998. Data mining for direct marketing problems and solutions. In: Proceedings of the 4th International Conference on Knowledge Discovery and Data Mining.
Margineantu, D.D., Dietterich, T.G., 1997. Pruning adaptive boosting. In: Proceedings of the 14th International Conference on Machine Learning, pp. 211–218.
Melville, P., Mooney, R.J., 2005. Creating diversity in ensembles using artificial data. Information Fusion 6 (1), 99–111.
Nugroho, A., Kuroyanagi, S., Iwata, A., 2002. A solution for imbalanced training sets problem by combnet-ii and its application on fog forecasting. In: IEICE Transactions on Information and Systems, pp. 1165–1174.
Opitz, D., Maclin, R., 1999. Popular ensemble methods: an empirical study. Journal of Artificial Intelligence Research 11, 169–198. Pearson, R., Goney, G., Shwaber, J., 2003. Imbalanced clustering for
microarray time-series. In: ICML’2003 Workshop on Learning from Imbalanced Data Sets (II).
Ratsch, G., 2001. Soft margins for adaboost. Machine Learning 42 (3), 287–320.
Schapire, R.E., 2002. The boosting approach to machine learning: an overview. In: MSRI Workshop on Nonlinear Estimation and Classification.
Schapire, R.E., Singer, Y., 1999. Improved boosting algorithms using confidence-rated predictions. Machine Learning 37 (3), 297–336. Schapire, R.E., Singer, Y., Bartlett, P., Lee, W., 1998. Boosting the
margin: a new explanation for the effectiveness of voting methods. The Annals of Statistics 26 (5), 1651–1686.
Scholkopf, B., Sung, K.-K., Burges, C., Girosi, F., Niyogi, P., Poggio, T., Vapnik, V., 1997. Comparing support vector machines with Gaussian kernels to radial basis function classifiers. IEEE Transactions on Signal Processing 45 (11), 2758–2765.
Schwenk, H., Bengio, Y., 2000. Boosting neural networks. Neural Computation 12, 1869–1887.
Shin, H.W., Sohn, S.Y., 2005. Selected tree classifier combination based on both accuracy and error diversity. Pattern Recognition 38, 191–197. Tong, S., Koller, D., 2001. Support vector machine active learning with applications to text classification. Journal of Machine Learning Research 2, 45–66.
Valentini, G., Dietterich, T.G., 2004. Bias-variance analysis of support vector machines for the development of SVM-based ensemble methods. Journal of Machine Learning Research 5, 725–775. Vapnik, V., 1998. Statistical Learning Theory. Wiley, New York. Veropoulos, K., Campbell, C., Cristianini, N., 1999. Controlling the
sensitivity of support vector machines. In: Proceedings of the International Joint Conference on Artificial Intelligent, pp. 55–60. Wickramaratna, J., Holden, S.B., Buxton, B.F., 2001. Performance
degradation in boosting. In: Proceedings of the Second International Workshop on Multiple Classifier Systems, pp. 11–21.
Windeatt, T., 2005. Diversity measures for multiple classifier system analysis and design. Information Fusion 6, 21–36.
Wu, G., Chang, E.Y., 2005. Kba: kernel boundary alignment considering imbalanced data distribution. IEEE Transactions on Knowledge and Data Engineering 17 (6), 786–795.
Yan, R., Liu, Y., Jin, R., Hauptmann, A., 2003. On predicting rare class with SVM ensemble in scene classification. In: Proceedings of the IEEE International Conference on Acoustics, Speech, and Signal 2003, April 2003, pp. III–21–4.