GROUP ANALYSIS BASED ON MULTILEVEL
BAYESIAN FOR FMRI DATA
Feng Yang
School of Computer Science &Technology Heilongjiang University China (150080), Harbin, Heilongjiang [email protected] Kuang Fu
The Second Affiliated Hospital of Harbin Medical University
China (150001), Harbin, Heilongjiang
Ai Zhou
College of the Humanities Jilin University
China (130012), Changchun, Jilin [email protected]
ABSTRACT
This paper suggests one method to process fMRI time series based on Bayesian inference for group analysis. The method is based on Bayesian inference to divide group into multilevel by session, subject and group levels. It compares covariance to select prior to reinforce posterior probability in group analysis. At the same time it combines classical statistics, i.e., t-statistics to obtain voxel activation at subject level as prior for Bayesian inference at group level. Through the method, it can effectively decrease computation expensive and reduce complexity. Therefore the experimental results show robust on Bayesian inference for group analysis.
Keywords
fMRI time series, Classical statistics, Bayesian Inference, group analysis.
1.
INTRODUCTION
Functional MRI is a noninvasive technique for studying brain activities [Lin08]. It measures blood oxygenation level dependent (BOLD) with hemodynamic response signal to identify brain activation by stimulus. BOLD fMRI characterizes hemodynamic response function (HRF) to measure brain spatial distribution based on neural activity by vascular hemodynamic variation. There are several common objectives in the analysis of fMRI data. From localizing regions of the brain activated by stimulus to detect brain distributed networks, it mainly focuses on brain function and makes predictions about psychological or disease diagnosis. Currently on fMRI data analysis, most attentions from researchers focus on brain functional connectivity and perform cognition functions. To understand the brain, we depend on conceptual neuroscience, anatomical structure, statistical methods and some causal models that link psychological and physiological activations about how it works for observation and experimental data [Smi04]. Most ways of fMRI analysis depend on the brain that shows increased intensity at some points in
time series of fMRI data with stimulation [Fri05]. Most of analysis fMRI data methods are divided into two categories: One is model driven and the other is data driven [Kai09].
For model driven, it mainly defines model to construct the relationship between the stimulus and response. Commonly it uses classical statistics methods, to measure data characteristics. Thus, the statistical methods of fMRI data are facing challenge. Alternative method is data driven. It is based on data intensity to compute distance, similarity or feature, for instance, Cluster analysis, independent component analysis (ICA), principle component analysis (PCA) and self-organization mapping etc.,. For large number of data, reducing computational complexity makes the important decision.
Most analysis methods for fMRI data are based on classical statistics methods with a general linear model (GLM) to estimate parameter for each voxel and inference by t-Statistics to map p-value to detect voxel activition. Through reject H0 assumption, it
shows voxel activation or no activation with threshold to reject or accept H0. Dur to issues on
classical method, e.g., never reject alternative assumption meaning activation always occurred, and existing false positive ratio (FDR) for multiple comparison problems. To avoid these issues, alternative method is Bayesian. Bayesian method, on the contrary, can give the probability that the effect is greater than some threshold values under voxel activation. Hence, these limitations of the classical approaches could be overcome by using the Bayesian Permission to make digital or hard copies of all or part of
this work for personal or classroom use is granted without fee provided that copies are not made or distributed for profit or commercial advantage and that copies bear this notice and the full citation on the first page. To copy otherwise, or republish, to post on servers or to redistribute to lists, requires prior specific permission and/or a fee.
method. It provides a means of updating the distribution over parameters from the prior to the posterior distribution on the observed data. Especially Bayesian methods are introduced to analyze group data processing.
As such it proposed the first Bayesian group inference approach using a hierarchical model [Mar12]. It uses hiearchical linear model and Bayesian rule under the specification of priors on the assumption parameters or activations. Through it assumes that prior distrbution is fitted to normal distrbution, it estimates parameters and error by expectation maximum (EM) algorithm. Bayesian uses high-level estimate as prior and then enable to estimate posterior inferences about the parameters in low-level. Hierarchical Bayesian models consist of an observation model for the data and priors for the unknown parameters.
This paper suggests a multilevel Bayesian inference method for health group analysis based on hierarchical model. The multilevel group method is proportional to multiple levels according to first level as prior for group level based on Bayesian posterior probability.
For the paper structure, section II presents Bayesian inference theory and estimation procedure in multilevel group analysis. Section III shows an fMRI case analysis with lower level of individual subject and with higher level of group. Section IV discusses the effects of multilevel group about estimated parameters and compares commons among different subjects. The last part we specify Bayesian methods for fMRI dynamic analysis in the future.
2.
BAYESIAN METHODS
Bayesian methods summarize evidences for statistical inference with conditional or posterior inference based on the posterior distribution of the activations. The first paper based on Bayesian inference was on PET in 1993 and the first Bayesian approaches in fMRI with point estimation Maximum a Posterior Bayesian approaches to incorporate prior information. A fully Bayesian statistics approach as the first paper considered the full posterior probability distribution was appeared in 1998 [Mar12]. Most methods [Fri02a, Fri02b] describe Bayesian on hierarchical linear model to form first level recursively. Some combine hierarchical model with classical by Empirical Bayesian, called all in one [Woo04] that two methods are based on the same principle by covariance components and EM. And also the two methods can complement more activated voxels each other. All in one method includes fixed effects and random effects. On the model, its higher level estimator for parameters could be prior in lower level, and parameters estimation uses EM algorithm. Some methods [Woo04, Bec03] analyzed fMRI data
by summary statistics passing the first level parameters of interesting as prior to the second level. They compared two methods to compute top level likelihood with marginal posterior and a Markov chain Monte Carlo (MCMC) algorithm. And also in [Neu03], it gives the different explanations according to Bayesian principles guided by [Box92]. For group analysis, it shows multilevel from subject level to group level. In [Cam11], it uses Bayesian to cluster analysis for group level. The method [Mar12] shows the all procedures of Bayesian in fMRI analysis, Bayesian methods are used by statistics inference about activation voxels and by group analysis, and also they are used into Bayesian learning in dynamic casual model (DCM) with effective connectivity. Especially in [Woo11], it demonstrates that hierarchical Bayesian analysis outperforms conventional individual-level or group-level maximum likelihood estimation in recovering true parameters.
For group analysis, Bayesian methods relay on prior selection. Usually prior is from temporal or spatial, or both. Temporal prior is commonly designed by hierarchical model divided into session level, subject level and group level to form two levels. For spatial prior, some methods use Brain regions or areas to characterize the spatial characteristics of the HRF using Bayesian inference and spatial priors over the regression coefficients [Pen03].
This paper proposes a multilevel method for group based on Bayesian hierarchical model to describe the correlation structure of the observed data. The model provides a joint posterior distribution of voxel in order to determine the statistical significance of the voxel correlations. The method combines Bayesian with hierarchical linear model to estimate parameters from observed data by EM algorithm in group analysis. About prior selection, it suggests that prior is selected from different individual subjects based on voxel in single subject through classical first level to estimate parameters. Thus, it uses Bayesian rules to compute posterior probability as next subject prior at the same voxel estimation recursively.
According to the Bayesian inference based on hierarchical linear model, the computation procedure of the model in details is shown as Figure 1.
For fMRI data, Bayes methods directly obtain posterior distribution of parameters combined prior with observed data on unknown parameters and easily to compute the probability of parameters by Bayesian rules. These priors can be estimated from given the data and they have observed multiple instances of the effect in interested regions. All the estimation processing is referred to as empirical Bayes [Ash03].
Classical Estimate
1
(1) 0i
Bayesian Rule i=i+1 i<= number of subjects in group ) | ( () y pi ) ( ) (i pCompare and evaulation Group similarity T
F
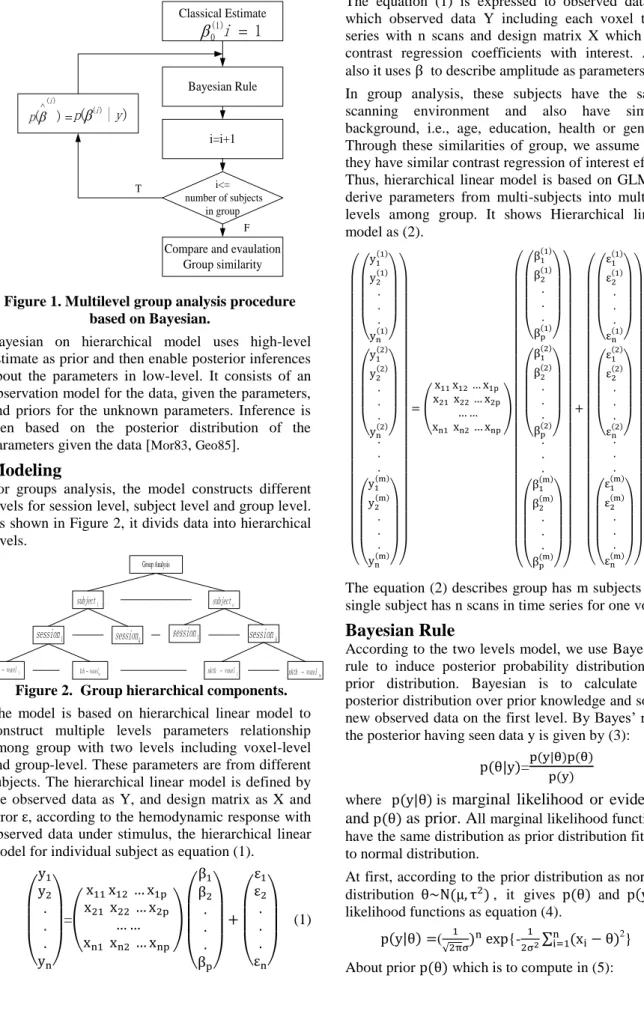
Figure 1. Multilevel group analysis procedure based on Bayesian.
Bayesian on hierarchical model uses high-level estimate as prior and then enable posterior inferences about the parameters in low-level. It consists of an observation model for the data, given the parameters, and priors for the unknown parameters. Inference is then based on the posterior distribution of the parameters given the data [Mor83, Geo85].
Modeling
For groups analysis, the model constructs different levels for session level, subject level and group level. As shown in Figure 2, it divids data into hierarchical levels.
Group Analysis
1
subject subjectn
1
session sessionk session1 sessionk 1
1thvoxel 1thvoxeltp nkthvoxel1 nkthvoxeltp
Figure 2. Group hierarchical components.
The model is based on hierarchical linear model to construct multiple levels parameters relationship among group with two levels including voxel-level and group-level. These parameters are from different subjects. The hierarchical linear model is defined by the observed data as Y, and design matrix as X and error , according to the hemodynamic response with observed data under stimulus, the hierarchical linear model for individual subject as equation (1).
( ) =( ) ( ) ( ) (1)
The equation (1) is expressed to observed data Y which observed data Y including each voxel time series with n scans and design matrix X which has contrast regression coefficients with interest. And also it uses to describe amplitude as parameters. In group analysis, these subjects have the same scanning environment and also have similar background, i.e., age, education, health or gender. Through these similarities of group, we assume that they have similar contrast regression of interest effect. Thus, hierarchical linear model is based on GLM to derive parameters from multi-subjects into multiple levels among group. It shows Hierarchical linear model as (2). ( ( ( ) ( ) ( )) ( ( ) ( ) ( )) ( ( ) ( ) ( ))) ( ) ( ( ( ) ( ) ( ) ) ( ( ) ( ) ( ) ) ( ( ) ( ) ( ) )) ( ( ( ) ( ) ( )) ( ( ) ( ) ( )) ( ( ) ( ) ( ))) (2)
The equation (2) describes group has m subjects and single subject has n scans in time series for one voxel.
Bayesian Rule
According to the two levels model, we use Bayesian rule to induce posterior probability distribution by prior distribution. Bayesian is to calculate the posterior distribution over prior knowledge and some new observed data on the first level. By Bayes’ rule, the posterior having seen data y is given by (3):
( )= ( ) ( )
( ) (3)
where ( ) is
marginal likelihood or evidence
and
( )as prior. A
ll marginal likelihood functions have the same distribution as prior distribution fitting to normal distribution.At first, according to the prior distribution as normal distribution ( ), it gives ( ) and ( ) likelihood functions as equation (4).
( ) (
√ ) {- ∑ ( ) 2
} (4) About prior ( ) which is to compute in (5):
( )
=√ * ( )
+ (5)
By Bayesian rule (6) to obtain ( ) :
P( y) p( )* P(y| ) (6) We obtain the p( y) probability density function in (7). In details, it is described at [Box92].
( ) ( )
√
[ ( )( ̅) ] (7)
Its mean and covariance are shown as equation (8). ̅
( )
̅ ( ) (8) Combining the hierarchical linear model with Bayesian rule in group, it has basic formulation as below (9).
( | ) ( | ) ( )
( ) ∏ ( )
( ) ( ) (9)
This induction is from [Bra96]. Thus, it combines all formulations into multilevel in group analysis to show posterior and prior relation as formula (10).
( ( )) ( ( ) ( )) ( ( ) ( ))
( ( ) ( )) ( ( )) (10)
For prior selection, some suggest spatial prior [Pen05] and some use wavelet coefficients as prior [San12]. As like Stephan [Neu03] said, “Today’s posterior is tomorrow’s prior” which we use the rule as one subject parameters as prior for next subject in group analysis to reduce computation cost and complexity.
Estimation
We use an empirical Bayes methodology to estimate the hyperparameters in EM algorithm and, as these hyperparameters are shared by all subjects in the group. Parametric empirical Bayes (PEB) can be formulated classically in terms of covariance component estimation (e.g. within subject vs. between subject contributions to error) [Mor83, Geo85]. Through the result of p( y), we estimate posterior mean and posterior covariance.
To estimate the covariance components, many different computation methods are used, for example, some use point estimation, some use maximum a posterior probability (MAP) with MCMC under numerical integration unavailable.
For Bayesian posterior probability estimation, it is utilized by EM algorithm. In [Fri02a], it uses EM algorithm to estimate error and prior covariance. It has two basic steps in EM algorithm as (11).
For two steps, one is E-step and the other is M-step.
E-step: ( | ( )) ( ( ( )) ( )) M-step: ( ) ( ( | ( ))) (11) E-step computes likelihood function according to ith effect or initial value by the first subject and M-step makes likelihood function maximum to obtain new parameters. Iteratively it obtains estimator through the two steps iteratively until convergence.
Inference
This section describes the construction of posterior probability maps that enable conditional or Bayesian inferences about regional specific effects in neuroimaging. Posterior probability maps (PPMs) are images of the probability or confidence that activation exceeds some specified threshold, given the data [Fri03]. It will make mean as Bayesian estimator to compute p by (12).
P=1- (
√ ) (12)
. is the cumulative density function of the unit normal distribution. An image of these posterior probabilities constitutes a PPM. According to the p-value, it will map PPMs to show the activation distribution about voxels on confidence 95%. The probability of activation by given the data is the same at any particular voxel, whether one has analyzed that voxel or the entire brain.
Bayesian inference procedure is shown by Figure 3. At the first level of the hierarchy, it corresponds to the experimental effects at voxel-level and obtains
Prior distribution Bayesian rule Posterior distribution Estimate prior covariance Prior known? Compute posterior Mean and covariance
Compute p-value
PPMs
T F
Figure 3. Bayesian inference with PPMs procedure.
the probability of voxel activation. At the second level of the hierarchy, it comprises the effects over subjects through the first level or voxel-level effects. Thus, statistics from a lower level in the hierarchy are needed in the analysis of the next level.
All the procedure is focused on posterior probability computation. At the same time, Bayesian inference requires prior known or unknown estimated from given data. This posterior density can be computed, under Gaussian assumptions, using Bayes rules. PPMs require the posterior distribution or conditional distribution of the activation (a contrast of conditional parameter estimates) given the data [Ash03].
As above the procedure, we use the procedure to compute the probability of activation for each voxel in one subject and uses PPMs to show the effects of statistics by Bayesian.
3.
EXPERIMENTS
Data Collection
In this experiment, we choose the dataset which consists of 24 contiguous slices, 64×64×24 in each volume with 2×2×2 mm3 voxels in thickness 5mm with whole brain BOLD response acquired using 3.0T fMRI system. Each subject was permitted to take four sessions and each session is achieved by 150 scans in functional images. Commonly, the dataset still includes structural images T1*and DTI. For block design, it has blocks of 6 scans with 12 blocks by delete the first 6 scans in TR 2s. We design the task with the condition for successive blocks alternated between rest and visual picture stimulation, starting with rest.
Preprocessing
During scanning fMRI data, although usually subject is required to fix in a frame to avoid motion to reduce images artifacts, due to machine heating effects, physical effects as cardiac and respiration, and moving from subjects, these images from scanning include some noises. Some noises from machine heating with high frequency are eliminated by high frequency filters rather than some noises can be deleted by filters such as cardiac and respiration. Some artifacts from motion can be corrected by preprocessing.
The key issues of preprocessing in statistical parameter mapping (SPM) are mainly involved: (1) realignment: It completes motion correct by align images according to the first image in the each session and align other sessions according to the first session; (2) coregistration: Match images from same subject but different modalities by coregistration. It supplies mean images in data to register structural image solving consistence between functional images and structural images; (3) segmentation: It segments structure T1* image to grey matter, white matter and
CSF. Therefore, it obtained some parameters for normalize functional images; (4) normalization: Make results from different studies compared by aligning them to standard space it can deal with different Talairach problems. It normalizes functional images onto template images, for example, EPI template; (5) smoothing: Through removing lower frequency noises, it extends larger spatial SNR in spatial overlap by blurring over minor anatomical differences and registration errors; For our experiment, we choose realignment and normalize to reduce motion artifacts and make data being consistence. Due to the classical inference smoothing as preprocessing to improve SNR, we separate data without smoothing for Bayesian 1st level.
Results
Efficient computation at the second-level requires full access to the first-level parameter estimates and associated covariance. This involves both the variances of the parameter estimates and the covariance between different parameters [Bec03]. The data is transferred from a single time-series to a single statistical value.
PPMs show posterior probability p value about activation in group analysis. According to the activation, is given the results in PPMs which plot a map of effect sizes at voxels where it is 99% sure that the effect size is greater than 2% of the global mean. Through the PPMs, the analysis compares the similar covariance among group in Table 1 which is arranged columns which are from left to right as: (i) region of interest; (ii) voxel-level t-value; (iii) Z-value; (iv) means; and (v) standard deviate. The maximum intensity projection (MIP) of the statistical map is displayed [Moh07]. In Figure 4, it is shown the fitted response through even-relative response results among some subjects. With the activation on voxels for individual subjects, we can compare different subjects in the group with similar variances and choose the similar subjects as priors for next group computation.
Region
(ROI) t Z mean Standard deviate 1 L Heschl gyrus 3.54 3.42 0.32 0.02 2 R Heschl gyrus 3.49 -3.83 -0.35 0.02 3 L hippocampus 4.20 4.54 0.16 0.01 4 R hippocampus 4.34 -4.20 -0.11 0.01 5 L occipital gyrus 3.23 3.34 0.13 0.01 6 R occipital gyrus 3.45 -4.12 -0.12 0.01
Table 1. Group Bayesian estimate by prior iterative.
Figure 4. Comparison event-relative response among group.
4.
DISCUSSIONS
Bayesian takes directly inference combining prior and observed data to obtain posterior probability distribution of parameters. Naturally it shows the stability based on covariance components. Therefore, we estimate parameters by the two methods as priors and through Bayesian’s rule to compute group mean and covariance. The events use the same blocks design to simply linear equation relation between HRF and observed data for group analysis. For Bayesian mapping, posterior inference using PPMs may represent a relatively more powerful approach than classical inference in neuroimaging, without adjusting the p values [Ash03]. Both of methods of Bayesian and classical inference are applied threshold to obtain the PPMs. Most methods based on Bayesian posterior probability to estimate parameters [Mar12]. These computation methods for parameters and hyperparameters estimation mainly focus on accuracy and speed [Neu03].
Some use fully Bayesian by session level, subject level and group level to estimate parameters of interest, contrasts of regression parameters with noninformative as prior that can be obtained more precise results passing summary statistics through different levels [Woo04]. Some show short time to compute parameters estimation process by using Bayesian inference to estimate group analysis and maybe extend number of subjects in group in a short. Nevertheless, Bayesian framework provides much better characteristics of single-subject responses, both in terms of the estimated effects and the nature of the inference [Ash03]. The probability that activation has occurredat any particular voxel is the same, irrespective of whether one has been analyzed that voxel or the entire brain. Based on the above points, we can do some likely “pre-analysis” to
construct multilevel for individual subjects and group by their variances. In [Ade11], it uses a two-stage empirical Bayes prior approach to relate voxel regression equations through correlations between the regression coefficient vectors. Furthermore, in [Dub08], it combines whole-brain voxel-by-voxel modeling and ROI analyses within a unified framework. In [Lei09], presents the idea of activation centers and model the inter-subject variability in activation locations directly. And also its model is specified in a Bayesian hierarchical frame work to draw inferences at all levels: the population level, the individual level and the voxel level.
5.
CONCLUSIONS
Due to these sessions in one subject similar each other, we can use batch processing to individual subjects to compare variances and choose the smallest variance effects as prior. Through the prior chosen, we compute other subjects’ posterior to reinforce the effects. With the same principle, we use one subject effects selected in group to be prior for other subjects in the same group. Especially for clinical diseases of brain, we can supply some learning methods to generalize priors from other patients’ features as rules to infer posterior as signs for physicians. Therefore, we can further develop for Bayesian learning for diseases in brain.
Any approach to variance estimation (or combination of approaches) can easily be combined with the multilevel GLM to provide a practical multilevel method [Bec03]. Bayesian approaches present the significant effects by combination hierarchical model with posterior probability. Due to the reason, we can set prior as multiple levels by pair subjects in group analysis to increase computational speed and more precise effects. No matter, Bayesian has a long way to explore fMRI data analysis, e.g., Bayesian model
selection [Roa10, Fri11], combining with MEG/EEG [Hen10], for structural brain network [Hin13], especially for free energy brain [Fri12]. Furthermore, Bayesian would be served more for brain science.
6.
ACKNOWLEDGMENTS
Sponsored by Heilongjiang Province Natural Fund (F201234) and Science and Technology Research Project in Heilongjiang Province Department of Education (12521431) and CSC of China. The authors contributed equally to this work.
7.
REFERENCES
[Ade11] Adelino R. Ferreira da Silva. A Bayesian multilevel model for fMRI data analysis. Computer methods and programs in biomedicine, 102, pp.238– 252, 2011.
[Ash03] Ashburner, J., Friston, K.J., and Penny, W. Human Brain Function, 2nd edition. Academic Press, 2003. [Bec03] Beckmann, Christian F., Jenkinson, Mark and
Smith, Stephen M. General multilevel linear modeling for group analysis in FMRI. NeuroImage, 20, pp.1052– 1063, 2003.
[Box92] Box, G.E.P., Tiao, G.C. Bayesian Inference in Statistical Analysis. Wiley, New York, 1992.
[Bra96] Bradley P. Carlin. Bayes and empirical bayes methods for data analysis. A CRC Press Company Boca Raton London New York Washington, D.C,1996. [Cam11] Camille G´omez-Laberge, Andy Adler, Ian Cameron, Thanh Nguyen, and Matthew J. Hogan. A Bayesian Hierarchical Correlation Model for fMRI Cluster Analysis. IEEE Transactions on Biomedical Engineering, 58, No. 7, pp.1967-1976, 2011.
[Dub08] Dubois, F. Bowman, Brian Caffo, Susan Spear Bassett, Clinton Kilts. A Bayesian hierarchical framework for spatial modeling of fMRI data. NeuroImage, 39, pp.146–156, 2008.
[Fri02a] Friston, K.J., Penny, W., Phillips, C., Kiebel, S., Hinton, G., and Ashburner, J. Classical and Bayesian inference in neuroimaging: Theory. NeuroImage, 16, pp.465–483, 2002.
[Fri02b] Friston, K.J., Glaser, D.E., Henson, R.N., Kiebel, S., Phillips, C., Ashburner, J.. Classical and Bayesian inference in neuroimaging: applications. NeuroImage, 16, pp.484–512, 2002.
[Fri03] Friston, K., Penny, W. Posterior probability maps and SPMs. NeuroImage, 19, pp.1240–1249, 2003. [Fri05] Friston, Karl J. Models of braib function in
neuroimaging. Annu. Rev. Psychol, 56, p.p57–87, 2005. [Fri11] Friston, Karl, Penny, Will. Post hoc Bayesian
model selection. NeuroImage, 56, pp.2089–2099, 2011. [Fri12] Friston, Karl. The history of the future of the Bayesian brain. NeuroImage, 62, pp.1230–1233, 2012. [Geo85] George Casella. An Introduction to Empirical
Bayes Data Analysis. The American Statistician, 39, No. 2, pp.83-87, 1985.
[Hen10] Henson, Richard N., Flandin, Guillaume, Friston, Karl J., Mattout, Je′re′mie. A Parametric Empirical
Bayesian Framework for fMRI-Constrained MEG/EEG Source Reconstruction. Human Brain Mapping, 31, pp.1512–1531, 2010.
[Hin13] Hinne, Max, Heskes, Beckmann, Tom, Christian F. Marcel A.J. van Gerven, Bayesian inference of structural brain networks. NeuroImage, 66, pp.543–552, 2013.
[Kai09] Kaiming Li, Lei Guo, Jingxin Nie, Gang Li, Tianming Liu. Review of methods for functional brain connectivity detection using fMRI. Computerized Medical Imaging and Graphics, 33, pp.131–139, 2009. [Lei09] Lei Xu, Timothy D. Johnson, Thomas E. Nichols
and Derek E. Nee. Modeling inter-subject variability in fMRI activation location: A Bayesian hierarchical spatial model. Biometrics, 65(4), pp.1041–1051, 2009. [Lin08] Lindquist Martin A. The Statistical Analysis of
fMRI Data. Statistical Science, 23, No. 4, pp.439–464, 2008. (161)
[Mar12] Mark W. Woolrich, Bayesian inference in FMRI, NeuroImage, 62, pp.801–810, 2012.
[Moh07] Mohamed A. Mohamed, Fatma Abou-Chadi, and Bassem K.Ouda. Analysis of fMRI Data Using Classical and Bayesian Approaches: A Comparative Study. IFMBE Proceedings, 14, No. 2, pp.924-931, Track 2007.
[Mor83] Morris, Carl N.. Parametric Empirical Bayes Inference: Theory and Applications. Journal of the American Statistical Association, 78, No. 381,pp. 47-55, 1983.
[Neu03] Neumann, Jane and Lohmann, Gabriele. Bayesian second-level analysis of functional magnetic resonance images. NeuroImage, 20, pp.1346–1355, 2003. [Pen03] Penny, W., Kiebel, S., Friston, K. Variational
Bayesian inference for fMRI time series. NeuroImage, 19 (3), pp.727–741, 2003.
[Pen05] Penny, William D., Trujillo-Barreto, Nelson J. and Friston, Karl J. Bayesian fMRI time series analysis with spatial priors. NeuroImage, 24, pp.350– 362, 2005. [Roa10] Rosa M.J., Bestmann,S., L. Harrison c, Penny, W.
Bayesian model selection maps for group studies. NeuroImage, 49, pp.217–224, 2010.
[San12] Sanya, Nilotpal, Ferreira, Marco A.R. Bayesian hierarchical multi-subject multiscale analysis of functional MRI data. NeuroImage, 63, pp.1519-1531, 2012.
[Smi04] Smith, S M, DPhil, MA. Overview of fMRI analysis, The British Journal of Radiology, 77, pp.167– 175, 2004.(181)
[Woo04] Woolrich, Mark W., Timothy E.J. Behrens, Beckmann, Christian F., Jenkinson, Mark and Stephen M. Smith. Multilevel linear modelling for FMRI group analysis using Bayesian inference. NeuroImage, 21, pp.1732– 1747, 2004.
[Woo11] Ahn, Adam Krawitz, Woojae Kim, Jerome R. Busemeyer, and Joshua W. Brown. A Model-Based fMRI Analysis With Hierarchical Bayesian Parameter Estimation. Journal of Neuroscience, Psychology, and Economics, 4, No. 2, pp.95–110, 2011.