D
EPARTMENT OF
E
CONOMICS
H
OUSEHOLD
-
LEVEL
C
REDIT
C
ONSTRAINTS
IN
U
RBAN
E
THIOPIA
Gamal Ibrahim, Nottingham Trent University, UK
Abbi Kedir, University of Leicester, UK
Sebastián Torres, University of Leicester, UK
Working Paper No. 07/03
March 2007
Household-level Credit Constraints in Urban Ethiopia
Gamal Ibrahim∗
Nottingham Business School, Nottingham Trent University, UK
Abbi Kedir
Department of Economics, University of Leicester, UK
Sebastián Torres
Department of Economics, School of Oriental and African Studies, University of London Nottingham Business School, Nottingham Trent University, UK
Corresponding Author: Dr. Gamal Ibrahim,
Nottingham Business School, Nottingham Trent University Burton Street,
Nottingham, United Kingdom,
Telephone Number: 00441158482433
Household-level Credit Constraints in Urban Ethiopia
Abstract
Empirical evidence on determinants of credit constraints and the amount borrowed by urban household in Sub-Saharan Africa is almost non-existent. Using an extended direct approach by virtue of the unique data set we have (the Fourth Round Ethiopian Urban Household Survey), we analysed the determinants of credit constraints and the amount borrowed by urban households. We find a high percentage of credit-constrained households, the majority of which constitute discouraged borrowers. Discrete choice models that control for potential endogeneity and selectivity bias have been fitted to our data. Our analysis shows current household resources, number of dependants, and location as significant correlates.
Keywords: credit constrained households; credit rationing; endogeneity; instrumental variables; urban Ethiopia; Africa
JEL Classification: D12; O12; O55
1. INTRODUCTION
Credit constraints are well documented in the literature. The main reasons are:
imperfect information and adverse selection effects that are strong enough to push
some households out of capital markets (Hoff and Stiglitz, 1993; Stiglitz and Weiss,
1981; Braverman and Guasch, 1993; Aryeety and Udry, 1997); high transaction costs
in obtaining credit, or risk rationing imposed by borrowers unwilling to lose their
collateral (Boucher et al., 2005).
poverty reduction. Credit constraints reduce the capacity to smooth consumption in
the face of idiosyncratic and/or covariate risks (Udry, 1991; Eswaran and Kotwal,
1990; Zeldes, 1989) and deter investment in children’s health and education (Becker
and Tomes, 1986; Foster, 1995). Credit constraints would also reduce the availability
of financial resources which can be used to buy inputs, finance business start ups and
hence reduce poverty. In the specific context of Ethiopia, provision of credit for the
poor can complement existing reform packages to pro-poor growth (Dercon and
Krishnan, 2001; Kedir, 1999).
A good understanding of the determinants of households’ access to credit is an
integral part of poverty reduction efforts in poor countries (Mosley, 1999; Matin, et al., 2002; Amin et al., 2003). However, rigorous examinations have been hampered by
the absence of household-level data that enables researchers to identify
credit-constrained households. There is also yet little information, particularly in urban areas
on the characteristics of the households who are likely to be constrained and the
extent of credit rationing in the formal sector. This study is motivated by the lack of
studies based on survey data collected from urban households in Africa that directly
test the presence of credit constraints1. Most studies focus on rural credit markets in
Asia especially in India (Pal, 2002; Kochar, 1997; Bell, et al., 1997). Empirical
specification of households’ credit constraints is pertinent as the welfare of
households can be better examined if those who are credit constrained can be
identified.
The remainder of the study is organized as follows. Section 2 discusses some
of identifying credit-constrained households in section 3. Section 4 gives a description
of the data and our definition of credit constrained households. Section 5 gives insight
into the structure of credit markets in urban Ethiopia. Section 6 presents and discusses
our econometric evidence. Finally, we forward concluding remarks and highlight
some policy implications of our results.
2. CREDIT CONSTRAINTS IN LOW INCOME COUNTRIES
The most influential model of the demand for household credit is the
permanent/life-cycle model of consumption (Friedman, 1957). The model assumes the presence of
perfect capital markets. An implicit assumption of this neo-classical model is that
institutions (economic and political) do not matter (North, 1993), even though they
determine the structure and costs of human interaction. In developing countries,
especially low-income countries such as Ethiopia, markets are characterised by
institutional rigidities that deny the sustainability of the neo-classical assumptions of
well functioning markets, perfect competition and mobility of factors of production.
With institutions playing a critical factor in determining the performance of
economies, it is perhaps no surprise that savings and credit have played the role of
coping mechanisms in times of income loss and in situations where the state is too
weak to implement effective labour market policies. After more than a decade of
neo-liberal reform with the assistance of the IMF to bring about well functioning labour
markets, employment creation in Ethiopia was negative (De Gobbi, 2006).
ubiquitous information asymmetry and weak mechanisms to enforce formal contracts.
The main coping mechanism for poor households is informal networks, which act as
risk sharing mechanisms (Cox and Fafchamps, 2007). Households are more likely to
receive gifts from close relatives such as parents, spouses children and loans from
more distant relatives (in-laws, uncles and aunts). Krishnan and Sciubba (2004)
highlight the significant role played by extended family and kinship relationships in
pooling labor in Rural Ethiopia.
A number of studies have analyzed the issue of credit constraints at the household
level and its impact on welfare outcomes such as income, consumption, nutrition and
agricultural productivity (Diagne, 1999). This study focuses on determining which
types of households have encountered difficulties in obtaining credit and their
characteristics as well as the determinants of the likelihood of being rationed out of
the credit market and the volume of loan accessed by households. This can be a useful
guide to policy makers as to where targetingis needed to remove constraints. In other
words, determining which households are credit constrained could increase the
effectiveness of credit programs for the poor (Barham et al., 1996; Carter and Olinto,
2003).
3. EMPIRICAL APPROACHES TO IDENTIFY CREDIT-CONSTRAINED HOUSEHOLDS
Empirical studies aiming to identify credit constrained households are based on two
major approaches. Most of the studies follow an indirect approach based on the
cycle/permanent income hypothesis (Hall, 1978; Hall and Mishkin, 1982; Hayashi,
1985; Zeldes, 1989; Diagne et al, 2000). It is assumed that, with standard convex
preferences, and in the absence of liquidity and borrowing constraints, transitory
income shocks should not affect consumption (Diagne et al., 2000; Zeldes, 1989).
These indirect tests could result in imprecise estimates of the effects of credit
constraints. Also, uncertainty can induce precautionary behavior and a dependence of
consumption on transitory income even in the absence of credit constraints.
The second approach is a direct one, which exploits information about the status of
loan applications of households (see Feder et al., 1989; and Jappelli, 1990). Feder et
al’s survey of China asks households whether at the going interest rate they would
have liked to borrow more institutional credit3 than they were granted.
Non-borrowing households were asked about their reason for not Non-borrowing. If it was not
due to sufficient credit, but due to inability to obtain credit, then this group was
classified as constrained4. This method was also used by Barham et al (1996).
Households were asked whether they have applied for credit; if so, whether their
application was rejected; and if it was approved, whether they have obtained the full
amount that they requested. Feder et al. (1989) found that defining credit-constrained
households this way was compatible with data on the overall liquidity of the
households. However, using this method of determining whether households are
credit-constrained also requires collecting information on households that did not
apply for credit. This point is analogous to the argument for including discouraged
Jappelli (1990) identifies credit constrained consumers as those who had their request
for credit rejected by financial institutions. A household will be credit constrained if:
D r A Y
C* − − (1+ )> (1)
where * is optimal consumption, Y (income) and
C A (nonhuman wealth) are the
resources available to each consumer, r is the real interest rate and is the amount that the consumer can borrow.
D
As can be seen from Equation (1), both supply side and demand side factors are at
play and will jointly determine whether the consumer is credit constrained: on the left
hand side the difference between his optimal consumption and his overall wealth and
on the right hand side the number of financial institutions (formal and informal) that
can provide credit.
Jappelli (1990) also identifies households who are discouraged from taking a loan as
credit constrained. The discouraged are those who answered “yes” to the question:
“Was there any time in the past few years that you (or your husband/wife) thought of
applying for credit at a particular place but changed your mind because you thought you might be turned down?” In general terms, and after considering both demand and
supply factors, a household will be credit constrained if its demand for credit is higher
than the available credit supply. Some of the variables that will determine the extent
of the binding constraint are: (i) households’ current resources, (ii) proxies for future
institutional constraints.
Based on surveys conducted in Malawi and Bangladesh, Diagne (1999) and Diagne
(et al., 2000) argue that the direct approach that classifies households into discrete
groups fails to measure the extent of the credit constraints faced by households. This
line of research stresses the importance of the data collection methodology that
identifies a credit limit variable – the maximum that the lender is willing to lend. This
limit is not the maximum the lender is able to lend to any borrower. The borrower is
not constrained if the optimal amount desired by her/him is less than the amount that
can be borrowed5.
Other tests of credit constraints have been conducted in the context of the analysis of
consumption. Since the theory of the optimization of consumption over time says that
household consumption is constrained only by its lifetime budget constraint, if true,
this means that households’ propensity to increase consumption is less if they receive
a temporary increase in income than if they receive a permanent increase in income.
However, empirical studies have shown that consumption is more sensitive to
temporary income changes than this theory would suggest, perhaps because
households suffer from credit constraints.
Zeldes (1989) explicitly used Euler equations (as first done by Hall 1978) to test the
hypothesis that households maximize their lifetime utility subject to credit constraints.
He proceeds by specifying a model and split the sampled households in advance into
However, some authors have argued that if households are credit-constrained, they
may change their consumption without violating the Euler equations, thus weakening
the usefulness of such tests (Deaton, 1992).
This paper follows a direct approach to identify credit-constrained households in
urban Ethiopia. We extend the definition of credit constrained households adopted by
Jappelli (1990) by taking into account households who have applied for loan but
received an amount which is less than what they have applied for. Our extended
definition allows us to provide a more comprehensive measure of credit constraints
which includes self-imposed rationing resulting from high default risk. After
establishing the extent of rationing in the formal sector, we examine the
characteristics of the households who are likely to be constrained and identify the
factors that affect the probability of being credit constrained and the volume of loan
amount demanded by households. The results of our paper would contribute to the
existing survey-based quantitative and direct evidence on households’ access to credit
in developing countries.
4. DATA AND AN EXTENDED DEFINITION OF CREDIT-CONSTRAINED HOUSEHOLDS
The analysis in this study is based on the fourth round socio-economic survey of
urban households in Ethiopia (EUHS, 2000) which has been collected by the
Department of Economics of Addis Ababa University in collaboration with the
Department of Economics of the University of Goteborg, Sweden. The survey
urban households. It included modules on household demographics including
education, credit, rural-urban migration, employment and income, consumption,
ownership of durables, housing, health, welfare and welfare change indicators.
A sample of 1500 households was selected from seven major urban centres of the
country. The total sample size was distributed over the selected urban centres
proportional to their populations, based on the CSA’s (Central Statistical Authority)
1992 projections. Accordingly, the sample included 900 households in Addis Ababa
(the capital city), 125 in Dire Dawa, 75 in Awassa, and 100 in each of the other four
towns.
Due to a unique nature of our survey information, we identified three categories of
credit constrained households. The first category of constrained households is defined
as those households that report a positive response to the following question: “During
the last 12 months, did any member of your household apply for a loan and was the loan completely rejected?” In addition, our data consists of information on two more
other categories of households. The first category of households consists of
households that have applied for a loan and who reported less than 100 percent as the
loan percentage approved. These households are credit-constrained because they
applied for a loan but got a loan amount less than the amount they applied for. The
third category of constrained households is what we classify as ‘discouraged
borrowers’. Our data asks households to supply their reasons if they failed to apply
for a loan in the last 12 months. For instance, households have cited many reasons
such as ‘we will not have any chance of success’, ‘loan application takes long time to
households that give the above reasons among credit-constrained households. Our
extended direct approach enabled us to provide a more complete definition of credit
constrained households unlike previous studies (Diagne et al., 2000; Jappelli, 1990).
In the next section, we discuss some of the characteristics of credit markets in urban
areas in Ethiopia.
5. MAIN FEATURES OF THE CREDIT MARKET IN URBAN ETHIOPIA
This sectionexplores the structure of credit markets in urban Ethiopia in detail. One
of the main observable features of credit markets in developing countries is the
presence of segmented and well-defined formal and informal financial institutions
(Aryeetey and Udry, 1997; Bell, 1993; Basu, 1983). The formal sector consists of
commercial banks while the informal sector includes microfinance institutions6,
indigenous credit sources such as landlords, rotating savings and credit associations
(ROSCAs), money lenders, trade creditors and family and friends.
The degree to which these sectors are affected by adverse selection, moral hazard and
enforcement problem determines the nature of the transactions between lenders and
potential borrowers. The discussion below highlights the main feature of the urban
credit market in Ethiopia.
Sources of loans
The information on sources of loans reveals the importance of the informal sector.
informal and semi-formal sectors while 21% of loans were obtained from the formal
sector. The most predominant source within the informal sector is ‘friends and
relatives’ (75%). Not a great proportion of loans originate from group schemes such
as ROSCAs. This is not surprising because Ethiopian ROSCAs are primarily formed
as vehicles of saving mobilization rather than credit institutions. It is interesting to
note that there are few loans obtained from moneylenders who are dominant lenders
elsewhere such as India and Thailand (Bell, 1993). In the formal sector, the
microfinance institutions play the dominant role in lending (45%) while banks and the
government provide very few loans.
[Table 1 about here]
Duration of loans
Almost half of the households that reported taking out loans did not report the due
date of their loans. For those we observe valid responses, most of the loans are
short-term loans. For instance, 96 percent of the loans have to be repaid within one year. A
further examination of the data reveals that most of the short-term loans have
originated from informal lender. Therefore, there is a strong link between the source
and duration of the loan – a link that might extend to the purpose for which the loan
amount is used.
Who has a preferential access to different sources of loans?
access to various sources of loans. According to table 2 below, on the aggregate, both
types of households have almost equal access to credit; the number of male headed
households that accessed loans being slightly less than that of female-headed
households. 55 percent of the individuals who accessed formal loans are females as
opposed to 51 percent in the case of informal loans. While friends and relatives give
more loans to males, institutions such as micro-finance institutions give more loans to
females. The high participation by women in informal networks is consistent with
other studies in Africa, which show that women, especially married women use
informal networks to protect their earnings against claims by their husbands (Hogset,
2005).
[Table 2 about here]
Lending and borrowing behavior
There are very few households that have a bank account (only 16% of them),
indicating little use of formal institutions for borrowing and/or saving purposes. This
is interesting, given that our survey information is collected from the seven major
urban areas in Ethiopia. This indicates the acute lack of financial depth even in the
major urban centers of the country.
Uses of loans from each source
Households took loans both for consumption7 and productive purposes. The two
setting up businesses (27.6%). Other important reasons include payment of utilities
and related expenses (13.8%), financing health, education and transport expenses
(13.4%) and purchase of consumer durables (11.0%). Very few households took out a
loan to build a house (5.7%). Unlike the findings for rural credit markets,
consumption finance is the main reason for borrowing in urban Ethiopia (Gill and
Singh, 1997; Swaminathan, 1991; Timberg and Aiyar, 1984).
In an attempt to uncover whether there is any systematic relationship between purpose
and source of loans, we found that friends and relatives provide loans practically for
all purposes. This confirms the fact that informal agencies ensure a lower probability
of default given a better knowledge of their clients and do not suffer from severe
adverse selection, moral hazard and enforcement problems as formal credit
institutions (Basu, 1983). After friends and relatives however, credit associations and
microfinance institutions are the next largest lenders, and tend to lend for various
purposes.
However, formal sources such as banks do not fund consumption but provide loans
for business start ups/expansion suggesting a certain degree of segmentation. This
indicates quite a high degree of exclusiveness of loans from the various sectors which
results from asymmetric information limiting the extent to which formal lenders can
monitor borrower activities, hence excluding borrowers from formal sector loans
(Hoff and Stiglitz, 1990).
Apart from the interest rates charged, there are no data on any other conditions
imposed on loans by lenders such as interlinkages of contracts with other markets.
The minimum rate was 0% while the maximum was 20%, with 33% of loans being
interest free. The presence of extreme variability in the interest rate charged by
lenders within an economy is one of the salient features of credit markets in
developing countries (Banerjee, 2001; Fafchamps, 2000). The mean interest rate is
only 3.1%. We argue that this is not due to the fact that a proportion of the population
surveyed is significantly Islamic9 because Muslims constitute only 13.3% of all the
households interviewed. Hence the underlying reason for low use of interest rates
could be explained if we link interest rates with sources of loan. As expected, friends
and relatives lend without requiring interest payments. In addition, employers, credit
associations and even NGO/Government too give a small number of interest free
loans. Therefore, not all formal sector loans are interest bearing and not all of the
loans obtained from friends and relations are interest free. For instance, micro-finance
institutions, banks and credit associations tend to charge interest across the whole
range of rates while there is one case of friends or relatives charging the highest rate
of 20%. Most of the rates provided by micro-finance institutions are small which is
consistent with the rates common in group lending schemes. The nature of interest
rates seems to indicate that credit markets in urban Ethiopia are likely to be
characterized by low interest rates as far as the informal lenders go, however the
consideration of default risk by these lenders is not altogether absent (Basu, 1983).
This is in sharp contrast to the extensive literature on dominance of exploitative
informal moneylenders in credit markets of less developed economies. Our finding
does not also support the rationing hypothesis which is based on the assumption that
Loan amount and Household Characteristics
Households are asked to report the loan amount they borrowed both in cash and in
kind. The loan component reported in-kind has been converted into cash equivalents
during the interview. The average annual loan amount of all households is 223 birr10
with a maximum of 50,000 birr. The majority of households borrowed an amount less
than 10,000 birr. To investigate some interesting relationships, we linked the loan
amount borrowed with household characteristics. Table 3 shows summary statistics of
total loan amount by household characteristics. There seems to be little gender bias
again, as females receive only slightly less of the mean total loan amount (213 birr)
than males (230 birr). Total loan is found to be increasing in household size, but for
very large households, this loan amount falls. For the ethnic groups Gurage and
especially Tigre, there appears to be a significantly larger mean of the total loan
granted as compared to the other ethnic groups. Household with Protestant heads also
received higher mean loan amount than other households.
[Table 3 about here]
Constrained households
Credit-constrained households in this study are defined according to the details given
in section 3 above. Table 4 gives the number of constrained households. 293
households have applied for a loan and supplied their reasons for borrowing. 17 of
are excluded from the sample. Out of the original sample, 1179 did not apply for a
loan and reported various factors that deter them from applying. The results show the
presence of a high percentage of credit-constrained households in urban Ethiopia
(26.6%).
[Table 4 about here]
It is evident that the discouraged constitute the highest proportion of the
credit-constrained households. This is not surprising because the banking sector in Ethiopia
is dominated by bureaucratisation and buck-passing (Banerjee and Duflo, 2001). The
two major reasons for discouragement are households’ perception of the success
probability of their loan application and lack of collateral. For instance, 47.9% of the
discouraged borrowers did not apply because they believed they would not be
successful while 32.8% of them did not apply because they did not have collateral.
The interest rate (13%) and loan processing time (5.42%) were also mentioned as
deterrents to applying.
6. ECONOMETRIC EVIDENCE
In this section, we present the results from various discrete choice and
discrete-continuous models. The first one is a conventional probit model to predict the
probability of being credit constrained (say P). However, one important empirical
issue is the potential endogeneity of the household expenditure variable which is
entered as a right hand side variable in the probit model predicting the probability of
credit constrained. Therefore, we carried out maximum likelihood estimation of
as IV (instrumental variables) probit estimation to control for the endogeneity
associated with the household expenditure variable (see Newey, 1987). Our
instrument is the income variable which is strongly correlated with the potential
endogenous expenditure variable11. Finally, in order to study the determinants of the
loan amount demanded/received by households respectively we estimated two
additional models: a tobit and a instrumental variables tobit model.
The empirical modeling of the determinants of access to credit or probability of credit
constraint can be handled by estimating a probit model due to the binary nature of the
dependent variable. Assume an underlying latent response variable which is
defined by; * i y i i i x y* =β' +μ . (2)
In practice, we do not observe but a dummy dependent variable y which takes a
value of either 0 or 1. In the present context, a value of 1 is assigned to
credit-constrained households and zero otherwise. represents a vector of household
characteristics and the
* i y i x i
μ is the error term which is normally distributed with zero mean and constant variance. In the IV probit context, equation (2) can be specified as
i ei i
i y x
y* =γ' +β' +μ (3)
Where is the variable that is potentially endogenous (i.e. total household
expenditure) – the variable we suspect to have a non-zero correlation with the error
term; our exogenous variables,
i
y
ei
Our independent variables (x) are grouped into four groups: (i) proxies for current resources such as total household expenditure and the value of household assets, (ii) proxies for expected future income such as years of schooling, (iii) demographic variables and (iv) regional variables and squared and interaction terms. It is important to note that these variables can reflect both determinants of demand for
credit and determinants of supply of credit. Hence in some cases the effects of the
independent variables on the probability of being credit constrained may be a priori
ambiguous as demand and supply factors may be working in the same direction. The
conventional probit model estimates and the instrumental variables probit estimates
are presented in Table 5.
The most striking feature of our empirical results is that, as in Jappelli (1990), richer
households (broadly measured by a household’s level of expenditure) have a lower
probability of being rationed out of the credit market. The presence of both a
significant positive effect of the level of expenditure and a negative coefficient in the
quadratic term indicate the presence of non-linear effects on the probability of being
credit constrained. While at lower levels of expenditure (proxy for income) the
probability of being constrained increases (as the household increases its consumption
and its demand for credit) richer households are, as expected, less likely to be credit
constrained.
While the coefficient of the value of households’ assets has the expected negative sign
and is significant at the 5% level, its impact on the probability of being credit
constrained is rather small (close to zero). Expected future income, measured by the
probability of being credit constrained. The negative coefficient on education could
have suggested that it is supply side (rather than demand) considerations that act to
relax the credit constraint. These results indicate that lenders use both current and
future expected income as important criteria for judging creditworthiness of a
borrower.
To further investigate this issue we now focus on the impact of the squared and
interaction terms for expenditure, wealth and some demographic variables. The results
indicate that households with dependent children between the age of 6 and 15 and that
live in the capital city and Bahar Dar, Dessie, Dire and Jimma are more likely to be
credit constrained. The presence of more dependants in a given household may
discourage lenders from lending because it has direct implication in terms of earning
capacity, as well as causing higher desired consumption by borrowers thereby
tightening the credit constraint. Household size, age and its square term do not feature
as significant determinants of P. However, these are household characteristics that
other studies have found to be highly significant (e.g. Zeller, 1994). Marital status and
gender dummies were also found to be insignificant, the latter implying no gender
bias and confirming our findings in the previous section. Location matters in
accessing loanable funds in urban Ethiopia. Relative to Mekele, households in Addis
Ababa, Bahar Dar, Dessie, Dire and Jimma are more likely to be credit constrained
suggesting the presence of regional variations in the ways credit markets function in
the country.
In this study, we also investigated the factors affecting the volume of loan accessed by
households. To allow for the censored nature of the dependent variable, we have
estimated a tobit model assuming a correlation between the unobservables affecting
households decision to borrow with their decision on how much to borrow. Since the
model of determinants of the volume of loan amount can be perceived as a model of
credit demand, it is not reasonable to exclude households with zero loan amounts. The
tobit model handles the potential selectivity bias that arises due to the non-random
choice of borrowing households. In addition, both the tobit and the IV tobit models
are chosen over other possible stage estimations techniques (e.g. Heckman
two-stage selection model) due to a lack of any theoretical guide as to the choice of
appropriate identifying restrictions at the second stage of the estimation.
The IV tobit model to estimate is defined by:
⎪ ⎩ ⎪ ⎨ ⎧ > = otherwise y if y y i i i 0 0 * * (4) (5) i i i ei i i y x z y* = β+ γ +μ = δ +μ
Where denotes the dependent variable (i.e. loan amount), is the variable that is
potentially endogenous (i.e. total household expenditure), and the rest of the variables
are as defined earlier. The estimated parameters of both standard tobit and IV tobit
models (i.e. marginal effects) are reported in table 6.
*
i
While it can be of use to analyze the determinants of loan amount from the borrower’s
perspective, thereby reflecting behavior on the demand side of the credit market, the
variables collected here are those determinants likely to be used from the lender’s
perspective to screen borrowers. Given this, the econometric analysis allows us to see
the extent of rationing that occurs once the lender has decided to lend.
The explanatory variables in the tobit model represent determinants of rationing
mostly on the supply side of the market. The expected signs differ this time, for
example, total loan amount is likely to be increasing in current income/expenditure.
While demand side influences may be simultaneously at play, their relative
importance as compared to supply side influences would depend on the relative
bargaining power of borrowers and lenders. However, the main influence on the total
loan amount granted is likely to be the degree to which the lender expects the
borrower to repay/default.
[Table 6 about here]
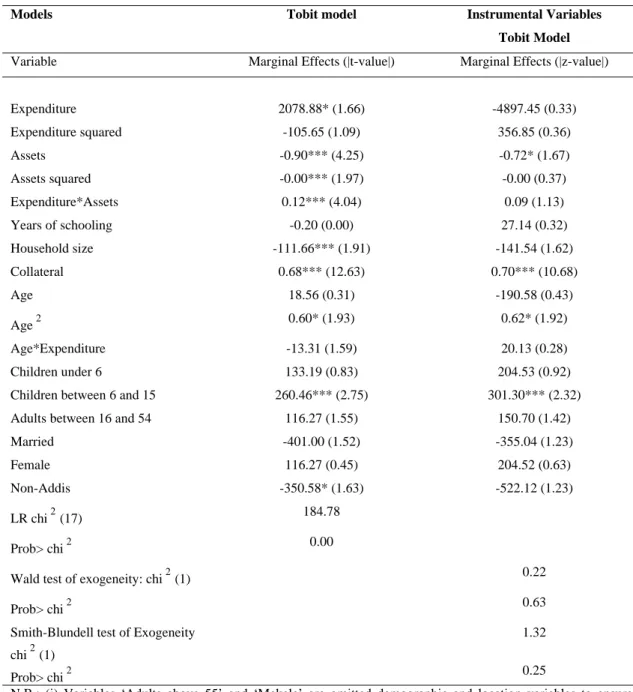
From table 6, it is evident that current resources (measured by both household
expenditure and the interaction term expenditure*assets), the value of collateral, and
the presence of number of children aged between 6 and 15 are significant positive
factors in affecting the volume of loan households received. The positive effect of
households’ welfare position on the size of the loan is corroborated by evidence for
India (Gill and Singh, 1997). The estimation also reveals a significant quadratic
Except for the sign of the negative value of the assets coefficients, our results are
consistent with our a priori theoretical expectation about the loan amount supplied by
lenders. Also, due to the simultaneity of demand and supply factors, the marginally
significant negative marital status dummy can be an indication of the financial
stability of the household and its accompanied declining demand for loans.
The results reveal an absence of gender, ethnic and religious discrimination in loan
allocations. However, the negative “non-addis” coefficient suggests the presence of
discrimination in the volume of loan amounts received, in favor of the capital city.
This highlights the importance of credit as an integral part of any effective poverty
reduction strategy, which aims to combat uneven development in Ethiopia. As pointed
out in the recent activities related to Ethiopia’s Poverty Reduction Strategy Paper –
the Sustainable Development and Poverty Reduction Program (SDPRP)- credit
schemes that target the elderly in the capital city proved to be successful in reducing
old age poverty (Baleher and Yirsaw, 2003). Therefore, the provision of similar
schemes to other households in other regions can be an effective poverty reduction
strategy.
CONCLUSION
Our analysis reveals that credit markets are slightly segmented and that the informal
sector is not only the major source of loans in rural areas in Ethiopia as shown by
Krishnan and Sciubba (2004), but also dominates the urban areas. Most of the credit
constrained households are the discouraged. Hence the removal of barriers by
the absence of gender, ethnic and religious discrimination in loan allocations. The
significance of current household resources both in affecting credit access and the
volume of loan borrowed provides justification for government’s targeting of
economic exclusion.. The excluded have been identified in this paper as the poor,
uneducated and households with children.
Informal and semi-formal sectors provide a large proportion of loans. By exploiting
existing strong social ties policy targets may focus on financial linkages between
formal and informal sectors to enhance access to credit. Micro-finance institutions
have been shown to be reaching vulnerable/relatively poorer groups such as women.
However, as long as formal and informal institutions keep apart, far reaching
developmental processes are unlikely to happen. Traditional financial systems in
Africa usually undertake minimum intermediation and often specialize in either
deposit-taking or lending. Therefore, an integral aspect of targeted intervention should
include social inclusion programs to fill the vacuum, where informal networks fail.
REFERENCES
Akoten, J.E., Sawada, Y., and Otsoka, K. The Determinants of Credit Access and Its Impacts
on Micro and Small Enterprises: The Case of Garment Producers in Kenya. Economic
Development and Cultural Change 54, 2006: 927-944.
Amin, S., Rai, A.S., and Topa, G. Does Microcredit Reach the Poor and Vulnerable?
Aryeetey, E., and Udry, C. The Characteristics of Informal Financial Markets in Sub-Saharan
Africa. Journal of African Economies, Supplement to 6 (1), 1997: 161–203.
Baleher, A. and Yirsaw, F. ETHIOPIA, Country Position Paper, Ministry of Finance and
Economic Development, Addis Ababa, Ethiopia, 2003.
Banerjee, A., and Duflo, E. The Nature of Credit Constraints: Evidence from Indian Bank,
mimeo, Department of Economics, MIT, 2001.
Barham, B.P., Boucher, S., and Carter, M.R. Credit Constraints, Credit Unions, and
Small-Scale Producers in Guatemala. World Development 24(5), 1996: 793-806.
Basu, K. The Emergence of Isolation and Interlinkage in Rural Markets. Oxford Economic
Papers 35, 1983: 262-280.
Becker, G.S., and Tomes, N. Human Capital and the Rise and Fall of Families, Journal of
Labor Economics 4(3), 1986: 1-39.
Bell, C. Interactions between Institutional and Informal Credit Agencies in Rural India. In
The Economics of Rural Organization: Theory, Practice and Policy. Braverman, Hoff and
Stiglitz (eds.) World Bank, Washington D.C., 1993.
Bell, C., Srinivasan, N., and Udry, C. Rationing, spillover and Interlinking in Credit Markets:
the case of Rural Punjab. Oxford Economic Papers 49(4), 1997: 557-585.
Bigsten, A., Collier, P., Dercon, S., Fafchamps, M., Gauthier, B., Gunning, J.W., Oduro, A.,
Boucher, S., Carter, M.R., and Guirkinger, C. Risk Rationing and Activity Choice in Moral
Hazard Constrained Credit Markets. Staff Paper, Department of Agricultural and Applied
Economics, University of Wisconsin, September 2005.
Braverman, A., and Guasch, L. Administrative Failures in Rural Credit Programs. In The
Economics of Rural Organization. Braverman, Hoff and Stiglitz (eds.); World Bank,
Washington D.C., 1993.
Carter, M.R., and Olinto, P. Getting Institutions “Right” for Whom? Credit Constraints and
the Impact of Property Rights on the Quantity and Composition of Investment. American
Journal of Agricultural Economics 85(10), 2003: 173-86.
Cox, D., and Fafchamps, M. Extended Family and Kinship Networks: Economic Insights and
Evolutionary Directions. Handbook of Development Economics, Volume 4, 2007.
Crook, J.N., and Banasik, J. Does Reject Inference Improve the Performance of Application
Scoring Models? Journal of Banking and Finance 28, 2003: 857-74.
Deaton, A. Saving and Liquidity Constraints. Econometrica 59(5), 1991: 1221-48.
De Gobbi, M.S. Labour Markets Flexibility and Employment and Income Security in
Ethiopia: Alternative Considerations, International Labour Office, Employment
Strategy Papers, 2006/1, ILO, Geneva, 2006.
Dercon, S., and Krishnan, P. Poverty and survival strategies in Ethiopia during economic
Diagne, A. Determinants of Access to and Participation in Formal and Informal Credit
Markets in Malawi. International Food Policy Research Institute, FCND, Discussion Paper
No. 67, Washington D.C., 1999.
Diagne, A., Zeller, M., Sharma, M. Empirical Measurements of Households’ Access to Credit
and Credit Constraints in Developing Countries: Methodological Issues and Evidence. IFPRI,
FCND Discussion Paper No. 90, Washington D.C., 2000.
Eswaran, M., and Kotwal, A. The Implications of Credit Constraints for Risk Behaviour in
Less Developed Economies. Oxford Economic Papers 42 (2), 1990: 473-82.
Fafchamps, M. Ethnicity and Credit in African Manufacturing. Journal of Development
Economics 61, 2000: 205-35.
Feder, G., Lau, L., and LinLuo Xiaopeng, J.Y. Agricultural Credit and Farm Performance in
China. Journal of Comparative Economics 13(4), 1989: 1151-7.
Foster, A. D. Prices, Credit Markets and Child Growth in Low Income Rural Areas. The
Economic Journal 105, 1995: 551-70.
Friedman, M. The Permanent Income Hypothesis: Comment. American Economic Review 48,
1957: 990-1.
Gill, A., and Singh, U.C. Financial Sector Reforms, Rate of Interest and the Rural Credit
Markets: The role of Informal lenders in Punjab, Indian Journal of Applied Economics 6(4),
consumer behaviour? Evidence from Credit Card Data. Quarterly Journal of Economics 117,
2002: 149-85.
Hall, R. Stochastic Implications of the Life Cycle Permanent Income Hypothesis: Theory and
Evidence. Journal of Political Economy 86 (5), 1978: 971-87.
Hall, R., and Mishikin, F. The Sensitivity of Consumption to Transitory Income: Estimates
from Panel Data on Households. Econometrica 50(2), 1982: 461-82.
Hayashi, F. The Effect of Liquidity Constraints on Consumption: A Cross-sectional Analysis.
Quarterly Journal of Economics 100(1), 1985: 183-206.
Hoff, K., and Stiglitz, J. Imperfect Information and Rural Credit Markets: Puzzles and Policy
Perspectives. The World Bank Economic Review 4(3), 1990: 235-260.
Hogset, H. Social Exclusion and Insurance Failure for the Poorest: On Informal
Finance through Social Networks in Kenya's Smallholder Sector. Cornell University,
New York, 2005.
Jappelli, T. Who is Credit Constrained in the U.S Economy? Quarterly Journal of Economics
105(1), 1990: 219-234.
Kedir, A. Modeling Poverty and Its Determinants for Urban Ethiopia: The Multinomial Logit
Selection Model. Ethiopian Journal of Economics 6(2), 1999: 1-36.
Kochar, A. An Empirical Investigation of Rationing Constraints in Rural Credit Markets in
Krishnan, P., and Sciubba, E. Links and Architecture in Village Networks. Cambridge
Working Papers in Economics, no 462, University of Cambridge, UK, 2005.
Matin, I., Hulme, D., and Rutherford, S. Finance for the Poor: From Microcredit to
Microfinancial Services. Journal of International Development 14(2), 2002: 273-294.
Mosley, P. Micro-macro Linkages in Financial Markets: The Impact of Financial
Liberalisation on Access to Rural Credit in Four African Countries, Institute of Development
Policy and Management (IDPM), University of Manchester, UK, 1999.
Newey, W.K. Efficient estimation of limited dependent variable models with endogenous
explanatory variables. Journal of Econometrics 36, 1987: 231-50.
Pal, S. Household Sectoral Choice and Effective Demand for Rural Credit in India. Applied
Economics 34(14), 2002: 1743-55.
Smith, R.J., and Blundell, R.W. An Exogeneity Test for a Simultaneous Equation Tobit
Model with an Application to Labor Supply. Econometrica 54(3): 679-86.
Stiglitz, J., and Weiss, A. Credit Rationing and Markets with Imperfect Information.
American Economic Review 71(3), 1981: 393-410.
Swaminathan, M. Segmentation, Collateral Undervaluation, and the Rate of Interest in
Agrarian Credit Markets: Some Evidence from Two Villages in South India, Cambridge
Cultural Change 33(1), 1984: 43-59.
Udry, C. Credit Markets in Northern Nigeria: Credit as Insurance in a Rural Economy. World
Bank Economic Review 4(3), 1991: 251-69.
Zeldes, S. Consumption and Liquidity Constraints: An Empirical Investigation. Journal of
Political Economy 97(2), 1989: 305-46.
Zeller, M. Determinants of Credit Rationing: A Study of Informal Lenders and Formal Credit
Groups in Madagascar. World Development 22(12), 1994: 1895-1907.
Table 1: Source of Loans
Informal and Semi-formal Number of households (%)
Friends/relatives 186 (59.0)
Credit Association 40 (12.7)
Money Lender 10 (3.2)
Employer 9 (2.9)
Other informal (e.g. ROSCAs ) 5 (1.6)
Formal Micro-finance institutions 29 (9.2) Banks 10 (3.2) Government/NGOs 5 (1.6) Other formal 21 (6.7) Total 315 (100)
Table 2: Distribution of the number of males and females head of households by source of loan
Source of loan Male Female Total
Money lender 3 3 6 Friends/relative 40 37 77 Credit/association 9 14 23 Employer 2 2 4 Other informal 2 2 4 Banks 1 2 3 Government/NGOs 2 2 4 Micro-finance institutions 4 9 13 Other formal 6 3 9 Total 69 (48.25%) 74 (51.75%) 143
Source: Own-calculation from EUHS, 2000
Table 3: Total Loan Amount by Household Characteristics
Characteristics Mean Frequency (%)
Gender Male 230.25 832 Female 213.54 591 Household size 1 to 5 160.85 667 6 to 10 270.56 683 Greater than 10 191.87 73 Ethnic groups Amhara 197.37 732 Oromo 136.97 258 Gurage 265.62 162 Tigre 386.72 157 Religion Orthodox 213.04 1147 Catholic 66.92 13 Protestant 311.54 52 Muslim 220.89 180 Location Addis Ababa 99.28 445
Non- Addis Ababa 32.03 328
Table 4: Constrained Households
Type of households Number (%)
Discouraged households 332 (22.8)
Households with rejected applications 15 (1.0) Households that received a loan amount less than the
amount they applied for
41 (2.8)
Households with successful loan applications 220 (15.1)
Total 1455 (100)
Table 5: Probit models predicting the probability of being credit constrained
Models Probit model Instrumental Variables
Probit Model
Variable Marginal Effects
(|t-value|) Marginal Effects (|z-value|) Expenditure 0.262** (2.35) 4.987 (1.56) Expenditure squared -0.025*** (2.90) -0.351** (1.70) Assets -0.000** (2.27) -0.000*** (2.95) Assets squared -0.000 (0.64) -0.000 (1.51) Expenditure*Assets 0.000** (2.07) 0.000*** (2.52) Years of schooling -0.003 (0.43) -0.027 (1.07) Age 0.002 (0.34) 0.135 (1.32) Age squared 0.000 (0.27) 0.000 (0.10) Age*Expenditure -0.001 (0.66) -0.022 (1.38) Household size -0.003 (0.48) 0.007 (0.27) Children under 6 0.010 (0.52) -0.009 (0.14)
Children between 6 and 15 0.020* (1.78) 0.032 (0.67)
Adults between 16 and 54 -0.003 (0.29) -0.024 (0.029)
Married 0.020 (0.64) 0.026 (0.25) Female -0.018 (0.60) -0.105 (1.07) Addis 0.268*** (3.65) 0.843*** (2.42) Awassa 0.170 (1.26) 0.508 (1.58) Bahar Dar 0.381*** (3.07) 0.961*** (2.74) Dessie 0.425*** (3.53) 1.078*** (3.00) Dire 0.391*** (3.25) 1.180*** (4.04) Jimma 0.272*** (2.12) 0.715** (2.21) Number of observations 1384 1384 LR chi2(21) 80.28 Prob> chi2 0.0000
Wald test of exogeneity: chi2(1) 1.06
Prob> chi2 0.30
Smith-Blundell test of Exogeneity chi2(1)
1.02
Prob> chi2 0.31
N.B.: (i) Variables ‘Adults above 55’ and ‘Mekele’ are omitted demographic and location variables to ensure identification. (ii) *=Significant at the 10% level;**= Significant at the 5% level; and ***= Significant at the 1% level. (iii) In the Instrumental Variables specification the income variable is used to instrument for expenditure.
Table 6: Tobit models of loan amount received by households
Models Tobit model Instrumental Variables
Tobit Model
Variable Marginal Effects (|t-value|) Marginal Effects (|z-value|)
Expenditure 2078.88* (1.66) -4897.45 (0.33) Expenditure squared -105.65 (1.09) 356.85 (0.36) Assets -0.90*** (4.25) -0.72* (1.67) Assets squared -0.00*** (1.97) -0.00 (0.37) Expenditure*Assets 0.12*** (4.04) 0.09 (1.13) Years of schooling -0.20 (0.00) 27.14 (0.32) Household size -111.66*** (1.91) -141.54 (1.62) Collateral 0.68*** (12.63) 0.70*** (10.68) Age 18.56 (0.31) -190.58 (0.43) Age2 0.60* (1.93) 0.62* (1.92) Age*Expenditure -13.31 (1.59) 20.13 (0.28) Children under 6 133.19 (0.83) 204.53 (0.92)
Children between 6 and 15 260.46*** (2.75) 301.30*** (2.32)
Adults between 16 and 54 116.27 (1.55) 150.70 (1.42)
Married -401.00 (1.52) -355.04 (1.23)
Female 116.27 (0.45) 204.52 (0.63)
Non-Addis -350.58* (1.63) -522.12 (1.23)
LR chi2(17) 184.78
Prob> chi2 0.00
Wald test of exogeneity: chi2(1) 0.22
Prob> chi2 0.63
Smith-Blundell test of Exogeneity chi2(1)
1.32
Prob> chi2 0.25
N.B.: (i) Variables ‘Adults above 55’ and ‘Mekele’ are omitted demographic and location variables to ensure identification. (ii) *=Significant at the 10% level;**= Significant at the 5% level; and ***= Significant at the 1% level. (iii) In the Instrumental Variables specification the income variable is used to instrument for expenditure.
1
There are some studies that have investigated firm-level credit constraints in Africa (Fafchamps, 2000; Bigsten et al, 2003).
2
3
In this study, the share of formal credit in total volume of new credit is 66.5% during the study period. The bulk of credit granted that was not easily monitored/fungible was found to be from the formal sector (87%).
4
Feder et al. thus drop the crucial assumption made in previous studies in the literature, of homogenous credit demand and supply situations for borrowers and non-borrowers. The reason is that often non-borrowers do not borrow, not because they are not credit-worthy or cannot obtain credit, but because they have sufficient liquidity of their own. Furthermore, the liquidity position of unconstrained households as compared to constrained households is found to be much higher. This implies that surplus cash incomes for some households do exist. The reasonable assumption made, therefore, is that households should be analyzed in terms of whether they are credit-constrained or not.
5
There are downsides to this approach too, as the authors point out. The credit limit variable will not be totally accurate until all potential borrowers apply. Heteroskedasticity would also arise since individuals who are nearer their credit limit are more able to accurately predict their limit than those who are further away from their limits.
6
Although microfinance institutions (MFIs) are generally classified as informal, some of them are classified as ‘hybrids’ as they provide banking services as well (Akoten et al., 2006).
7
Consumption credit enables risk pooling among risk-averse households across time in an attempt to smooth consumption under uncertain income streams and thus plays the role of insurance (Eswaran and Kotwal, 1990).
8
In another paper, we are investigating the link between interest rates and credit demand in a similar framework advanced by Gross and Souleles (2002).
9
Udry (1991) shows this is a main feature of the workings of informal credit institutions in a Nigerian village.
10
Note that this average is computed by including households with zero loan amount. The birr is the Ethiopian currency; for instance, £1=13.20 birr or 1USD=8.50 birr.
11 In each case we report the tests for the validity of our instrument (Exogeneity test of the expenditure variable): Smith and