Worcester Polytechnic Institute
Digital WPI
Doctoral Dissertations (All Dissertations, All Years)
Electronic Theses and Dissertations
2015-09-15
Student Modeling within a Computer Tutor for
Mathematics: Using Bayesian Networks and
Tabling Methods
Yutao Wang
Worcester Polytechnic Institute
Follow this and additional works at:
https://digitalcommons.wpi.edu/etd-dissertations
This dissertation is brought to you for free and open access byDigital WPI. It has been accepted for inclusion in Doctoral Dissertations (All Dissertations, All Years) by an authorized administrator of Digital WPI. For more information, please [email protected].
Repository Citation
Wang, Y. (2015).Student Modeling within a Computer Tutor for Mathematics: Using Bayesian Networks and Tabling Methods. Retrieved fromhttps://digitalcommons.wpi.edu/etd-dissertations/383
Student Modeling within a Computer Tutor for Mathematics:
Using Bayesian Networks and Tabling Methods
by
Yutao Wang
A Dissertation
Submitted to the Faculty
of the
WORCESTER POLYTECHNIC INSTITUTE
in partial fulfillment of the requirements for the
Degree of Doctor of Philosophy
in
Computer Science
August 2015
APPROVED:
Professor Neil T. Heffernan
Advisor - WPI
Professor Ivon Arroyo
Committee Member - WPI
Professor Joseph E. Beck
Co-Advisor – WPI
Professor Ryan S.J.D. Baker
External Committee Member, Columbia
University
ii
Abstract
Intelligent tutoring systems rely on student modeling to understand student behavior. The result of student modeling can provide assessment for student knowledge, estimation of student‟s
current affective states (ie boredom, confusion, concentration, frustration, etc), prediction of
student performance, and suggestion of the next tutoring steps.
There are three focuses of this dissertation. The first focus is on better predicting student
performance by adding more information, such as student identity and information about how
many assistance students needed. The second focus is to analyze different performance and
feature set for modeling student short-term knowledge and longer-term knowledge. The third
focus is on improving the affect detectors by adding more features.
In this dissertation I make contributions to the field of data mining as well as educational research.
I demonstrate novel Bayesian networks for student modeling, and also compared them with each
other. This work contributes to educational research by broadening the task of analyzing student
knowledge to student knowledge retention, which is a much more important and interesting
question for researchers to look at. Additionally, I showed a set of new useful features as well as
how to effectively use these features in real models. For instance, in Chapter 5, I showed that the feature of the number of different days a students has worked on a skill is a more predictive
feature for knowledge retention. These features themselves are not a contribution to data mining
so much as they are to education research more broadly, which can used by other educational
researchers or tutoring systems.
iii
TABLE OF CONTENTS
Chapter 1: Introduction ... 1
Chapter 2: Individualization for Modeling Student Knowledge ... 2
2.1 The Student Skill model ... 2
2.2 Compare with Previous Method ... 10
2.3 The Most Important Parameter to Individualize ... 16
2.4 Class vs. Student in the Student Skill model ... 28
Chapter 3: The Predictive Power of the Assistance Information ... 42
3.1 Partial credit ... 42
3.2 The Assistance Model ... 53
3.3 Assistance Model Extension: The Sequence of Action Model ... 69
Chapter 4: Analysis about Knowledge Retention ... 84
4.1 Incorporating Factors Influencing Knowledge Retention ... 84
4.2 The Effect of Automatic Reassessment and Relearning ... 96
Chapter 5: Other Work Related to Student Modeling... 105
5.1 Attempts to Improve Affect Detectors ... 105
Chapter 6: Discussion and Future Work... 120
1
Chapter 1: Introduction
In this dissertation, several analysis and models that I have tried to improve student modeling are
described. The main question is how various factors influence student performance. In Intelligent
Tutoring Systems, the most common information that is gathered from students is student
performances, student identity, skill identity. In my work, I used various modeling techniques to
analyze the influence of different aspects of this information. Bayesian Networks, as a major
method, is optimal in capture the temporal nature when modeling changing student knowledge.
Other methods I used include regression models, which are good at integrating different factors to
make predictions; tabling models, which are great in terms of time efficiency. The tutoring
system we gathering our data is the ASSISTments platform, in which middle schools students
practicing math problems in an environment that multiple hints and attempts might be allowed.
This dissertation is organized into eight chapters. Chapter 2 and 3 shows different
attempts in improving student models by utilizing new factors: student identity and the assistance
information. The assessments of models were done by compare the predicting accuracy of student
performances. Most of the models made the assumption that there is an unobservable variable
(latent) that affects performance: student knowledge, and that the accuracy of predicting student
performance indicates the accuracy of estimate student knowledge. Chapter 4 broadening the task
of estimate student current knowledge and look into the question of estimate student long term knowledge. Regression models were used to quickly grab the features that might be important.
Chapter 5, is the experiments and analysis about affect detectors, focuses on improving current
2
Chapter 2: Individualization for Modeling Student Knowledge
2.1 The Student Skill model
One of the most popular methods for modeling students‟ knowledge is Corbett and Anderson‟s
Bayesian Knowledge Tracing (KT) model (Corbett & Anderson, 1995). The original Knowledge
Tracing model does not allow for individualization. Recently, Pardos and Heffernan (Pardos &
Heffernan, Modeling Individualization in a Bayesian Networks Implementation of Knowledge
Tracing, 2010) showed that more information about students‟ prior knowledge can help build a
better fitting model and provide a more accurate prediction of student data. Our goal was to
further explore the individualization of student parameters in order to allow the Bayesian network
to keep track of each of the four parameters per student: prior knowledge, guess, slip and learning.
We proposed a new Bayesian network model called the Student Skill model (SS), and evaluated it
in comparison with the traditional knowledge tracing model in both simulated and real world
experiments. The new model predicts student responses better than the standard knowledge
tracing model when the number of students and the number of skills are large.
This chapter has been published as a short paper at the following venue:
Wang, Y. & Heffernan, N. (2012). The Student Skill Model. In Proceedings of the 11th
International Conference on Intelligent Tutoring Systems. Springer. pp 399-404. (Wang &
Heffernan, 2012)
Introduction
One of the most popular methods for modeling students‟ knowledge is Corbett and Anderson‟s
(Corbett & Anderson, 1995) Bayesian Knowledge Tracing model. The original Knowledge
Tracing model does not allow for individualization. Several researchers have tried to show the
3
parameters with a two phase process and reported mixed results (Corbett & Bhatnagar, 1997).
Recently, Pardos and Heffernan (Pardos & Heffernan, Modeling Individualization in a Bayesian
Networks Implementation of Knowledge Tracing, 2010) showed that by a single process Bayesian network model: the prior per student model, more information about students‟ prior
knowledge can help better fit model and provide more accurate prediction of student data. The result is inspiring; however, the author only looked into the students‟ prior knowledge and didn‟t
extend the individualization to the other aspects of student knowledge, such as guess rate or
learning rate. Pardos and Heffernan (Pardos & Heffernan, 2011) also tried a method where they
trained all four parameters per student in a pre-process, then took those values and put them into a
per skill model to learn how the user parameters interacted with the skill. This method requires a
two phase data process, which is complicated to use in real-world.
Our goal was to further explore the individualization of student parameters in order to allow the
Bayesian network to keep track of all our parameters per student as well as skill specific
parameters simultaneously. We proposed a new Bayesian network model called the Student Skill
model (SS), and evaluated it in comparison to the traditional Knowledge Tracing model (KT) in
both simulation and real data experiments. The new model predicts student responses better than
standard knowledge tracing model when the number of students and the number of skills are large.
The Student Skill Model
The Knowledge Tracing model assumes that all students have the same probability of knowing a
particular skill at their first opportunity, or guess/slip in one skill, or learning a particular skill
even though students seem likely differ in these aspects. Our goal was to add individualization
4
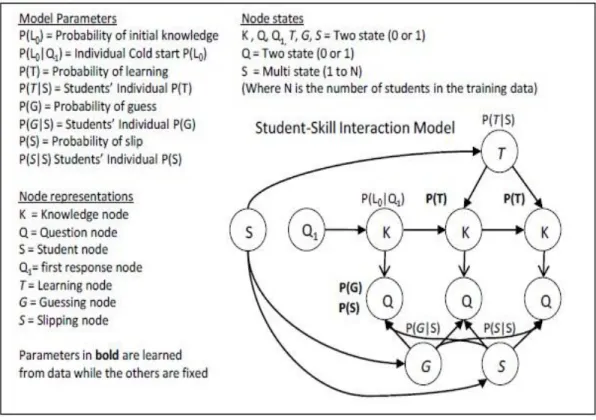
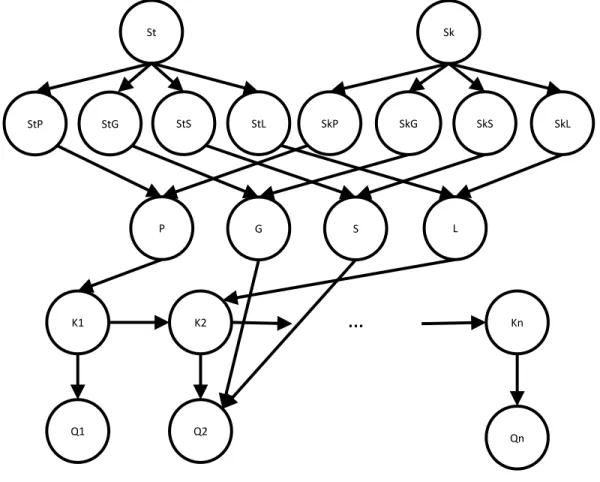
The new model we proposed in this paper is called the Student Skill model. It can learn four
student parameters and four skill parameters simultaneously in a single phase process. The model
is shown in Fig. 2.1.1.
Fig. 2.1.1. The Student Skill model
The lowest two levels of this model are the same as the original Knowledge Tracing model (nodes K1~Kn and Q1~Qn in Fig. 2.1.1). The Student Skill model adds upper levels to represent
the student and skill information and their interaction. We used two multinomial nodes to
represent the identity of each student (node St in Fig.2.1.1) and each skill (node Sk in Fig. 2.1.1).
Instead of pointing the student identity and the skill identity nodes directly to the knowledge St StG StS StL StP SkP Sk SkG SkS SkL G S L P K2 K1 Q1 Kn Q2 Qn ...
5
nodes, which would result in a huge number of parameters, we added a level of nodes to represent
the four student parameters (node StP, StG, StS and StL in Fig. 2.1.1) and the four skill
parameters (node SkP, SkG, SkS and SkL in Fig. 2.1.1). Those parameter nodes are binary nodes that represent the high/low level of the corresponding parameters. For example, if the StP node is
1 for a student, then the student has high level of prior knowledge, and if the StP node is 0 for a
student, means the student has low level of prior knowledge. The next level uses conditional
probability tables to combines the influence of the student parameters and the skill parameters
and generates the four standard Knowledge Tracing parameters (node P, G, S and L in Fig. 2.1.1)
to be used in the lowest two levels.
The number of parameters in this model for n students and m skills can be computed as:
, while the number of parameters in the Knowledge Tracing model is: . The cost of individualization is the additional parameters.
Model Evaluation
The model is evaluated in both simulated and real data experiments. In our experiments, we used
the Bayes Net Toolbox for Matlab developed by Murphy (Murphy, 2001) to implement the
Bayesian network student models and the Expectation Maximization (EM) algorithm to fit the
model parameters to the dataset. We choose initial parameters for each skill in Knowledge
Tracing as follows: initial knowledge = 0.5, learning = 0.1, guess = 0.1, slip = 0.1.
Simulation Experiments
Methodology.
To evaluate the ability of the Student Skill model to function properly, in this experiment, we
generated data from the Student Skill model and compared the prediction accuracy with the
6
performances, with 1 representing correct and 0 representing incorrect. To simulate the random
noise in the real data, we randomly flipped over 1% of the student performance data.
To split the training and testing data set, for each student, we randomly selected half of the skills
data and put them into a training set. The remaining data went to the testing set. Both the
Knowledge Tracing model and Student Skill model were trained and tested on the same dataset. A sequence of performances of given students and skills were predicted by both of these models.
Results.
Prediction accuracy is the selected metric for evaluating the results. In one simulation, the number
of skills was set at 30 while the number of students was changed from 5 to 100 to observe the
influence the number of student had on SS and KT respectively. Similarly, in another simulation,
the number of students was set to be 30 while the number of skills was changed.
We observed that, in situations with a small number of students as well as those with a small
number of skills, the Knowledge Tracing model outperformed the Student Skill model. However,
when the number of students and the number of skills were increased, the performance of the
Student Skill model improved and eventually exceeded the Knowledge Tracing model. The
reason for this trend could be the fact that the Student Skill model contains more parameters than
the Knowledge Tracing model, and with fewer data points, the model behaves less reliably.
We also compared the Student Skill model and the Knowledge Tracing model under different
student parameter variance. The number of students and the number of skills were both set to 40,
and the number of data points per student per skill was set to 10. The student variance was
controlled by the real parameters used to generate simulated data. When the student variance was
0, all students shared the same parameters. We observed that the Student Skill model performs
worse when there is no variance in student parameters. When the students are highly diverse, the
7 Real Data Experiments
One of the dangers of relying on simulation experiments is that the dataset may not reflect
real-world conditions. Without evaluation using real data, the success of the new model during
simulation could simply be caused by the data being generated from this model. To further
evaluate the Student Skill model, we applied it to real datasets and again compared its performance with the Knowledge Tracing model.
Dataset.
The data used in the analysis presented here came from the ASSISTments platform, a freely
available web-based tutoring system for 4th through 10th grade mathematics. We randomly
pulled out the data of one hundred 12-14 year old 8th grade students and fifty skills from
September 2010 to September 2011 school year. There are 53,450 total problem logs in the
dataset.
Methodology.
The dataset was randomly split into four bins by student and skill in order to perform a four-fold
cross-validation of the predictions and increase the reliability of the results. For each student, we
made a list of the skills the student had seen and split that list randomly into four bins, placing all
data for that student and that skill into the respective bin. There were four rounds of training and
testing, during each round a different bin served as the test set, and the data from the remaining
three bins served as the training set. Again, both the Knowledge Tracing model and the Student
Skill model were trained and tested on the same dataset. A sequence of performances of the given
students and skills were predicted by both of these models.
8
The accuracy of the prediction was evaluated in terms of the Root Mean Squared Error (RMSE).
A lower value means higher accuracy. The cross-validation results are shown in Table 2.1.1.
Table 2.1.1. RMSE results of KT vs SS.
Fold ID SS KT P value Student Level p value
Fold1 0.4017 0.4055 0.0432 0.0404
Fold2 0.4194 0.4385 0.0459 0.0365
Fold3 0.4144 0.4348 0.0477 0.0451
Fold4 0.4441 0.4538 0.0420 0.0406
average 0.4199 0.4331 -- --
To test the reliability of the four folds experiment, we did a paired T test for each fold as well as
the result of all the folds. The p value that compares the final RMSE of the SS model and the KT
model of the four folds is 0.0439. The p value for each individual fold is shown in the fourth
column. Our experiment shows that the difference between SS and KT is statistically significant,
and the average RMSE shows that SS is more accurate than KT under our experimental
conditions. We also did reliability analysis by computing RMSE for each student to account for
the non-independence of actions within each student‟s dataset, and then compared each pair of
models using a two tailed paired t-test. The Student Level p values are reported in the last column.
All the results are statistically reliable.
Discussion and Future work
In this paper, we built a new Bayesian network model for modeling individual student parameters
called the Student Skill model and compared it with the knowledge tracing model in both
simulation and real data experiments.
In our experiments, we found that the Student Skill model is not always better than the
9
generally more accurate when the amount of students and skills are large. We are interested in
other features that can indicate which model works better under what situations, in the hope that these two models can be combined in order to utilize both models‟ advantages.
Contribution
Several researchers have tried to show the power of individualization. Corbett and Anderson presented a method to individualize students‟ parameters with a two phase process: first run
Knowledge Tracing on all the students and then run a separate regression to learn a set of slip,
guess, learning and prior parameters per students. Pardos and Heffernan (Pardos & Heffernan,
Modeling Individualization in a Bayesian Networks Implementation of Knowledge Tracing, 2010)
explored the individualized student prior, but did not learn all of the student parameters and skill
parameters in one single model. We presented the SS model, which is elegant in accounting for
individual differences (of learning rate, prior knowledge and guess and slip rates). Our simulation
showed that we could reliably fit such a model. The simulation showed plausible results, such as
that the SS model is better if more variation per student.
Our contribution is in presenting a model that allows us to use EM to learn parameters
individualized to each student, while at the same time learn parameters for each skill. We
presented simulation and real data experiments that showed this method can provide meaningful
results. Knowledge Tracing is a special case of this model and can be derived by fixing the
student parameters of the Student Skill model to the same values. In a practical sense, researchers
need to figure out when the SS model can start to be used, as our simulation showed that SS is
better than KT when 1) the number of skills a student has learned is high, and 2) the number of
10
2.2 Compare with Previous Method
One of the most popular methods for modeling students‟ knowledge is Corbett and Anderson‟s
(Corbett & Anderson, 1995) Bayesian Knowledge Tracing (KT) model. The original Knowledge
Tracing model does not allow for individualization. In this work, we focus on comparing two
different individualized models: the Student Skill model and the two-phase model, to find out
which is the best for formulating the individualization problem within a Bayesian networks
framework.
This chapter has been published as a short paper at the following venue:
Wang, Y., & Heffernan, N. T. (2013) A Comparison of Two Different Method to Individualize
Students and Skills. In Proceedings of the 16th International Conference on Artificial Intelligence
in Education. pp. 836-840. (Wang & Heffernan, A Comparison of Two Different Method to
Individualize Students and Skills, 2013)
Introduction
One of the most popular methods for modeling student knowledge is Corbett and Anderson‟s (Corbett & Anderson, 1995) Bayesian Knowledge Tracing model. The original Knowledge
Tracing model does not allow for individualization. Recently, Pardos and Heffernan (Pardos &
Heffernan, Modeling Individualization in a Bayesian Networks Implementation of Knowledge
Tracing, 2010) built a two phase individualization method where they trained four parameters per
student at a pre-process, then took those values and put into a per skill model to learn how the
user parameters interacted with the skill. This model is part of the final model that won the 2010
KDD Cup on educational data mining. The assumption this model made, which is we can learn
student parameters first without any knowledge of skills seems unreasonable. Wang and Heffernan‟s work (Wang & Heffernan, The Student Skill Model, 2012) further explored the
11
student parameters and four skill parameters simultaneously in one step in a model called the
Student Skill model (SS), which seems more appealing to our desire for elegance. The goal of this
paper is to answer two questions that this new individualization model raised. First, is this approach better than the two phase model that won the KDD Cup? And second, under what
circumstances is it better?
Two Individualization Models
Fig.2.2.1. shows Pardos and Heffernan‟s two phased model. To train this model, the first step was
to learn student parameters by using the Prior Per Student (Pardos & Heffernan, Modeling
Individualization in a Bayesian Networks Implementation of Knowledge Tracing, 2010) model
by training on all skill data for an individual student one at a time. The second step was to include
all of the student specific parameter information into a model, shown in Fig. 2.2.1 to learn skill
related parameters.
12
The second model that allows for individualization is called the Student Skill (SS) model (Wang
& Heffernan, 2012). It can learn four student parameters and four skill parameters simultaneously
in a single phase process. The model is shown in Fig. 2.2.2.
Fig. 2.2.2. The Student Skill model Experiments
The two models were compared in both simulated and real data experiments. Only the real data
result is reported here, simulation result is similar.
The data used in the analysis came from the ASSISTments platform, a freely available web-based
tutoring system for 4th through 10th grade mathematics. We randomly pulled out data of one
hundred 12-14 year old 8th grade students and fifty skills from the school year September 2010 to
September 2011. There are in total 53,450 problem logs in the dataset. The dataset was randomly split into four bins in order to perform a four-fold cross-validation. For each student, we made a
list of the skills the student had seen and split that list of skills randomly into four bins, placing all
13
and testing where at each round a different bin served as the test set, and the data from the
remaining three bins served as the training set. Both models were trained and tested on the same
dataset.
The accuracy of the prediction was evaluated in terms of the Root Mean Squared Error (RMSE).
Lower value means higher accuracy.
General Data Experiment
The purpose of the general data experiment was to determine which of the two individualization
models works better in a real world Intelligent Tutoring System datasets. The cross-validation
results are shown in Table 2.2.1.
Table 2.2.1. RMSE of SS vs 2-phase
Fold ID SS 2-phase
Fold 1 0.447 0.452
Fold 2 0.438 0.451
Fold 3 0.422 0.420
Fold 4 0.445 0.446
The average RMSE of the Student Skill model is 0.438, which is better than the Two Phase
model 0.442. However, paired t-test result has p > 0.05, which indicates that the result is not
statistically reliable.
Filtered Data Experiment
The assumption we tried to verify in this experiment is that, in the first phase of the two phase
model, when the model tries to determine which are the student parameters without knowing the skill information, the students that have done only easy skills will be more likely to get “better”
14
done only hard skills, and this inaccuracy in estimating student parameters would affect the Two Phase model‟s results, and causes a difference in model performance compared to the Student
Skill model.
We filtered our dataset according to our assumption through the following steps and then
compared the two models again on this filtered dataset.
a) Group skills to hard/medium/easy using percent correctness, in order to ensure that skills
are very different, we threw out the medium group and kept only the hard and easy group skills;
b) Find student group A that contains students who have done both hard and easy skills;
c) Find student group B who have done only hard skills;
d) Find student group C who have done only easy skills;
e) Randomly select equal numbers of students from all three groups and use the data logs
that are from only the hard and easy skills to build the dataset.
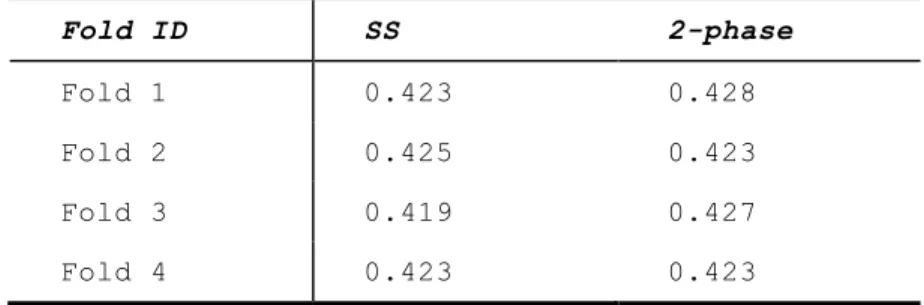
The cross-validation results are shown in Table 2.2.2.
Table 2.2.2. RMSE result of SS vs 2-phase in Filtered Real Data Experiment
Fold ID SS 2-phase
Fold 1 0.423 0.428
Fold 2 0.425 0.423
Fold 3 0.419 0.427
Fold 4 0.423 0.423
The average RMSE of the Student Skill model is 0.423, which is better than the Two Phase
model 0.426. The paired t-test on the prediction residual of all of the data points has p < 0.05,
15
Conclusion
In this paper, we were able to show that the two different individualized Knowledge Tracing
16
2.3 The Most Important Parameter to Individualize
The intelligent tutoring system field is concerned with ways of personalizing to the student. The
current best work coming out of personalization is the Student Skill model. They compared their
model to the state-of-the-art Knowledge Tracing model, and achieved a reliable improvement
over standard Knowledge Tracing. One limitation of their work is that they only investigated one
particular way of personalizing, which individualizes all four standard Knowledge Tracing
parameters: Prior, Learn, Guess and Slip simultaneously. But are all four of these parameters
equally good at predicting student learning? It may be better if we just use some of the parameters
to personalize the model. More generally, we wanted to address the research question: What are
the most important features to personalize? In this work, we first attacked several issues with the
Student Skill model and made reliable improvements. On top of that, we systematically explored
all possible ways of incorporating student features into the model. We found that prior and slip
are the two most important features, and the best model is the one with all four parameters individualized. Additionally, the one parameter that can be dropped without any hurt to
performance is guess.
This chapter is the longer version of a poster that has been published at the following venue:
Gu, J., Wang, Y. & Heffernan, N. T. (2014). Personalizing Knowledge Tracing: Should We
Individualize Slip, Guess, Prior or Learn rate? In Proceedings of the 12th International
Conference on Intelligent Tutoring Systems. pp 647-648. (Gu, Wang, & Heffernan, 2014)
Introduction
The traditional way of modeling student knowledge is Corbett and Anderson‟s Knowledge
Tracing (KT) model (Corbett & Anderson, 1995). Pardos and Heffernan (Pardos & Heffernan,
Modeling Individualization in a Bayesian Networks Implementation of Knowledge Tracing, 2010)
17
knowledge for each student. By allowing a single parameter per student in this way, they allowed
their model to be “individualized” on student prior knowledge. They reported that this model was
better than KT in both predictive accuracy and convergence properties. That work led to Wang and Heffernan‟s idea that if we individualize all four of the standard KT parameters (Prior, Learn,
Guess and Slip), we might get an even better performance. They introduced the Student Skill (SS)
model (Wang & Heffernan, 2012) and showed that it was better than both KT and Pardos and Heffernan‟s model. The largest limitation of their work is they only investigated one particular
way of personalizing, which personalized all the four student features simultaneously, and their
model ignored the constraints of data sparsity. It‟s always going to be the case that if you have
lots of data per student, the benefit of individualization will be good. But that leaves open the
question: if you have a small amount of data per student, what should you attempt to
individualize first? If you have even more data, what should you individualize secondly? And
more generally, is individualization always going to be good, or is it the case that for best
performance, it‟s better to individualize just a subset of the four parameters? So our research
questions are RQ1: What is the one single parameter that is best to individualize upon? RQ2:
Which parameter can be dropped without hurt to the performance? RQ3: What the best model if
we individualize two of the parameters? Finally, we want to answer the critical research question:
what are the most important features to personalize? Furthermore, if not all the parameters are
essential, by reducing the number of parameters in the model, the complexity of the model fitting
procedure can also be dramatically reduced. The practice of this work is that, as MOOCs and
other large providers of educational data are making predictions upon log data, we suggest that
they personalize their system based upon our work.
Model
The Knowledge Tracing model is one of the most popular ways of modeling student knowledge,
18
performance parameters: guess rate and slip rate. The Student Skill model adds student
individualization into the original Knowledge Tracing model. In Wang & Heffernan (Wang &
Heffernan, 2012), they said, “Knowledge Tracing is a special case of this model and can be derived by fixing the student parameters of the Student Skill model to the same values.” While
this is roughly true, but it does not give the exact procedure and there are extra parameters learned
that have no equivalent in the traditional way of doing Knowledge Tracing. In detail, it used four
interaction nodes to reduce the number of parameters in the Conditional Probability Table (CPT).
As a result, the CPTs of the knowledge nodes were set to fixed functions of the learning node and
the knowledge node at the previous time step. Although it significantly reduces the number of
parameters, the performance could also be compromised.
To overcome the shortcomings of the original SS model, we extended the number of the
interaction node and the number of each student and skill feature node to the number of time
slices. The structure of the improved SS model is shown in Fig. 2.3.1. The parameters of
knowledge nodes and performance nodes become fixed functions of their parent interaction nodes.
For example, the CPT of the learning node is set to [0, 1], where the probability of learning is
directly derived from the interaction learning node. The CPTs of the four interaction nodes, which
can have one or two parent nodes, are the only CPTs that change for different structures we
explored. If the interaction node has only one parent node, its CPT is set to [0, 1], and it just
passes the same parameters of the student/skill features. If the interaction node has two parent
nodes, its CPT is set to [0, 0.5, 0.5, 1], where the second and third parameters are learned to
19
Methodology
The goal of our experiment is to search the best structures of the SS model. In the SS model
structure, both the student and the skill node have four feature nodes (prior, learning, guess and
slip). The interaction nodes combine the feature nodes for student and skill. If we want to exclude
one feature from the student or the skill node, we can simply remove the link from the feature
node to its corresponding interaction node in the Bayesian Network. Thus, by employing different
combinations of links from the feature nodes to the interaction nodes, the models we want to
examine can be constructed. Our first hypothesis is that, as the traditional way of constructing the
Knowledge Tracing model is to fit each KT model for each skill, all the four features for skill
should always be included. Thus, we tried all of the 16 possible ways of selecting the student
features with all four skill features incorporated. The model with all four features from student is
the original SS model, and the one with no features from student is the counterpart of the KT
model. Furthermore, we also suspected that for each parameter we might want to choose between
skill and student rather than take both. Therefore, we also tried another 16 ways of selecting
Fig.2.3.1. Student Skill model.
SkP SkL SkS SkG
20
either one of the features from student or skill. In total, we tried 32 different ways of
incorporating features from student and skill and validated the 8 best structures using a larger
dataset.
Dataset
The dataset we considered come from the 2009-2010 school year of ASSISTments, which is a
free online platform developed at Worcester Polytechnic Institute. In the system, a student
attempts a number of problems while working through an assignment. We select those
student-skill sequences with less than or equal to 10 attempted opportunities. To explore all the structures,
we selected a dataset (D1) with 81 distinct students and 78 distinct skills with 113,672 data points.
To further validate the result, we selected another larger dataset (D2) with 1775 distinct students,
123 distinct skills and 695,732 data points. For all the experiments, we used Expectation
Maximization (EM) as the model fitting procedure. To insure the reliability of the results, a
five-fold cross validation was performed for each experiment. Considering that a missing student or
skill in either the training data or the test data would compromise the performance, we had to
make sure both datasets contain proportionate number of students and skills. The approach we
used is: for each skill, we assign different students into 5 folds.
The measures of performance we used are Root Mean Square Error (RMSE), Mean Absolute
Error (MAE), Area Under the Curve (AUC) and R Squared (R2). Larger AUC, larger R2, smaller
RMSE, and smaller MAE indicate better performance. After doing cross validations, we also did
a t-test for each of the measures between every two of the models.
Results
21
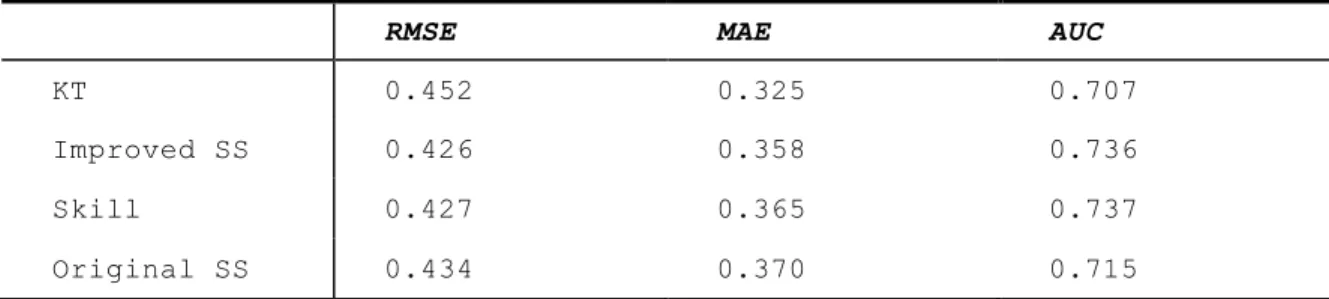
To validate that the SS model has a reliably better performance, we compared the predictive
performance of the improved SS model to those of the original SS model, the Skill model (The
SS model with no student parameter individualized, which is just another way of doing KT), and the original KT model. Table 2.3.1 shows the results in terms of Root Mean Square Error
(RMSE), Mean Absolute Error (MAE) and Area Under the Curve (AUC). We observed that the
improved SS model has remarkably better performance in RMSE and AUC compare to the KT
model, which confirmed the fact that the SS model is significantly better than the original KT
model. Surprisingly, although the Skill model is just the counterpart of KT, it also showed
reliably better performance than KT. The Student Skill model structure in some way might be
better than the standard way of doing KT. Additionally, the improved SS model also showed
better performance than the original one, which indicates that our way of individualizing is
indeed beneficial.
Table 2.3.1. Performance of KT model
RMSE MAE AUC
KT 0.452 0.325 0.707
Improved SS 0.426 0.358 0.736
Skill 0.427 0.365 0.737
Original SS 0.434 0.370 0.715
RQ1: What is the one single parameter that is best to individualize upon?
First, we listed all the models with only one feature individualized at the student level. Table
2.3.2 shows the predictive performance of the models. The models are showed in ascending order
by their RMSE values. According to the results, if we only want to individualize one feature, we
probably should individualize prior, as it has the best RMSE, MAE, AUC and R2 values among
22
only has slightly worse AUC and R2 values compare to the model with prior. According to this
result alone, we think prior and slip are the two most important features for personalizing.
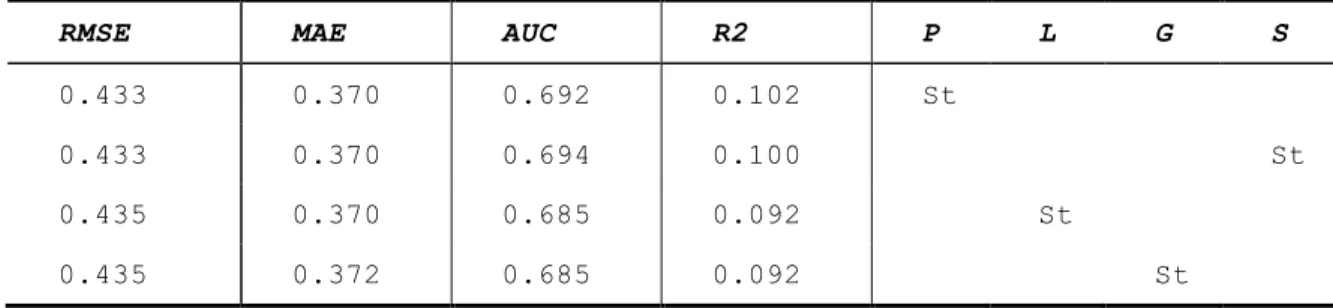
Table 2.3.2. Performance of models with only one parameter individualized (P: Prior; L: Learn; G: Guess; S: Slip; St: the parameter was individualized at the student level)
RMSE MAE AUC R2 P L G S
0.433 0.370 0.692 0.102 St
0.433 0.370 0.694 0.100 St
0.435 0.370 0.685 0.092 St
0.435 0.372 0.685 0.092 St
RQ2: Which parameters can be dropped without hurt to the performance?
We then tested all four models with only one feature missing from student. The model with the
best performance is the one without the guess parameter individualized, which indicates that per
student guess information is the least valuable. On the other hand, the model without prior and the
model without slip are the two worst models in this case, which again indicates that slip and prior
are the two most important features. This time, slip is slightly more important than prior as the
model without slip is worse in terms of MAE, AUC and R2.
Table 2.3.3. Performance of models with three parameters individualized (P: Prior; L: Learn; G: Guess; S: Slip; St: the parameter was individualized at the student level)
RMSE MAE AUC R2 P L G S
0.431 0.368 0.699 0.107 St St St
0.432 0.370 0.696 0.103 St St St
0.432 0.370 0.695 0.103 St St St
23
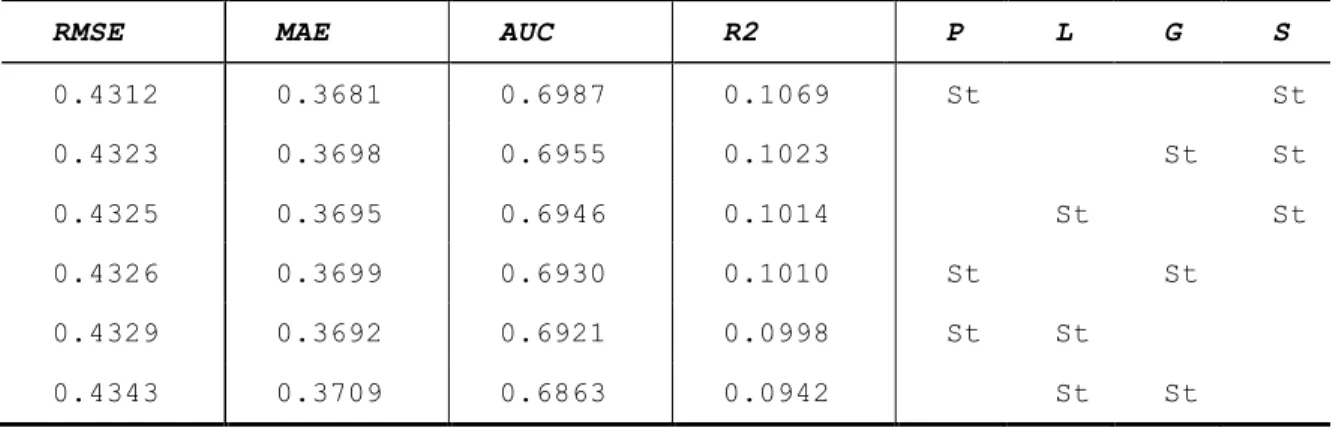
RQ3: What the best model if we individualize two of the parameters?
As shown in Table 2.3.4, if we only want to individualize two parameters, prior and slip would be
the choice. Again, this is consistent with the previous two results, that prior and slip are the two most important features. Additionally, we noticed that the best models always had slip feature
individualized, which seemingly indicates that slip is even more important than prior.
Table 2.3.4. Performance of models with two parameters individualized (P: Prior; L: Learn; G: Guess; S: Slip; St: the parameter was individualized at the student level)
RMSE MAE AUC R2 P L G S
0.4312 0.3681 0.6987 0.1069 St St 0.4323 0.3698 0.6955 0.1023 St St 0.4325 0.3695 0.6946 0.1014 St St 0.4326 0.3699 0.6930 0.1010 St St 0.4329 0.3692 0.6921 0.0998 St St 0.4343 0.3709 0.6863 0.0942 St St
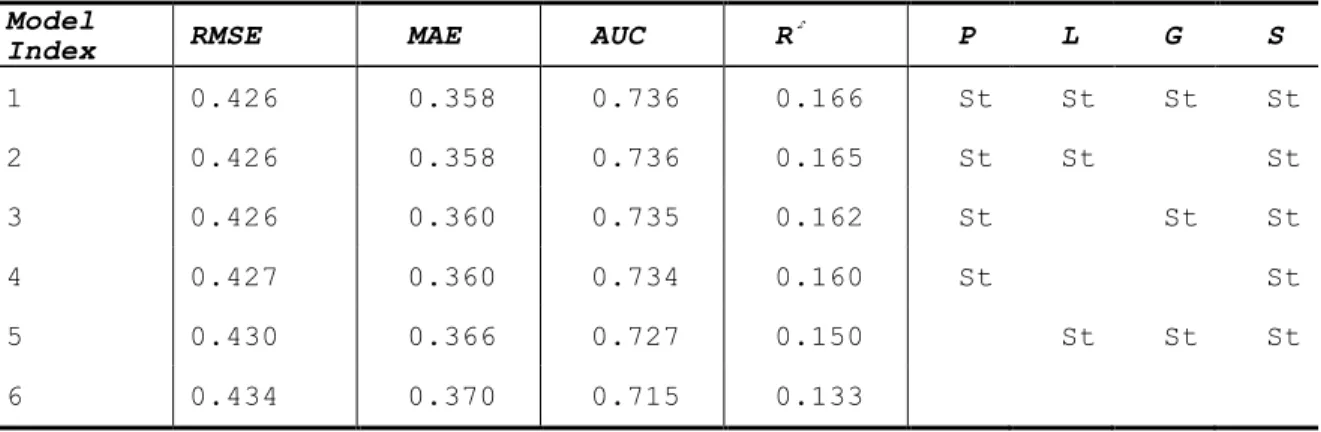
Validation of the top models
The differences between the best models and the SS model with all four parameters
individualized in previous experiments are not statistically reliable. We selected the best models,
and validated their performance using a much larger dataset containing 1755 students. We want to check if there‟s enough data for each student, whether or not the results still hold. As we can
observe from Table 2.3.5, the fully individualized SS model is ranked first in the table, indicating
that if we have enough data for each student, in order to gain a better performance, we should
24
Table 2.3.5. Performance of the best models (P: Prior; L: Learn; G: Guess; S: Slip; St: the parameter was individualized at the student level)
Model
Index RMSE MAE AUC R P L G S
1 0.426 0.358 0.736 0.166 St St St St 2 0.426 0.358 0.736 0.165 St St St 3 0.426 0.360 0.735 0.162 St St St 4 0.427 0.360 0.734 0.160 St St 5 0.430 0.366 0.727 0.150 St St St 6 0.434 0.370 0.715 0.133
Furthermore, we did a t-test between every pair of the top models, and reported the ones that were
reliably different (p value < 0.05) in Table 2.3.6, where the model indexes are the same as in
Table 2.3.5. As we can see, model 1 (the fully connected SS model) and model 2 (the one only
without student guess parameter), model 1 and model 3 (the one only without student learn
parameter) were not reliably different in some of the metrics, which indicates that guess and learn
are the two parameters not important to personalize. This, again, implies that slip and prior are
more important. Overall, it is hard to distinguish if one model is better than its adjacent models in
the table. However, the difference is palpable if we compare the models on the top to the models
on the bottom.
Table 2.3.6. t-tests among the best models (R: reliably different in RMSE; A: reliably different in AUC; M: reliably different in MAE; r: reliably different in R2 All: reliably
different in all four measures)
Model Index 2 4 5 3 1
6 All All All All All
2 R M r All R M r A r
4 All R M r All
5 All All
3 R M r
25
be the most important feature to personalize. Comparably, slip is even more important than prior,
because almost all the models with slip individualized at both skill and student level has
significantly better RMSE, MAE and AUC values than those of other models. Also, the feature slip can capture the ceiling effect of student knowledge, so it is possible that different students
have different upper bounds of knowledge. Furthermore, of all these models evaluated, the best
model was not reliably different with the one with prior, learn and slip individualized at the
student level. The result indicates that students‟ guessing abilities do not differ a lot.
Models with complimentary features for student and skill
Finally, we also tested the performances of the models containing features individualized at either
the student or the skill level. The total number of models is 16 as both student and skill have four
features. According to our results, the model with only individualized slip for student is
marginally superior to the baseline model, although not reliably different, which again indicates
that student slip is indeed a very important feature to personalize. As expected, the baseline
model ranked second among all the models and is significantly better in R2 value than the one
that individualized all four features at student level.
Contributions
In this paper, we investigated the research question: which features of student are most important
to individualize in a Bayesian Knowledge Tracing framework. The paper makes several
contributions to large-scale student modeling.
Many researchers have shown the effect of personalization, but no one in the ITS field has looked
at what parameters are most important to individualize. For example, the Student Skill model has
shown significantly better performance than the standard KT model, but was only personalized in
one particular way: personalized all four student features simultaneously. We extended the work by exploring more structures of the model and searched for the best way of personalization. The
26
results show that if we only individualize one feature for student, the most valuable feature would
be slip or prior. It is reasonable that students‟ prior knowledge differ greatly. Since slip represents
the probability of a wrong answer given the student knows the skill, teachers or tutoring systems may need to pay attention to the students with large slip rates to check if they lose interest after
mastering a skill or if they are still confused with some aspect in the skill while already mastered
the major part of it, and take different actions accordingly.
Secondly, the single best model is the one with all four parameters personalized for student, but is
not reliably different than the one without student guess, which also means guess is dispensable if we don‟t want to individualize all four parameters because of lack of information of students.
In addition, by attacking several problems with the original Student Skill model, we also made
reliable improvement to the model. And interestingly, we found that the SS model without any
individualization at the student level, which should be just KT, is actually reliably better than the
normal KT model. This indicates that our way of modeling student learning is successful.
Future Work
Our finding that prior and slip are so important is a novel contribution. But we did not answer the
question, why is this so? What is it about prior and slip that gives this extra boost in precision?
This raises new question about what might be better ways to individualize.
The largest limitation of this work is that it has only been evaluated on one large dataset from
ASSISTments. It is possible that the results may differ when using data from other tutoring
systems. Furthermore, the fitting procedure of the SS model takes a long time and cannot be used
in real time. Considering that the reliably better performance of the SS model is still worthwhile,
the tradeoff between number of parameters in individualization and the time cost of the model
27
parameters at school, class and teacher level instead of just student, because we suppose that
some features like the prior knowledge may differ more between different classes and schools.
In our scheme of individualization, it is an all or nothing approach: either each student is
individualized on a parameter or not. But this of course is unwise, and if you had an algorithm
that worked in real time, you would want to start out by using skill level parameters only; slowly over time as you accumulate more data on students‟ prior and slip rates, you would want to start
to use individualized parameters. Fundamentally, the goal of individualization in real time is the
Holy Grail of individualization, and our field needs a lot of work to be able to come up with an
28
2.4 Class vs. Student in the Student Skill model
For decades, intelligent tutoring systems researchers have been developing various methods of student modeling. Most of the models, including two of the most popular approaches: Knowledge
Tracing model and Performance Factor Analysis, all have similar assumption: the information needed to model the student is the student‟s performance. However, there are other sources of
information that are not utilized, such as the performance on other students in same class. This
chapter extends the Student-Skill extension of Knowledge Tracing, to take into account the class
information, and learns four parameters: prior knowledge, learn, guess and slip for each class of
students enrolled in the system. The paper then compares the accuracy using the four parameters
for each class versus the four parameters for each student to find out which parameter set works
better in predicting student performance. The result shows that modeling at coarser grain sizes
can actually result in higher predictive accuracy, and data about classmates‟ performance is
results in a higher predictive accuracy on unseen test data.
This chapter has been published at the following venue:
Wang, Y., Beck, J.E. (2013) Class vs. Student in a Bayesian Network Student Model. In
Proceedings of the 16th International Conference on Artificial Intelligence in Education. pp.
151-160. (Wang & Beck, 2013)
Introduction
Student modeling is crucial for Intelligent Tutoring Systems (ITS) to improve and to provide
better tutoring for students. For decades, researchers in ITS have been developing various
methods of modeling students. Two of the most popular approaches are Bayesian Knowledge
Tracing (KT) (Corbett & Anderson, 1995), which uses a dynamic Bayesian Network to model
29
which uses a logistic regression to predict student performance. Both techniques have a similar
underlying assumption that two things are needed to model the student: one component concerns
the domain, such as skill information in KT and PFA models, or item information in the PFA
model; the other component is the student‟s problem solving performance on the skill.
However, there are other sources of knowledge that are not utilized, such as the performance of other students in the same class. Instead, only this student‟s previous performances are taken into
account. Imagine there is a class of 20 students, 19 of whom get the first item on a skill wrong, and you want to predict the performance of the 20th student‟s first item on the skill. Intuitively,
predicting that this student would also respond incorrectly seems like a safe bet. However, current
student models such as KT and PFA will not be affected by those 19 incorrect responses, as they
were all made by other students. What would the effect on predictive accuracy be if which class a
student is currently in was factored into student models? Our intuition is that class perhaps contains important information such as the student‟s prior knowledge about a skill. Since all
students in a class share a common teacher, curriculum, and assigned homework problems, we
should expect similarities in performance. Our goal is to capitalize on this dependency to improve
student modeling.
In fact, the US Institute for Educational Sciences requires grant proposals‟ power analyses to
discount the sample size if there are multiple students in the same classroom, due to their lack of
independence from each other (most statistical tests require each sample to be independent).
Given that we know this dependence effect exists statistically, why not make use of it? In this
paper, we are focusing on utilizing the class information to improve student modeling and trying to determine under which circumstances, using other students‟ information could be more
beneficial than using current student‟s individual information.
30
This section briefly introduces the Student Skill model and the modification of it in order to allow
class level individualization. The modified model also allows us to run experiments on various
combinations of student and class information to determine whether or not the class information
is better than the student information for each parameter.
Model
Knowledge Tracing is one of the most popular methods for modeling student knowledge. The
original Knowledge Tracing model do not allow for individualization, and assumes that all
students have the same probability of knowing a particular skill at their first opportunity, or
slipping (making a careless mistake) on a skill, or learning a particular skill. This assumption is
almost certainly invalid, as students are likely to differ in these aspects. Several researchers have
tried to show the power of individualization (Wang & Heffernan, 2012) (Pardos & Heffernan,
Modeling Individualization in a Bayesian Networks Implementation of Knowledge Tracing,
2010). The model we use in this work is built upon one of the individualization model called the
Student Skill model (Wang & Heffernan, 2012). The idea of the Student Skill model is that rather
than estimating a learning rate for each skill, instead view learning rate as being a function of the
skill and of this individual learner. Perhaps some skills are learned more quickly or slowly than
others, and perhaps some students learn more quickly or slowly than others. By combining both
effects, it is possible to more accurately model the student.
The Student Skill model structure is shown in Fig. 2.4.1. The goal of the Student Skill model is to
add individualization into the original Knowledge Tracing model. It can learn four student
parameters and four skill parameters simultaneously. The lowest two levels of this model are the same as the original Knowledge Tracing model (nodes K1…Kn and Q1…Qn in Fig. 2.4.1). The
Student Skill model adds upper levels to represent the student and skill information and their
31
Fig. 2.4.1) and each skill (node Sk in Fig. 2.4.1). Instead of pointing the student identity and the
skill identity nodes directly to the knowledge nodes, which will result in an exponentially
increasing number of parameters, we instead added a level of nodes to represent the four student parameters (node StP, StG, StS and StL in Fig. 2.4.1) and the four skill parameters (node SkP,
SkG, SkS and SkL in Fig. 2.4.1). Those parameter nodes are binary nodes which represents the
high/low level of the corresponding parameters. For example, if the StP node is 1 for a student,
means the student has high level of prior knowledge, and if the StP node is 0 for a student, means
the student has low level of prior knowledge. Then the next level combines the influence of the
student parameters and the skill parameters and generated four standard Knowledge Tracing
parameters (node P, G, S and L in Fig. 2.4.1) to be used in the lowest two levels. In this way, we
generate a knowledge tracing model that is custom-fit to each learner and for each skill.
Fig. 2.4.1. The Student Skill model
St StG StS StL StP SkP Sk SkG SkS SkL G S L P K2 K1 Q1 Kn Q2 Qn
…
32
One drawback of the Student Skill model is that it requires a large number of parameters. In
addition to estimating four parameters per skill, it must also estimate four parameters per student.
Given that many datasets have considerably more users than skills, this inflation in the number of parameters is a large concern. Therefore, we considered methods for reducing the number of
parameters in our model, to enable them to better generalize to unseen data. One approach is,
rather than modeling the students as individuals, to instead model which mathematics class the
student is enrolled in. Students within the same class have the same teacher, textbook, homework,
and may even be grouped by ability in the subject. Given that, in our datasets, there are typically
about 24 students per class, modeling class-level effects has 24 times as much data to estimate
parameters. In addition, if we only model class parameters, we only have to estimate 1 set of
parameters for each class of students, rather than 1 set for each individual students. Thus, the use
of class information can be seen as a coarser grain-size individualization compared to the Student
Skill model. We demonstrate the Class Skill model in figure 2.4.2, and the nodes are identified as
follows:
─St: A multinomial node represents each student‟s identity, observable. ─Sk: A multinomial node represents each skill‟s identity, observable. ─StP: Student Prior Knowledge, binary node, latent.
─StG: Student Guess rate, binary node, latent. ─StS: Student Slip rate, binary node, latent. ─StL: Student Learning rate, binary node, latent. ─SkP: Skill Prior Knowledge, binary node, latent. ─SkG: Skill Guess rate, binary node, latent. ─SkS: Skill Slip rate, binary node, latent. ─SkL: Skill Learning rate, binary node, latent.
─P: Prior Knowledge of a particular student and a particular skill, binary node, latent. ─G: Guess rate of a particular student and a particular skill, binary node, latent.
33
─S: Slip rate of a particular student and a particular skill, binary node, latent. ─L: Learning of a particular student and a particular skill, binary node, latent. ─K1~Kn: Knowledge, binary node, latent.
─Q1~Qn: Question performance, binary node, latent.
The Student Skill model can easily be changed to consider the class information rather than the
student information by replacing the St node to be a class node (Cl), and the parameters StP, StG,
StS and StL will be turned into class prior (ClP), class guess (ClG), class slip (ClS) and class
learning rate (ClL).
Instead of simply using class information to replace the student information, which is still
considering only one resource of information, this paper combines these two models together to
explore whether knowing which class a student is in is a better predictor than knowing which
student, for each parameter in the model. For example, perhaps slip rate is best modeled at the
individual student level, while learning rate is best estimated at the class level? Therefore, we
have run experiments with different ways of combine the two resources of information trying to
determine which parameter is best modeled using which source of information.
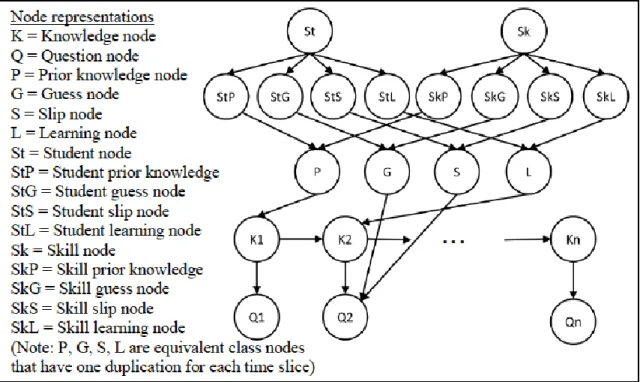
As shown in Fig. 2.4.2, the model is almost the same as the Student Skill model in Fig. 2.4.1. The
only difference is the addition of the class (Cl) node, which is a multinomial node, represents
which class a student is in. Nodes StP, StG, StS, StL turns into StP/ClP, StG/ClG, StS/ClS,
StL/ClL, which means the nodes can either be a student level parameter or a class level parameter.
The dash line between node Cl and node StP/ClP is a potential relationship in the model, as well
as the dash line between node St and node Stp/ClP. If we choose one of these two dash lines, the
other one will be ignored as if it does not exist. For example, if we choose to use class
information for prior knowledge, the dash line between St and node StP/ClP is ignored, and the
node StP/ClP only contains the class prior (ClP). The same assumption is hold for all the other
34
Based on this model, by choosing different dash lines, we can test the best combination of class
and student parameters and find the variability.
In our experiment, we used the Bayes Net Toolbox for Matlab developed by Murphy (Murphy,
2001) to implement the Bayesian network student models and the Expectation Maximization (EM)
algorithm to fit the model parameters to the dataset. The EM algorithm finds a set of parameters that maximize the likelihood of the data by iteratively running an expectation step to calculate
expected likelihood given student performance data and a maximization step to compute the
parameters that maximize that expected likelihood.
Fig. 2.4.2. Combination of Class Skill model and Student Skill model
Data and Model-fitting
The data used in the analysis presented here came from the ASSISTments platform
(www.assistments.org), a freely available web-based tutoring system for 4th through 10th grade
…
35
mathematics. The performance of a question is marked as wrong if the first response is incorrect,
or if the student asks for help.
We randomly sampled data of one hundred 12-14 year old 8th grade students from 4 classes and
fifty skills from the school year September 2010 to September 2011. There are in total 53,450
problem solved in the dataset.
To make sure there were sufficient data in the training set to estimate parameters for students and
skills, we divide the dataset into a training set and a test set using the following strategy: for each
student, for every skill that she was practicing we flipped a coin and assigned this student-skill
pair into either the training set or into the testing set. This process enables us to have a broad
coverage of students and skills in the training set, to enable generalization to the testing set.
However, we do not have data for the same student-skill pair in both the training and in the
testing data. In this way, we maintain a relatively independent test set, but still enable our
approach to see enough types of data to estimate all of the required parameters.
In the experiment, we estimate each knowledge tracing parameter using data about the skill, and either data about this student‟s or the student‟s classmates‟ performance on this skill. Thus, for
each parameter we tried two ways of estimating its value. We examined each combination of
settings for all four knowledge tracing parameters (P, G, S, L) To simplify the problem, we group
the performance parameters, guess and slip, together. This leaves us in total 23= 8 different combinations in parameters. The models and experimental results are shown in the next section.
Results
The accuracy of the predictions was evaluated in terms of the Root Mean Squared Error (RMSE),
with lower values meaning higher accuracy. We compared different models to analyze the best
individualization level for prior Knowledge (K0), learning rate (L) and Guess and Slip (G/S) respectively. That is, for each of the parameters (K0, L, G/S), we choose Class level
36
individualization or Student level individualization, there are in total 8 possible combinations.
The different combination models and their RMSE results on the test set are shown in Table 2.4.1.
The first column shows which parameter is chosen for the prior knowledge, the second column
shows which parameter is chosen for the learning rate, the third column shows which parameter is
chosen for the performance parameters (guess and slip), the fourth column shows the RMSE result of each model on the test dataset. We order the rows in this table based on the RMSE on
the test set, with the top rows representing higher accuracy on the test set.
Table 2.4.1. RMSE result on test and training data
K0 L G/S RMSE
Class Student Class 0.413
Class Class Class 0.415
Class Student Student 0.417
Class Class Student 0.419
Student Student Student 0.421
Student Student Class 0.423
Student Class Class 0.424
Student Class Student 0.425
For comparison, the standard Knowledge Tracing model produces an RMSE of 0.428 on the test
data, which is less accurate than all of the models we experimented with in Table 2.4.1.
Therefore, it appears that both of the class level and the student level individualization can help
improve Knowledge Tracing‟s predictive accuracy.
A second point of comparison is our baseline Student Skill model, represented in the 5th row in this table (underlined), which represents estimating all of the parameters using information about
each student. Thus, each student has a customized estimate of prior knowledge (K0), learning (L), and guess (G) and slip (S), as they are derived from the student node. In this case, model in Fig.
37
2.4.2 degenerates to be the same as the Student Skill model in Fig. 2.4.1. The fact that this model
is only at the middle of the table shows that, it is not as strong as other methods of estimating
parameters.
In other words, sometimes it is better to use the class information rather than using individual
student information. This result could occur if students within a class do not vary very much on a particular parameters. In that case, it would be better to estimate that parameter for the entire class
to take advantage of the larger quantity of data. For example, the fact that the 4th row, which has prior and learning comes from class information, and guess and slip comes from the student
information results in lower RMSE value on the test data than the 5th row, indicates that the prior knowledge and learning rate may be better estimated through the class information rather than
estimated from completely individualization of student. Back to the example at the beginning of
this paper, this means that for prior knowledge, and guess and slip rate, knowing the information
of all of the other students in the class may be slightly more beneficial than only knowing the
information of the current student. If all of the other students in the class do not know a skill
initially, it is more likely the current student do not know the skill either, no matter how good the
student is on other skills.
Among all of these models, the best mode (the first row in the table) is the one with prior
knowledge (K0) and performance parameters (guess and slip) derived from the class information,
and the learning rate (L) is derived from individual student information. The result seems
plausible because all students in a class normally get the same instruction, thus might have similar
prior knowledge (K0) about a particular skill, and some students learn faster than others, thus the
learning rate (L) would be beneficial from individual student information. To be clear, we are not
asserting that all students have the same prior knowledge, as some students will not complete homework or might not pay attention in class. However, within a class, prior knowledge varies