B2B eCommerce: an empirical
investigation of information
exchange and firm performance
Tobin E. Porterfield
College of Business and Economics, Towson University,
Towson, Maryland, USA, and
Joseph P. Bailey and Philip T. Evers
R.H. Smith School of Business, University of Maryland,
College Park, Maryland, USA
Abstract
Purpose– The purpose of this study is to evaluate the performance effects of information exchange by
observing actual information exchange between industrial trading partners. Information exchange facilitates coordination through sharing both order cycle and enhanced information. Increased exchange may lead to closer relationships with the expectation of improved performance. This study moves away from perceived measures of information exchange and firm performance by integrating two datasets: one capturing historical firm performance and the second capturing electronic information exchange data.
Design/methodology/approach– Quantitative data of electronic information exchange between
firms are observed and compared with operational performance results. Longitudinal regression analyses are conducted using data gathered from an electronically-mediated industrial exchange network. This unique dataset provides distinct insights into the application and performance outcomes related to information exchange.
Findings– Results show that information characteristics vary by firm and the position of the firm
within the supply chain. Manufacturers benefit from exchanging more basic information and from stability in their trading partner portfolio. Retailers enhance performance when there is more turnover in their trading partner portfolio and when information is exchanged reciprocally with suppliers.
Practical implications– Results from this study provide insight into the potential performance
outcomes of sharing information within industrial relationships. The study demonstrates how greater information exchange changes the nature of supply chain relationships. Closer supply chain relationships may improve firm performance, but the extent of this varies based on the firm’s position within its supply chain. Consequently, firms should consider the strategic implications of the way in which they exchange information with their trading partners.
Originality/value– This study contributes to the literature by identifying and testing specific
information characteristics using actual observed exchanges of information between firms. The data set supports the measurement of information exchange between multiple firms and trading partners which allows for testing at a level of granularity beyond existing studies.
KeywordsInformation exchange, Supply chain management, Industrial relations, Electronic commerce,
Transaction costs, Business performance
Paper typeResearch paper
The current issue and full text archive of this journal is available at
www.emeraldinsight.com/0960-0035.htm
The authors would like to thank Brian Lowell, University of Maryland – University College, and Phil Goldberg for their assistance in collecting and validating the EDI data.
B2B eCommerce
435
Received September 2009 Revised February 2010 Accepted March 2010
International Journal of Physical Distribution & Logistics Management Vol. 40 No. 6, 2010 pp. 435-455 qEmerald Group Publishing Limited 0960-0035 DOI 10.1108/09600031011062182
Introduction
The exchange of information between firms underlies supply chain coordination. (Holweg and Pil, 2008). In order for firms to coordinate their supply chain operations, they need to be aware of their trading partner’s activities. For example, research has identified a positive connection between information exchange and the adoption of best practices (Zhou and Benton, 2007), the mitigation of the bullwhip effect (Leeet al., 1997; Cachon and Fisher, 2000; Machuca and Barajas, 2004; Steckel et al., 2004), and the improvement in overall firm performance (Zsidisin et al., 2007; Hsu et al., 2008). Exchanging information is often enabled through the use of information technology (IT) (Skipperet al., 2008). IT spans the boundaries between firms and has been noted for its role in lowering the cost of exchanging information (Clemons et al., 1993; Clemons and Row, 1992). In a supply chain context, IT has been found to contribute to decreased inventory investment (Mukhopadhyayet al., 1995), reduced shipment errors (Srinivasanet al., 1994), and improved customer service (Allenet al., 1992).
Supply chain research is increasingly examining the critical role of information exchange and the role of IT in facilitating this exchange. Much of the previous literature exploring the value of information exchange in a supply chain, however, has been limited to perceived measures obtained from surveys (Morgan and Hunt, 1994; Frohlich and Westbrook, 2001; Whipple et al., 2002; Lumsden and Mirzabeiki, 2008). These studies use either binary measures or scaled measures to capture the presence or degree of information exchange. Similarly, studies that model information exchange often include it as a binary measure (Cachon and Fisher, 2000) or focus on limited aspects such as its application to process change within a specific industry (Holweg and Pil, 2008). A growing literature has extended these findings by analyzing the role of IT in aiding information exchange among trading partners. Researchers investigating specific IT measures of information exchange have found that information exchange volume is positively associated with trading partner relationship survival (Porterfieldet al., 2009). Additionally, in a study of manufacturing firms, it was found that information exchange volume has a positive effect on firm performance while information diversity has a negative effect (Porterfield, 2008). This study extends the existing research by examining additional characteristics of information exchange including closeness, reciprocity, and concentration. In so doing, the study makes a contribution by establishing the connection between specific information exchange characteristics and firm performance across a broad range of firms and industries at multiple echelons of the supply chain.
Theoretical background and hypotheses
Transaction cost economics (TCE) provides a foundation for understanding the role of IT-enabled information exchange in coordinating supply chain relationships. As firms within the supply chain attempt to coordinate their efforts, transaction costs are incurred (Williamson, 1975). Foundationally, TCE recognizes that firms incur additional costs by exchanging with external firms in the supply chain rather meeting their needs internally. Economies of scale, product licensing, or other cost factors may require that a firm seek inputs from external suppliers. If firms must transact with outside suppliers, they will seek the most efficient governance mechanism to organize their external transactions and minimize transaction costs (Grover and Malhotra, 2003). All else being equal, using technology within a supply chain context can alter the transaction
IJPDLM
40,6
volume/cost relationship such that firms may lower overall costs by transacting electronically outside the boundaries of the firm (Clemons and Row, 1992; Clemonset al., 1993). With TCE theory as a foundation and extant research support, hypotheses are presented to expand the understanding of how specific information exchange characteristics contribute to firm performance.
This paper uses TCE to develop four characteristics of information exchange and their effects on firm performance:
(1) the degree of closeness between trading partners; (2) the magnitude of churn among trading partners; (3) the extent of reciprocity between trading partners; and (4) the level of concentration among trading partners.
Each of these characteristics is explored in more detail in the following four subsections. Closeness
The literature on the impact of close versus arms-length relationships on firm performance provides mixed results. Relationships are often characterized by the frequency of transaction and the volume of information exchange that occur between participants (Webster, 1992; Barry and Crant, 2000; Morgan and Hunt, 1994). Business-to-business (B2B) relationships have been evaluated based on a continuum of relational closeness. At one end of the continuum are “arms-length” relationships depicted by discrete market transactions and limited information exchange (Webster, 1992; Lambert et al., 1996b). As the continuum moves away from arms-length relationships, closer relationships are identified which include partnerships, joint ventures, and vertical integration (Lambert et al., 1996b). Outcomes of these close trading partner relationships may include improved quality, innovation, responsiveness, and trust (Rozenzweig et al., 2003). Information exchange allows firms to coordinate their activities and potentially improve their performance. For example, a supplier may share inventory quantity information with a customer so that the latter is able to delay purchasing materials and adopt an ordering policy that more closely resembles a “just-in-time” ordering policy.
The benefits of close relationships with trading partners are often derived from the coordination of resources between firms. In the context of collaborative supply chain relationships, firms can improve cost performance, quality, and revenue (Whippleet al., 2002; Anderson and Narus, 1990; Goffin et al., 2006). The exchange of information within those inter-firm linkages is noted as foundational for coordinating resources (Spekmanet al., 1998).
TCE literature suggests that close relationships between buyers and suppliers are more prone to opportunism than arms-length relationships (Williamson, 1975). Opportunism is defined as self-serving actions of firms which may cause harm to other parties. In B2B exchanges, the supplier may take advantage of its position and extract additional profits from the transaction. An example would be if a firm has only one supplier for a particular input. If the supplier chooses to act opportunistically, the supplier may push some of its inventory on to the customer or even refuse to fulfill a customer order. When a supplier acts opportunistically, one would expect the customer’s performance to be negatively impacted. The customer could experience a decrease
B2B eCommerce
in inventory turnover as a result of excess inventory that is either being pushed by the supplier or is being held to account for likely under-fulfillment or non-fulfillment of its resupply requests.
Additionally, supply chain literature has recognized that pursuing close relationships with all trading partners may not be beneficial to the firm (Lambertet al., 1996a, b; McCutcheon and Stuart, 2000). Forming and maintaining close relationships with trading partners requires the use of limited firm resources that may not be either available or best invested in relationship management. Some studies suggest that close relationships be pursued with trading partners that are capable of building a relationship (feasibility) and where there is significant benefit to the firm (desirability) (McCutcheon and Stuart, 2000). Since existing theory can support either a positive or negative association of the use of close relationships and performance, the following hypotheses are proposed:
H1. The greater use of close trading partner relationships ispositivelyassociated with firm performance.
H1a. The greater use of close trading partner relationships isnegativelyassociated
with firm performance. Churn
From a strategic purchasing perspective, research has focused on the benefits of a long-term orientation between a firm and its trading partners (Chenet al., 2004). Benefits accrue when a long-term perspective fosters cooperation, reduces functional conflict, and improves decision making (Morgan and Hunt, 1994). Alternatively, a short-term relationship focus squanders relationship benefits as firms expend resources to protect themselves against potential opportunistic actions by their trading partners (Ghoshal and Moran, 1996).
Moreover, firms incur costs to add or remove trading partners from their supply chain. When a firm’s portfolio of trading partners is unstable due to the continual termination and creation of relationships, resources are expended in managing inter-firm processes rather than reaping the benefits of the relationship. Thus:
H2. Greater trading partner churn is negatively associated with firm performance. Reciprocity
Firms may strategically choose whether to exchange information with their trading partners. The ability to withhold information from trading partners has been identified as a source of power in relationships (Shapiro and Varian, 1998). Conversely, the exchanging of information with trading partners has been associated with the development of stronger inter-firm relationships (Frohlich and Westbrook, 2001; Morgan and Hunt, 1994). Research on the development of inter-firm relationships notes that balanced dyadic information exchange is indicative of strong relationships (Lambertet al., 1999).
In the context of electronically-mediated information exchange, the flow of information can be bi-directional. Each participant in the network has the opportunity to send and receive information. While transactions sent by one trading partner are always received by another, there is no assurance that the latter partner reciprocates by sharing its information. Prior research has recognized the detrimental effects of imbalance
IJPDLM
40,6
in the exchange of information both in retaining the benefits by one participant (Cachon and Zhang, 2006) and in deterring the formation of a long-term orientation in the relationship (Corsten and Kumar, 2005). In practice, a manufacturer may integrate its customer’s demand forecast into its production scheduling process but decide not to provide the production schedules back to the customer for input into the customer’s supply planning processes.
Prior studies have identified the importance of information visibility in the creation of integrated supply chain relationships (Rozenzweiget al., 2003; Frohlich and Westbrook, 2001). Although the intensity of trading partner integration has been found to be positively related to business performance (Rozenzweiget al., 2003), the balance of the information exchange has not been fully developed and tested empirically. Therefore:
H3. Greater reciprocity of information exchange is positively associated with firm performance.
Concentration
The concentration of market share is of great interest to industrial organization (IO) researchers. Concentration is a measure of how the market share is distributed among competing firms. From an IO perspective, the concentration of market share by a few market participants is an indication of low market competition. Fragmentation of market share, on the other hand, is the condition where neither a single firm nor a small number of firms holds the bulk of the market. Therefore, market share fragmentation is an indication of high market competition.
The concentration of information exchange is similarly important in a supply chain context since it recognizes whether firms focus their information exchange activities with select trading partners or fragment their information exchange by sharing information across their portfolio of trading partners. Although firms may exchange information with each of their partners, the information exchange is not necessarily equally distributed across the portfolio of trading partner relationships.
Supply chain relationship literature suggests that performance is enhanced by forming close relationships with key partners while keeping others at arms-length (Lambertet al., 1996b). The trend of concentrating procurement activities with a smaller supply base has been copied from the Japanese and has been identified as a strategic procurement trend starting in the 1990s (Trent and Monczka, 1998). This is an adaptation of the keiretsu strategy whereby firms work in closely knit groups characterized by cooperation, trust, and long-term relationships (Hanna and Newman, 2007). Focusing scarce firm resources with fewer trading partners is a strategic effort to ensure that information is used in the best interests of the firm. Consequently:
H4. Greater information exchange concentration is positively associated with firm performance.
Measures
This study empirically tests the effects of information exchange characteristics on firm performance while controlling for exogenous factors. Specifically, the characteristics of closeness, trading partner churn, reciprocity, and concentration are measured and compared to performance. The following sections describe how the four characteristics, firm performance, and control variables are measured.
B2B eCommerce
Closeness measurement
Research has recognized the movement of firms away from discrete market (arms-length) relationships toward what has been termed the “extended enterprise” where firms form ties with other firms beyond their own boundaries (Bowersox and Daugherty, 1987). This model has been empirically tested through an in-depth analysis of firms extending these connections (Edwardset al., 2001). The study found that firms generally pursued one of two strategies regarding their supply chain relationships: traditional cost-based (arms-length) relationships or collaborative approaches. A key characteristic of these supply chain relationships was the amount of information exchanged. Arms-length relationships were noted for limited knowledge transfer and inferior comparative performance. Leading companies in the study took the collaborative approach where the exchanging of information was standard practice.
For purposes of this study, a firm’s use of close trading partner relationships is measured based on the types and volumes of information exchanged. The types of information exchange are defined by two functional groups (Porterfieldet al., 2009). Order cycle information is defined as the foundational information exchanged to transact business between two firms. This type of information has been identified in prior research for its role in decreasing lead times and decreasing the cost of paperwork (Mukhopadhyayet al., 1995; Porter and Millar, 1985).
Enhanced information is distinct from order cycle information because of how it is used in the supply chain. Enhanced information is used to support the coordination of inter-firm resources (Cachon and Lariviere, 2001; Cachon and Fisher, 2000). In a previous study, researchers recognized that additional information including forecasts, daily demand, inventory positions, and shipment information can be exchanged between firms (Anguloet al., 2004).
An iterative process was undertaken to distinguish order cycle information exchanges from enhanced information exchanges. An initial categorization was provided to the electronic data interchange (EDI) network integrator based on the American National Standards Institute and United Nations standard transaction identifiers and descriptions. Three account executives provided individual feedback on the groupings based on their knowledge of how the transaction types are used by firms on the network. The researchers then made modifications to the initial categorizations and returned the revised groupings for additional feedback.
Separating the types of information into two groups recognizes that firms can vary the information exchanged in a B2B relationship depending on the specific trading partner. While firms may provide information to all trading partners, they do not necessarily provide the same types of information to each. Accordingly, it is important to separate out the different types of information exchanged between a buyer and supplier. This study separates them into two types: order cycle information and enhanced information. Order cycle information is defined as information that is more operational or tactical in nature. This includes transaction information such as purchase orders and requisitions. Enhanced information is more strategic in nature and includes information like inventory and forecast data. Figure 1 shows how the various EDI transactions were classified into these two types. Each of these information types has a corresponding standardized EDI document type code which identifies the information included in the transmission.
IJPDLM
40,6
The information exchange matrix presented in Figure 2 characterizes trading partner relationships based on their volumes of exchange of order cycle information and enhanced information. The mean values of information exchange volume for order cycle and enhanced information exchange are identified for each technology champion firm based on the data provided by the EDI network integrator. By comparing the exchange volumes for each dyad, trading partner relationships can be characterized as operating either above or below the mean for each information exchange category. Trading partners that are above the firm mean for both order cycle and enhanced information exchange are recognized as having closer relationships relative to other trading partners exchanging with the technology champion firm. From an information
Figure 1. Information exchange types Buyer Supplier Enhanced information Performance review Inventory inquiry Promotion announcement Shipping schedule Production sequence Testing report Advanced shipment notice
Planning schedule Product activity data Order cycle information
Requisition Purchase order PO change request PO confirmation Invoice Freight invoice Remittance advice Credit adjustment Open order report
Figure 2. Information exchange matrix Lo w High Low High Order c ycle information Enhanced information I. Transactional relationships II. Close relationships IV. Enhanced relationships III. Arms-length relationships
B2B eCommerce
441
exchange matrix perspective, these firms would be found in quadrant II (close relationships).
The proportion of a technology champion firm’s trading partner relationships that are assigned to quadrant II represents a measure of the technology champion firm’s use of close trading partner relationships. This operationalization of trading partner relationship closeness is an extension of the perceived measures used in survey-based research (Edwardset al., 2001; Fawcettet al., 1996).
Churn measurement
The churn rate is a measure of the stability of the trading partner portfolio. The trading partner churn rate is the ratio of the number of terminated relationships to the total number of relationships that the technology champion firm participated in during the period. A higher relative churn rate represents a less stable trading partner portfolio. This variable is calculated based on the EDI data provided by the network integrator as follows: CHURNit ¼ Terminated_Relationshipsit Total_Relationshipsit ð1Þ where:
i ¼ the technology champion firm. t ¼ the time period.
Reciprocity measurement
Information exchange in an electronically-mediated network can be measured directionally. From the perspective of the technology champion firm, each transaction is either sent by the champion firm or received by it. The technology champion firm’s strategy of withholding and receiving information is characterized by the balance between the volume of information transactions received and the volume of information transactions sent during the period. The resulting ratio is a measure of the balance between information received from and information sent to the trading partners drawn from the data provided by the network integrator. By taking the absolute difference of the received and sent volume divided by the total volume, a scaled measure of balance is provided: RECIPROCITYit¼ Receive_Volumeit2Send_Volumeit j j Total_Volumeit ð2Þ
As the value approaches “1” there is greater imbalance in their exchange of information. When the value approaches zero, there is balance between the sending and receiving of information by the technology champion firm during the quarter.
Concentration measurement
Concentration measures are used in the IO and strategy literatures to measure how market share is allocated between market participants (Collins and Preston, 1969; MacDonald, 1987). In IO studies, the measure identifies whether a market is concentrated or fragmented. The concentration measure is used as a proxy for the level
IJPDLM
40,6
of competition in a given market. The Herfindahl-Hirschman index (HHI) measures the market concentration by taking into account both the number of firms participating in the market and the inequality of the market shares. HHI uses the sum of the squares of the market share of all firms in the market or industry. The resulting value is multiplied by 10,000. Using this approach, HHI approaches zero for fragmented markets and 10,000 for concentrated markets.
This study applies the HHI approach to the characterization of information exchange practices by technology champion firms. The concentration measure provides an indication of whether information is being exchanged equally with all trading partners in the firm’s portfolio (fragmented) or if information exchange is focused (concentrated) on relatively few trading partners. Using the same convention as the HHI measure, concentration is a function of the sum of the squares of each trading partner’s information share for the period as calculated from the data provided by the network integrator: CONCENTRATIONit¼ X information_share2ijt h i £10;000 ð3Þ
wherej ¼ the trading partner. Firm performance measurement
This study measures firm performance as inventory turnover, which is a traditional measure of asset productivity and is calculated as the ratio of a firm’s cost of goods sold to its inventory value during the quarter as reported in the Compustat database. Inventory turnover is often used as a performance measure for empirical supply chain research (Droge and Germain, 2000; Kalwani and Narayandas, 1995; Rajagopalan and Malhotra, 2001; Leeet al., 1999; Mukhopadhyayet al., 1995). This study follows similar studies of supply-chain-related firm performance by recognizing that the measuring of intermediate variables which are directly related to the process of interest is more appropriate than focusing on final performance measures such as return on investment (Leeet al., 1999; Mukhopadhyayet al., 1995; Zhu and Kraemer, 2002).
Control variable measurement
The first control variable is firm size. Studies have recognized that larger firms experience economies of scale in their inventory turnover such that there is a positive correlation between inventory turnover and firm size (Gauret al., 2005). Firm size may be measured as total assets, sales, and the number of employees, all of which have been found to be highly correlated (Zhu and Kraemer, 2002). For purposes of this study, firm total assets reported quarterly in the Compustat database are used to measure size.
Sales surprise is the second control variable. Unexpected demand events affect a firm’s inventory turnover. If sales are higher than anticipated, then average inventories will be driven down during the period resulting in a higher reported inventory turnover ratio. Similarly, if sales are lower than anticipated, inventories will be inflated during the period resulting in a lower reported inventory turnover.
The effects of sales surprise were specifically addressed and found to be significantly, positively related to inventory turnover performance (Gauret al., 2005). Sales surprise is a function of the difference between management’s forecast of sales and actual sales experienced during a specific time period. Actual sales by quarter were provided
B2B eCommerce
from the Compustat database. Unfortunately, since a firm’s sales forecast is not publicly reported, an appropriate forecast proxy must be used (Gaur et al., 2005). Forecasts for each firm were generated using both the moving average and exponential smoothing forecasting methods. Since the number of periods included in a moving average forecast may vary, three time periods were tested (two quarters, four quarters, and six quarters). Forecast accuracy was measured using mean squared error and mean absolute deviation. Both forecast accuracy measures showed that the moving average method using four periods of data generated the least forecasting error. As a result, this study uses a moving average forecast method with four periods of historic data to estimate the sales for each quarter (Gauret al., 2005).
In accordance with past research (Gauret al., 2005), sales surprise is measured as the simple ratio of actual observed sales for a period to the sales forecast for the period. The resulting measure indicates the relationship between forecasted and actual sales:
SURPRISEit¼
Actual_Salesit
Forecasted_Salesit
ð4Þ
Values between zero and one indicate a forecast that under estimates sales. A value of one indicates that the forecast exactly estimated sales and a value greater than one indicates that the forecast overestimates sales.
The third control variable is seasonality. Depending on the focal industry, inventory turnover can be affected by the seasonality of sales. In the retail trade, for example, firms may intentionally build up inventory in anticipation of large selling seasons such as the winter holidays or may be left artificially low after a strong selling season. For purposes of this study, dummy variables are used to control for quarterly seasonality.
The final control variable is prior period inventory turnover. One of the greatest drivers of inventory turnover during a given period is the inventory turnover in the prior period. This firm level effect is controlled by including the prior period inventory turnover in the regression. Use of this lagged performance variable controls for any additional sources of firm level heterogeneity.
Data and model
While data on the control variables and firm performance comes from Standard and Poor’s Compustat database, data for the measurement of B2B information exchange is gathered from an electronically-mediated industrial exchange network. Prior research has recognized the role of computer-based systems for the exchange of inter-firm information (Massetti and Zmud, 1996; Vickeryet al., 2004; Iacovouet al., 1995). When information is exchanged electronically, specific measures of exchange characteristics may be captured which allow for the testing of hypotheses at various levels of observation (Porterfield, 2008).
In the past, information exchange has been treated as a uni-dimensional measure. Previous binary measures of information exchange only recognized whether an exchange of information occurred or not (Cachon and Fisher, 2000). Survey research expanded the measurement of information exchange, modeling it as a perceived measure to which scaled responses are collected and thus allowing for the study of information with greater refinement by measuring multiple exchange characteristics (Massetti and Zmud, 1996). Whereas previous research on information exchange has been limited to binary or perceived measures or to case level analysis, this study employs a unique dataset
IJPDLM
40,6
which provides objective measures of multi-firm information exchange that are often not available to researchers. This distinctive dataset has been made available by one of the world’s largest providers of B2B integration services, portions of which have been used to support research on trading partner relationship survival and the effects of information diversity on firm performance (Porterfieldet al., 2009).
The specific network used to provide data for this analysis supports the information exchange between 39 technology champion firms and their trading partners. These firms are identified as technology champions due to their leadership role in the development, maintenance, and expansion of the EDI interorganizational system (IOS) with their trading partners (Iacovouet al., 1995; Truman, 1998). This study uses the termtrading partnerto describe both suppliers and customers of the technology champion firms.
This industrial exchange network uses EDI technology to exchange business information. EDI is a specific IOS which supports the exchange of business information using standard formats. An EDI standard is a specific format for translating discrete business documents into electronic messages. Each business document type is defined using an EDI standard format. Purchase orders, invoices, shipping notices, demand data, and hundreds of other business documents are specifically defined for transfer between firms and are identified using a unique transaction code. EDI transaction codes have been used to distinguish types of information in similar research (Crumet al., 1998; Johnsonet al., 1992; Porterfield, 2008).
The dataset provided by the EDI network integrator includes all EDI transactions for two years. Researchers have noted that firms can employ multiple methods and technologies to exchange information with their trading partners (Vickeryet al., 2004). This being the case, the EDI network which provided the data may be neither the sole nor the primary exchange technology used by a particular technology champion firm. In situations where the focal EDI network is not the primary exchange technology, changes in the data exchanged through the network may be confounded by the firm’s use of alternate channels. Thus, either the absence of order cycle data or the lack of reciprocal information exchange (or both) is considered an indication that the EDI network is not a primary exchange channel for the technology champion firm. To minimize the effects of including firms where alternate technologies are in place, the 39 technology champion firms included in this study were examined to ensure that reciprocal order cycle data was exchanged on the network.
The data is maintained by the EDI intermediary at a summary level for each dyadic relationship by month. Each observation identifies the technology champion firm, trading partner, EDI transaction type, volume of that transaction type, and the direction of the exchange (send or receive). The monthly measures are aggregated to the calendar quarter in order to match the quarterly firm data provided from the Compustat database. The resulting dataset includes panel and time series observations for each technology champion firm across the eight quarters of the study period. This dataset design violates the ordinary least squares assumption of independent observations so a generalized least squares regression (GLS) is used to estimate the coefficients and test the hypotheses (Hitt, 1999; Mukhopadhyayet al., 1995). Tests for skewness and kurtosis indicated that the assumption of normality in their distributions was violated so the variables were transformed using a natural log function. The resulting model is as follows:
B2B eCommerce
logðINVENTORY_TURNOVERitÞ ¼b0þb1logðCLOSENESSitÞ
þb2logðCHURNitÞþb3logðRECIPROCITYitÞ þb4logðCONCENTRATIONitÞ þX n i¼0 giControlVariablesit ð5Þ Results
The descriptive statistics reported in Table I provide a summary of the data collected for each of the technology champion firms included in the sample. The dependent variable, INVENTORY TURNOVER ranges from 1.26 for a pharmaceutical manufacturer to 94.56 for a manufacturer of high tech equipment. By including firms from three echelons of the supply chain across multiple time periods, the sample captures a wide range of firm performance levels. The descriptive statistics for the explanatory variables (CLOSE, CHURN RATE, RECIPROCITY, and CONCENTRATION) represent a wide range of activity. The greatest variability is found in the CONCENTRATION measure which ranges from a low of 51.36 to a high of 6,441, indicating that the sample includes firms that exchange data equally across their trading partners and others that concentrate their information exchange with select trading partners. Firms in the sample vary in the reciprocity of information exchanged with their trading partners. The RECIPROCITY measure ranges from a low of 0.0032, denoting a balance in sending and receiving information, to a high of 0.66, denoting a relative imbalance. Similarly, firms vary in their stability of trading partners as measured by the CHURN RATE, ranging from a stable level of 0.0072 to a relatively dynamic trading partner pool of 0.5862. The descriptive statistics presented in Table I are stated in their unlogged form for ease of interpretation.
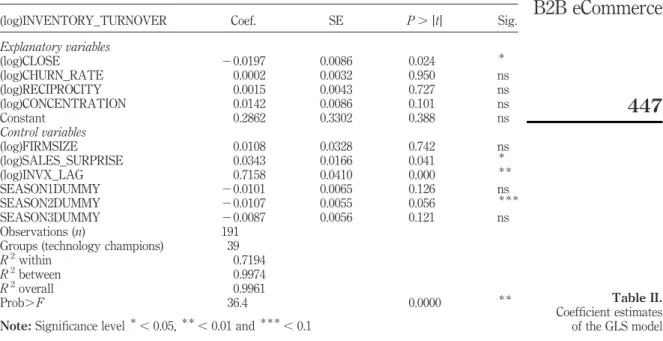
Regarding the regression results, statistics from the GLS model are provided in Table II. The proposed model fits the data well based on the statistically significant results of theF-test. The overallR2indicates that the model explains 99.6 percent of the variance in inventory turnover. The explanatory power of the model is not surprising
Mean SD Min Max
Inventory turnover 8.3588 14.4869 1.2630 94.5590 Closeness 0.4662 0.2209 0.0192 0.8724 Churn 0.0744 0.0716 0.0072 0.5862 Reciprocity 0.3362 0.2129 0.0032 0.9291 Concentration 1,100.98 1,093.15 51.36 6,440.91 Control variables Total assets ( ’000) 18,303.71 15,501.83 1,003.35 63,076.00 Sales surprise 1.0577 0.1551 0.6936 1.7553
Prior inventory turnover 1.7008 0.7263 0.2270 4.5492
Season dummy 1 0.1780 0.3835 0.0000 1.0000
Season dummy 2 0.3298 0.4714 0.0000 1.0000
Season dummy 3 0.3141 0.4654 0.0000 1.0000
Note:Number of observations¼191
Table I.
Descriptive statistics
IJPDLM
40,6
given the use of certain control variables (namely, prior period inventory turnover) to capture sources of variation apart from the hypothesized variables. All 39 technology champion firms are included in the sample, however, since some firms left the network prior to the end of the study period the firm-period combinations resulted in 191 observations.
The coefficient for the measure of firms using close trading partner relationships, CLOSENESS, is statistically significant and negative. This result provides support forH1a. The coefficients for the remaining three explanatory variables (CHURN RATE,
RECIPROCITY, and CONCENTRATION) are not statistically significant, indicating thatH2throughH4are not supported. Statistically significant and positive coefficients were estimated for the control variables SALES SURPRISE, PRIOR INVENTORY TURNOVER, and one of the three seasonality dummy variables.
Analysis
The statistical analysis provides strong support for one of the four hypotheses. The following discussion of the statistical results highlights the implication of these findings and provides the results of apost-hocstratified analysis of the data.
Hypotheses results
This study finds an important connection between the nature of supply chain relationships and firm performance. Since the literature does not have a clearly hypothesized relationship between these two variables, this study proposed hypotheses in both directions. The results support H1a: greater use of close trading partner
relationships is negatively related to firm performance. This result helps confirm some of the prior literature on this subject that describes the benefits of arms-length
(log)INVENTORY_TURNOVER Coef. SE P.jtj Sig.
Explanatory variables (log)CLOSE 20.0197 0.0086 0.024 * (log)CHURN_RATE 0.0002 0.0032 0.950 ns (log)RECIPROCITY 0.0015 0.0043 0.727 ns (log)CONCENTRATION 0.0142 0.0086 0.101 ns Constant 0.2862 0.3302 0.388 ns Control variables (log)FIRMSIZE 0.0108 0.0328 0.742 ns (log)SALES_SURPRISE 0.0343 0.0166 0.041 * (log)INVX_LAG 0.7158 0.0410 0.000 * * SEASON1DUMMY 20.0101 0.0065 0.126 ns SEASON2DUMMY 20.0107 0.0055 0.056 * * * SEASON3DUMMY 20.0087 0.0056 0.121 ns Observations (n) 191
Groups (technology champions) 39
R2within 0.7194
R2between 0.9974
R2overall 0.9961
Prob.F 36.4 0.0000 * *
Note:Significance level*,0.05, * *,0.01 and * * *,0.1
Table II. Coefficient estimates of the GLS model
B2B eCommerce
relationships to supply chain management (McCutcheon and Stuart, 2000; Lambertet al., 1996b; 2004) and contradicts other literature that describes the benefits of close relationships (Goffinet al., 2006; Anderson and Narus, 1990; Whippleet al., 2002). This result suggests that firms may see a decrease in their performance by increasing their use of close trading partner relationships.
Stratified analysis
An additional post-hoc analysis is provided to further refine the impact of close relationships by considering the effects separately for three echelons of the supply chain (manufacturers, wholesalers, and retailers). The sample is stratified based on the designation of each technology champion firm as being either being manufacturer, wholesaler, or retailer. The stratified sample produced the coefficient estimates shown in Table III. The fit of all three regressions is significant based on their F-statistic.
The inventory performance of manufacturers is negatively affected by the use of close trading partner relationships as measured by CLOSENESS. This result may be related to the particular supply needs of manufacturers. Research into the relationship between buyers and suppliers has recognized that the complexity of inputs affects both the governance of the relationship and the implementation of electronic integration (Mukhopadhyay et al., 1995; Hess and Kemerer, 1994). When more complex or specialized inputs are required, asset specificity may become a factor whereby the close relationships create an environment for opportunistic behavior by the trading partner (Williamson, 1975).
Interestingly, when the data is stratified by echelon, the coefficient for the stability of the trading partner network becomes statistically significant. The stability of the trading partner portfolio, as measured by CHURN RATE variable, has a negative effect on inventory turnover for manufacturing firms. Again, this may be related to the types of inputs and processes used by manufacturers that are unique from those used in other echelons of the supply chain. The investment in time needed for relationships to develop in order to maintain appropriate flow and quality of inputs for manufacturers may be adversely affected by high levels of instability in the trading partner portfolio. The positive coefficient estimates for SALES SURPRISE and PRIOR INVENTORY TURNOVER are expected as discussed previously for the full network model results.
The wholesaler echelon model is also statistically significant based on the F-statistic; however, the coefficients estimated for the explanatory variables are not. The coefficient for the prior inventory turnover variable is statistically significant and positive as previously discussed for the full network model results. The lack of statistically significant coefficient estimates for the explanatory variables is very likely related to the small number of wholesaler observations included in the sample (n¼30).
The fit of the retailer model is statistically significant based on the F-statistic, with coefficient estimates that vary from those for the manufacturing echelon. Retailers do not show a significant relationship between the use of close trading partner relationships and inventory turnover. Unique to the retailer echelon, the balance of sending and receiving information, RECIPROCITY, is positively related to INVENTORY TURNOVER. Contrary to the results for manufacturers, retailers are found to have a positive relationship between CHURN RATE and INVENTORY TURNOVER. This positive relationship may be related to the type of inputs used by retailers. Since retailers often resell standard products, retailers may be more price-driven such that instability
IJPDLM
40,6
Manufacturers Wholesalers Retailers (log)INVENTORY_TURNOVER Coef. SE P . j t j Sig. Coef. SE P . j t j Sig. Coef. SE P . j t j Sig. Explanatory variables (log)CLOSE 2 0.0193 0.0090 0.036 * 2 0.0703 0.0530 0.204 ns 2 0.0339 0.0236 0.161 ns (log)RECIPROCITY 2 0.0007 0.0049 0.894 ns 0.0375 0.0396 0.358 ns 0.0124 (0.0070) 0.086 *** (log)CONCENTRATION 0.0065 0.0102 0.527 ns 0.0098 0.0235 0.683 ns 0.0278 0.0170 0.112 ns (log)CHURN_RATE 2 0.0088 0.0040 0.031 * 0.0039 0.0094 0.687 ns 0.0088 0.0051 0.091 *** Constant 0.0068 0.5119 0.989 ns 0.6437 1.0435 0.547 ns 0.8937 0.3516 0.015 * Control variables (log)FIRMSIZE 0.0216 0.0498 0.665 ns 2 0.0282 0.1156 0.810 ns 2 0.0736 0.0374 0.057 *** (log)SALES_SURPRISE 0.1724 0.0277 0.000 ** 0.0300 0.0604 0.627 ns 2 0.0460 0.0237 0.059 *** (log)INVX_LAG 0.8278 0.0546 0.000 ** 0.7573 0.1458 0.000 ** 0.0742 0.0606 0.000 ** SEASON1DUMMY 2 0.0057 0.0079 0.427 ns 2 0.0106 0.0156 0.508 ns 2 0.0218 0.0104 0.043 * SEASON2DUMMY 2 0.0137 0.0068 0.047 * 0.0014 0.0139 0.919 ns 2 0.0222 0.0101 0.034 * SEASON3DUMMY 2 0.0037 0.0071 0.603 ns 0.0033 0.0140 0.818 ns 2 0.0148 0.0088 0.101 ns Observations ( n ) 104 30 57 Groups (technology champions) 23 5 1 1 R 2 within 0.8033 0.8450 0.8677 R 2 between 0.9982 0.9831 0.8550 R 2overall 0.9976 0.9751 0.8436 Prob . F 29.00 0.000 ** 8.18 0.000 ** 23.62 0.000 ** Note: Significance level *, 0.05, ** , 0.01 and *** , 0.1 Table III. Coefficient estimates of the stratified GLS model
B2B eCommerce
in the trading partner portfolio allows the retailer to frequently renegotiate prices with their suppliers. This position may be complimented by the finding that close relationships do not have a statistically significant effect on inventory turnover but asymmetry of information has a positive effect. The positive coefficient for RECIPROCITY indicates that the difference between the volume of information received and sent is positively related to inventory turnover. Asymmetric availability of information has been noted for enabling firms to disproportionately retain the benefits of a business exchange (Clemons and Hitt, 2004). Research has found that asymmetries of information driven by the more powerful retailer may be overcome by the supplier as they become interdependent (Narayandas and Rangan, 2004). However, the retailer may not become dependent on individual suppliers if the churn rate is high. Lastly, and not surprisingly, the retailers in this sample experience seasonality in their business as shown by the statistically significant results for two of the seasonality control variables. The value of this insight is that the effect of the closeness of trading partners varies depending on the firm’s position within the supply chain, which has important implications for the supply chain management literature. Firstly, it demonstrates that, when examining supply-chain-related firm performance, researchers should include measures that describe the level of closeness of trading partners and control for the position of the focal firm within the supply chain. As this study finds, there is support for a negative association between trading partner closeness and firm performance for manufacturers but not specifically for wholesalers or retailers. Secondly, the study clarifies results from research on the use of enhanced information exchange. Subsequent studies should include specific measures of power to determine whether or not exchanging enhanced information could lead to negative supply chain performance as trading partners increase their powervis-a` -visone another. The effects of closeness may be moderated by other relational factors. These factors may include the age of the relationship, the level of dependence, and the reciprocity of information exchange. Thirdly, this finding highlights the importance of market forces in increasing firm performance. Research that models supply chain partners as monopolies (i.e. the Beer Game) may overstate the problems of supply-chain-related firm performance because they do not consider the benefits of market forces. In real-world settings, some firms may benefit from the use arms-length relationships.
The important finding of the study linking the value of arms-length relationships to firm performance has managerial implications. Firstly, managers may not want to rely too heavily on a small set of firms. Over time, this may only increase the power that a supplier has over its customer. Managers may be most sensitive to this power as it relates to more unique inputs such as those used by manufacturers compared to the inputs of retailers. However, managers should also recognize that relationship closeness can result in higher inventory costs. Secondly, if managers rely on a small set of close firms, they may want to structure their contracts such that incentives or penalties are included. The use of incentives and penalties may discourage opportunistic behavior on the part of the supplier. For example, a manager may ask a supplier for a service level agreement that specifies the minimum performance level or else be subject to penalties. Furthermore, the customer can give financial incentives if the supplier helps the customer achieve higher levels of performance. Thirdly, these results may encourage managers to be skeptical of “single-source” contracts. When looking to procure new
IJPDLM
40,6
material and services, a supply chain manger may want to ensure a plurality of suppliers to allow for the benefits of market forces to help improve firm performance.
Conclusion
This study makes valuable contributions to both research and practice. This study provides a unique theory-based analysis of actual information exchanges. The findings support the notion that, beyond the mere practice of exchanging information, specific characteristics of information exchange can be associated with firm performance. Additionally, the post-hoc analysis establishes that the performance effects of information exchange characteristics vary depending on the position of a firm within its supply chain. The positive effects of information exchange are supported but some cautions are identified. Specifically, the effects of trading partner portfolio stability/churn, reciprocity, and closeness vary by the firm’s position within the supply chain. Managers would be advised to consider the tradeoffs between information exchange that enhances performance and information exchange that allows trading partners to act opportunistically.
Limitations and future research
This study provides new insights by capturing specific information exchange characteristics stemming from detailed transactions that flow through an inter-organizational medium. This quantitative focus could be enhanced through the inclusion of information exchanged through other mediums of exchange including email, telephone, and face-to-face. Additionally, exploration of how the exchanged information is incorporated into systems and decision making processes of trading partners and technology champions may provide valuable insights into the strategic use of information exchange.
References
Allen, B.J., Crum, M.R. and Brauschweig, C.D. (1992), “The US motor carrier industry: the extent and nature of EDI use”, International Journal of Physical Distribution & Logistics Management, Vol. 22 No. 8, pp. 27-34.
Anderson, J.C. and Narus, J.A. (1990), “A model of distributor firm and manufacturer firm working partnerships”,Journal of Marketing, Vol. 54, pp. 42-58.
Angulo, A., Nachtmann, H. and Waller, M.A. (2004), “Supply chain information sharing in a vendor managed inventory partnership”,Journal of Business Logistics, Vol. 25 No. 1, pp. 101-20.
Barry, B. and Crant, J.M. (2000), “Dyadic communication relationships in organizations: an attribution/expectancy approach”,Organization Science, Vol. 11 No. 6, pp. 648-64. Bowersox, D.J. and Daugherty, P.J. (1987), “Emerging patterns of logistical organizations”,
Journal of Business Logistics, Vol. 8 No. 1, pp. 65-80.
Cachon, G.P. and Fisher, M. (2000), “Supply chain inventory management and the value of shared information”,Management Science, Vol. 46 No. 8, pp. 1032-48.
Cachon, G.P. and Lariviere, M.A. (2001), “Contracting to assure supply: how to share demand forecasts in a supply chain”,Management Science, Vol. 47 No. 5, pp. 629-46.
Cachon, G.P. and Zhang, F. (2006), “Procuring fast delivery: sole sourcing with information asymmetry”,Management Science, Vol. 52 No. 6, pp. 881-96.
B2B eCommerce
Chen, I.J., Paulraj, A. and Lado, A.A. (2004), “Strategic purchasing, supply management, and firm performance”,Journal of Operations Management, Vol. 22, pp. 505-23.
Clemons, E.K. and Hitt, L.M. (2004), “Poaching and the misappropriation of information: transaction risks of information exchange”,Journal of Management Information Systems, Vol. 21 No. 2, pp. 87-98.
Clemons, E.K. and Row, M.C. (1992), “Information technology and industrial cooperation:
the changing economics of coordination and ownership”, Journal of Management
Information Systems, Vol. 9 No. 2, pp. 9-28.
Clemons, E.K., Reddi, S.P. and Row, M.C. (1993), “The impact of information technology on the
organization of economic activity: the ‘move to the middle’ hypothesis”, Journal of
Management Information Systems, Vol. 10 No. 2, pp. 9-35.
Collins, N.R. and Preston, L.E. (1969), “Price-cost margins and industry structure”,Review of Economics and Statistics, Vol. 51, pp. 271-86.
Corsten, D. and Kumar, N. (2005), “Do suppliers benefit from collaborative relationships with large retailers? An empirical investigation of efficient consumer response adoption”,
Journal of Marketing, Vol. 69, pp. 80-94.
Crum, M.R., Johnson, D.A. and Allen, B.J. (1998), “A longitudinal assessment of EDI use in the US motor carrier industry”,Transportation Journal, Vol. 38 No. 1, p. 15.
Droge, C. and Germain, R. (2000), “The relationship of electronic data interchange with inventory and financial performance”,The Journal of Business Logistics, Vol. 21 No. 2, pp. 209-30. Edwards, P., Peters, M. and Sharman, G. (2001), “The effectiveness of information systems in
supporting the extended supply chain”,Journal of Business Logistics, Vol. 22 No. 1, pp. 1-27. Fawcett, S.E., Calantone, R. and Smith, S.R. (1996), “An investigation of the impact of flexibility on global reach and firm performance”, Journal of Business Logistics, Vol. 17 No. 2, pp. 167-96.
Frohlich, M.T. and Westbrook, R. (2001), “Arcs of integration: an international study of supply chain strategies”,Journal of Operations Management, Vol. 19, pp. 185-200.
Gaur, V., Fisher, M.L. and Raman, A. (2005), “An econometric analysis of inventory turnover performance in retail services”,Management Science, Vol. 51 No. 2, pp. 181-94.
Ghoshal, S. and Moran, P. (1996), “Bad for practice: a critique of the transaction cost theory”,
Academy of Management Review, Vol. 21 No. 1, pp. 13-47.
Goffin, K., Lemke, F. and Szwejczewski, M. (2006), “An exploratory study of ‘close’
supplier-manufacturer relationships”, Journal of Operations Management, Vol. 24,
pp. 189-209.
Grover, V. and Malhotra, M.K. (2003), “Transaction cost framework in operations and supply
chain management research: theory and measurement”, Journal of Operations
Management, Vol. 21, pp. 457-73.
Hanna, M.D. and Newman, W.R. (2007),Integrated Operations Management: A Supply Chain
Perspective, Thomson Southwestern, Mason, OH.
Hess, C.M. and Kemerer, C.F. (1994), “Computerized loan origination systems: an industry case study of the electronic markets hypothesis”,MIS Quarterly, Vol. 18 No. 3, pp. 251-75. Hitt, L.M. (1999), “Information technology and firm boundaries: evidence from panel data”,
Information Systems Research, Vol. 10 No. 2, pp. 134-49.
Holweg, M. and Pil, F.K. (2008), “Theoretical perspectives on the coordination of supply chains”,
Journal of Operations Management, Vol. 26, pp. 389-406.
IJPDLM
40,6
Hsu, C.-C., Kannan, V.R., Tan, K.-C. and Leong, G.K. (2008), “Information sharing, buyer-supplier relationships, and firm performance”, International Journal of Physical Distribution & Logistics Management, Vol. 38 No. 4, pp. 296-310.
Iacovou, C.L., Benbasat, I. and Dexter, A.S. (1995), “Electronic data interchange and small organizations: adoption and impact of technology”,MIS Quarterly, Vol. 19 No. 4, pp. 465-85. Johnson, D.A., Allen, B.J. and Crum, M.R. (1992), “The state of EDI usage in the motor carrier
industry”,Journal of Business Logistics, Vol. 13 No. 2, pp. 43-68.
Kalwani, M.U. and Narayandas, N. (1995), “Long-term manufacturer-supplier relationships: do they pay off for supplier firms?”,Journal of Marketing, Vol. 59, pp. 1-16.
Lambert, D.M., Emmelhainz, M.A. and Gardner, J.T. (1996a), “Developing and implementing supply chain partnerships”,The International Journal of Logistics Management, Vol. 7 No. 2, pp. 1-7.
Lambert, D.M., Emmelhainz, M.A. and Gardner, J.T. (1996b), “So you want to partner?”,Marketing Management, Vol. 5 No. 2, pp. 24-41.
Lambert, D.M., Emmelhainz, M.A. and Gardner, J.T. (1999), “Building successful logistics partnerships”,Journal of Business Logistics, Vol. 20 No. 1, pp. 165-81.
Lambert, D.M., Knemeyer, M.A. and Gardner, J.T. (2004), “Supply chain partnerships: model validation and implementation”,Journal of Business Logistics, Vol. 25 No. 2, pp. 21-42. Lee, H.G., Clark, T. and Tam, K.Y. (1999), “Research report. Can EDI benefit adopters?”,
Information Systems Research, Vol. 10 No. 2, pp. 186-95.
Lee, H.L., Padmanabhan, V. and Whang, S. (1997), “Information distortion in a supply chain: the bullwhip effect”,Management Science, Vol. 43 No. 4, pp. 546-58.
Lumsden, K. and Mirzabeiki, V. (2008), “Determining the value of information for different partners in the supply chain”,International Journal of Physical Distribution & Logistics Management, Vol. 38 No. 9, pp. 659-73.
McCutcheon, D.M. and Stuart, F.I. (2000), “Issues in the choice of supplier alliance partners”,
Journal of Operations Management, Vol. 18, pp. 279-301.
MacDonald, J.M. (1987), “Competition and rail rates for the shipment of corn, soybeans, and wheat”,Rand Journal of Economics, Vol. 18 No. 1, pp. 151-63.
Machuca, J.A.D. and Barajas, R.P. (2004), “The impact of electronic data interchange on reducing
bullwhip effect and supply chain inventory cost”, Transportation Research Part E:
Logistics and Transportation Review, Vol. 40 No. 3, pp. 209-28.
Massetti, B. and Zmud, R.W. (1996), “Measuring the extent of EDI usage in complex organizations: strategies and illustrative examples”,MIS Quarterly, Vol. 20 No. 3, pp. 331-45.
Morgan, R.M. and Hunt, S.D. (1994), “The commitment-trust theory of relationship marketing”,
Journal of Marketing, Vol. 58 No. 3, pp. 20-38.
Mukhopadhyay, T., Kekre, S. and Kalathur, S. (1995), “Business value of information technology: a study of electronic data interchange”,MIS Quarterly, Vol. 19 No. 2, pp. 137-56. Narayandas, D. and Rangan, V.K. (2004), “Building and sustaining buyer-seller relationships in
mature industrial markets”,Journal of Marketing, Vol. 68, pp. 63-77.
Porter, M.E. and Millar, V.E. (1985), “How information gives you competitive advantage”,
Harvard Business Review, Vol. 63 No. 4, pp. 149-60.
Porterfield, T.E. (2008), “Diversity in business-to-business information exchange: an empirical analysis of manufacturers and their trading partners”,Transportation Journal, Vol. 47 No. 3, pp. 36-47.
B2B eCommerce
Porterfield, T.E., Bailey, J.P. and Evers, P.T. (2009), “The impact of information exchange on supply chain relationships”, working paper, Towson University.
Rajagopalan, S. and Malhotra, A. (2001), “Have US manufacturing inventories really decreased? An empirical study”,Manufacturing & Service Operations Management, Vol. 3 No. 1, pp. 14-24.
Rozenzweig, E.D., Roth, A.V. and Dean, J.W.J. (2003), “The influence of an integration strategy on competitive capabilities and business performance: an exploratory study of consumer products manufacturers”,Journal of Operations Management, Vol. 21 No. 4, pp. 437-56.
Shapiro, C. and Varian, H.R. (1998), Information Rules: A Strategic Guide to the Network
Economy, Harvard Business School Press, Boston, MA.
Skipper, J.B., Craighead, C.W., Byrd, T.A. and Rainer, R.K. (2008), “Towards a theoretical foundation of supply network interdependence and technology-enabled coordination strategies”,International Journal of Physical Distribution & Logistics Management, Vol. 38 No. 1, pp. 39-56.
Spekman, R.E., Kamauff, J.W. Jr and Myhr, N. (1998), “An empirical investigation into supply
chain management: a perspective on partnerships”, International Journal of Physical
Distribution & Materials Management, Vol. 28 No. 8, pp. 630-50.
Srinivasan, K., Kekre, S. and Mukhopadhyay, T. (1994), “Impact of electronic data interchange technology on JIT shipments”,Management Science, Vol. 40 No. 10, pp. 1291-304. Steckel, J., Gupta, S. and Banerji, A. (2004), “Supply chain decision making: will shorter cycle
times and shared point-of-sale information necessarily help?”,Management Science, Vol. 50 No. 4, pp. 458-64.
Trent, R.J. and Monczka, R.M. (1998), “Purchasing & Supply Management: trends and changes throughout the 1990s”,Journal of Supply Chain Management, Vol. 34 No. 4, pp. 2-11. Truman, G.E. (1998), “An empirical appraisal of EDI implementation strategies”,International
Journal of Electronic Commerce, Vol. 2 No. 4, pp. 43-70.
Vickery, S.K., Droge, C., Stank, T.P., Goldsby, T.J. and Markland, R.E. (2004), “The performance implications of media richness in a business-to-business service environment: direct versus indirect effects”,Management Science, Vol. 50 No. 8, pp. 1106-19.
Webster, F. (1992), “The changing role of marketing in the corporation”,Journal of Marketing, Vol. 56 No. 4, pp. 1-17.
Whipple, J.M., Frankel, R. and Daugherty, P.J. (2002), “Information support for alliances: performance implications”,Journal of Business Logistics, Vol. 23 No. 2, pp. 67-82.
Williamson, O.E. (1975), Markets and Hierarchies: Analysis and Antitrust Implications,
The Free Press, New York, NY.
Zhou, H. and Benton, W.C. Jr (2007), “Supply chain practice and information sharing”,Journal of Operations Management, Vol. 25, pp. 1348-65.
Zhu, K. and Kraemer, K.L. (2002), “e-Commerce metrics for net-enhanced organizations: assessing the value of e-commerce to firm performance in the manufacturing sector”,
Information Systems Research, Vol. 13 No. 3, pp. 275-95.
Zsidisin, G.A., Voss, D.M. and Schlosser, M. (2007), “Shipper-carrier relationships and their effect on carrier performance”,Transportation Journal, Vol. 46 No. 2, pp. 5-18.
About the authors
Tobin E. Porterfield is an Assistant Professor of Supply Chain Management in the College of Business and Economics at Towson University. He received his PhD in Logistics from the Robert H. Smith School of Business, University of Maryland. His research interests include
IJPDLM
40,6
supply chain integration, the performance effects of lean and agile supply chain strategies, and the use of information in supply chain relationships. Tobin E. Porterfield is the corresponding author and can be contacted at: tporterfield@towson.edu
Joseph P. Bailey is a Research Associate Professor at the Robert H. Smith School of Business, University of Maryland. He received his PhD in Technology, Management, and Policy from MIT. His research interests include electronic markets, supply chain management, and telecommunications.
Philip T. Evers is an Associate Professor of Logistics Management at the Robert H. Smith School of Business, University of Maryland. He received his MBA from the University of Notre Dame and PhD from the University of Minnesota. His research interests include inventory management, transportation operations, and intermodal transportation issues.
B2B eCommerce
455
To purchase reprints of this article please e-mail:reprints@emeraldinsight.com