Cleveland State University
EngagedScholarship@CSU
ETD Archive2015
How Can Business Analytics Induce Creativity:
The Performance Effects of User Interaction with
Business Analytics
Tarek Soukieh
Follow this and additional works at:https://engagedscholarship.csuohio.edu/etdarchive Part of theBusiness Administration, Management, and Operations Commons
How does access to this work benefit you? Let us know!
This Dissertation is brought to you for free and open access by EngagedScholarship@CSU. It has been accepted for inclusion in ETD Archive by an authorized administrator of EngagedScholarship@CSU. For more information, please [email protected].
Recommended Citation
Soukieh, Tarek, "How Can Business Analytics Induce Creativity: The Performance Effects of User Interaction with Business Analytics" (2015).ETD Archive. 889.
HOW CAN BUSINESS ANALYTICS INDUCE CREATIVITY: THE
PERFORMANCE EFFECTS OF USER INTERACTION WITH
BUSINESS ANALYTICS
TAREK SOUKIEH
Bachelor of Business Administration Damascus University
March 1996
Master of Business Administration The University of Toledo
May 1999
submitted in partial fulfillment of requirements for the degree
DOCTOR OF BUSINESS ADMINISTRATION
at the
CLEVELAND STATE UNIVERSITY DECEMBER 2015
We hereby approve this dissertation for Tarek Soukieh
Candidate for the Doctor of Business Administration degree for the
Department of Information Systems and CLEVELAND STATE UNIVERSITY
College of Graduate Studies
________________________________________________ Dissertation Committee Chairperson, Dr. Raymond Henry
_____________________________ Department & Date
________________________________________________ Committee Member, Dr. Radha Appan
_____________________________ Department & Date
________________________________________________ Committee Member, Dr. Amit Ghosh
_____________________________ Department & Date
________________________________________________ Committee Member, Dr. Robert Whitbred
_____________________________ Department & Date
_________________ Student’s Date of Defense
DEDICATION
To
My parents, my wife, and my kids
This Research is dedicated to my parents, my wife and my kids, who encouraged me and helped me do this research. Special feelings of thanks to them as they always pray for me and encourage me to work hard.
My Parents: Thank you for your love and support throughout my life. I learned passion, dedication, and caring from you. I am blessed to have you as my parents. I cannot thank you enough nor give you back a small portion of what you have given me, I love you.
My Wife: Thank you for believing in me, for supporting my knowledge journey, and for your patience throughout this project. I will encourage you and support you in your studies. No words can do justice, I love you.
My kids: You inspired me to do more and go after a doctoral degree. Persistent and continued learning is the message I want to pass to you through this work. I love you all.
ACKNOWLEDGEMENT
“In The Name of Allah, The Beneficent, The Merciful. All praise is only Allah's, the Lord of the Worlds" (Quran, Chapter 1). I am grateful, thankful, and full of humbleness for Allah’s blessing me and my family with the energy to leave Damascus and come to Cleveland to pursue this dream. My intention is to please Allah through this work; I wish for His acceptance and pleasure. My aspiration was always to be following the footsteps of Prophet Mohammed, peace be upon him, who spent his life learning and spreading knowledge.
I would like to take this opportunity to thank a number of people. Firstly, Dr. Raymond Henry, my supervisor, who guided and helped me throughout the project. He has spent much time to help me with inspiring advice. Without his patient instructions, insightful criticism and expert guidance, the completion of this project would not have been possible.
Secondly, all information system department professors who helped me with resources and information required for my dissertation.
Lastly, all doctorate students, colleagues, and friends who were there to support me throughout classes and dissertation work.
vi
HOW CAN BUSINESS ANALYTICS INDUCE CREATIVITY: THE PERFORMANCE EFFECTS OF USER INTERACTION WITH BUSINESS
ANALYTICS
TAREK SOUKIEH
ABSTRACT
Most organizations today use business analytics systems mainly for efficiency; reducing cost by contacting the right customer, generating revenue by reducing churn, etc.
Nevertheless, business analytics holds promise in generating insights and in making users more creative in their decision making process.
Analytics technology is becoming sophisticated with very advanced technical capabilities. However, behavioral aspects (i.e. user interaction) of using business
analytics software have not reached the same level of sophistication. Very little research in this field discusses how to implement analytical systems and what outcomes will it produce.
We are looking at conditions that can enhance user interaction with business analytics systems leading to certain performance outcomes. We propose that the fit between users’ cognitive style (intuitive vs. rational), business analytics model representations (decision tree vs. clustering), and task type (convergent vs. divergent) can lead to efficiency but can have adverse effects on creativity because that might lead to mindlessness in the decision making process.
vii
TABLE OF CONTENTS
ABSTRACT ... vi LIST OF TABLES ... ix LIST OF FIGURES ... xi CHAPTER I ... 1 INTRODUCTION ... 1 CHAPTER II ... 8 LITERATURE REVIEW ... 8 2.1 Business Analytics ... 82.2 Cognitive Fit Theory ... 19
2.3 Mindfulness Theory ... 27
2.4 Cognitive Experiential Self Theory ... 30
2.5 Cognitive Style and DSS in earlier research ... 35
2.6 Technological Frames of Reference Theory ... 38
2.7 Creativity ... 40
CHAPTER III ... 45
RESEARCH MODEL AND HYPOTHESIS DEVELOPMENT ... 45
3.1 Variable Definitions ... 45 3.2 Model Development ... 54 CHAPTER IV ... 63 RESEARCH METHODOLOGY ... 63 4.1 Experiment Survey ... 63 4.2 Experiment Sample ... 64 4.3 Experiment Variables ... 65 4.4 Experiment Design ... 66 4.5 Creativity Construct ... 75
4.6 Analytics Frames of Reference Construct: ... 80
CHAPTER V ... 88
RESULTS AND DATA ANALYSIS ... 88
5.1 Cognitive Fit Model ... 89
viii
5.3 Post Hoc Analysis ... 93
5.4 Full Model (with continuous variables) ... 101
5.5 Sensitivity Analysis ... 103
CHAPTER VI ... 105
DISCUSSION AND IMPLICATIONS ... 105
6.1 Discussion... 105 6.2 Research Implications ... 107 6.3 Practical Implications ... 109 CHAPTER VII ... 113 FUTURE RESEARCH... 113 7.1 Contribution ... 113 7.2 Limitations... 115 CHAPTER VIII ... 116 CONCLUSION ... 116 REFERENCES ... 118 APPENDIX ... 131
ix
LIST OF TABLES
Table 1: Overview of Available Software for Statistical Analysis (Louridas & Ebert,
2013) ... 11
Table 2: Business Intelligence and Analytics Evolution Key Characteristics and Capabilities (Chen et al., 2012) ... 13
Table 3: Business Intelligence and Analytics Applications: From Big Data to Big Impact (Chen et al., 2012) ... 14
Table 4: Business Intelligence and Analytics Research Framework: Foundational Technologies and Emerging Research in Analytics (Chen et al., 2012) ... 15
Table 5: Differences Between Intuition and Analysis (Allinson & Hayes, 1996) ... 35
Table 6: Creativity construct definitions (Dean et al., 2006) ... 47
Table 7: Contrasting Mindfulness with Cognitive Fit ... 59
Table 8: Experiment Variables ... 66
Table 9: Two Way Fit Experiment Cells (Analytics Representation vs. Task) ... 67
Table 10: Three Way Fit Experiment Cells (Cognitive Style vs. Analytics Representation vs. Task) ... 67
Table 11: Four Way Fit Experiment Cells (Analytics Frames of Reference vs. Cognitive Style vs. Analytics Representation vs. Task) ... 67
Table 12: Fit Scenarios ... 69
Table 13: Inter-Rater Reliability on Sub-dimensions ... 77
Table 14: Correlations Among Sub-dimensions ... 77
Table 15: SEM Fit Indices ... 78
Table 16: Effects in Linear Equations ... 79
Table 17: Covariances among Exogenous Variables ... 80
Table 18: SEM Fit Indices for Analytics Frames of Reference ... 85
Table 19: Effects in Linear Equations for Analytics Frames of Reference ... 87
Table 20: Covariance Among Exogenous Variables for Analytics Frames of Reference 87 Table 21: Fixed Effects of Two Way Fit Model ... 90
Table 22: Least Squares Means of Two Way Fit Model ... 90
Table 23: Fixed Effects Model Results ... 92
x
Table 25: Significant Differences in Least Squares Means for Creativity ... 94 Table 26: Fixed Effects of the Full Model (with continuous variables) ... 102 Table 27: Interaction Effects of the Full Model (with continuous variables) ... 102
xi
LIST OF FIGURES
Figure 1: Business Intelligence and Analytics Related Publication Trend from 2000 to
2011 (Chen, Chiang, & Storey, 2012) ... 9
Figure 2: Tagcloud Visualization of Major Topics in the Business Intelligence and Analytics Literature (Chen et al., 2012)... 17
Figure 3: Cognitive Fit Model (Vessey, 1991) ... 20
Figure 4: Extended Cognitive Fit Model (Shaft & Vessey, 2006) ... 24
Figure 5: Extended Cognitive Fit Model (Shaft & Vessey, 2006) ... 25
Figure 6: Theory of Technology Dominance (V. Arnold, 1998) ... 26
Figure 7: Conceptual Model ... 38
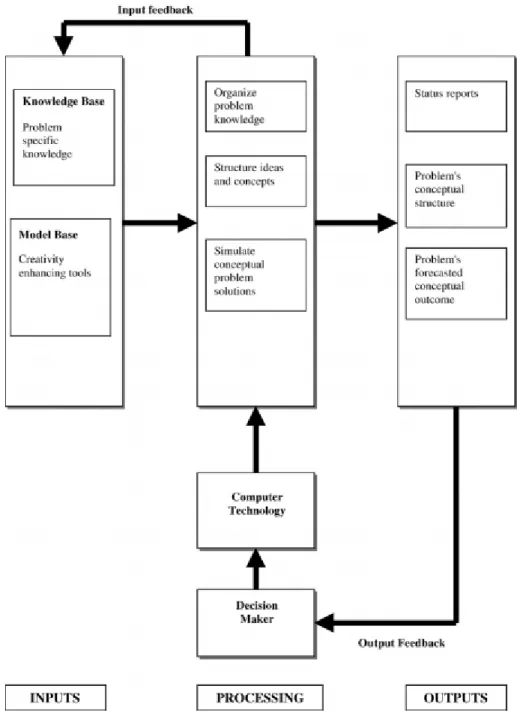
Figure 8: Creativity Enhancing Decision Making Support Systems (Forgionne & Newman, 2007) ... 43
Figure 9: Relationships Among Creativity Dimensions (Dean et al., 2006) ... 46
Figure 10: Divergent vs Convergent Tasks ... 54
Figure 11: Research Model ... 54
Figure 12: Mindlessness vs. Mindfulness Process ... 58
Figure 13: Components of Fit ... 61
Figure 14: Experiment Test ... 68
Figure 15: Experiment Design (Split Plot Design) ... 70
Figure 16: Gender Distribution ... 70
Figure 17: Age Distribution ... 71
Figure 18: Business Analytics Experience ... 71
Figure 19: Education Distribution ... 72
Figure 20: Decision Tree Experience Distribution ... 72
Figure 21: Clustering Experience Distribution ... 72
Figure 22: Cognitive Style Index Distribution... 73
Figure 23: Analytics Frames of Reference Distribution ... 73
Figure 24: Average Time Spent by Each Cognitive Style on the Two Analytics Outputs74 Figure 25: Average Time Spent by Each Cognitive Style using Clustering Output ... 75
Figure 26: Average Time Spent by Each Cognitive Style using Decision Tree Output... 75
xii
Figure 28: Correlations Among Items ... 85
Figure 29: Analytics Frames of Reference Construct SEM ... 86
Figure 30: Creativity Least Squares Means Estimates for Two Way Fit Models ... 90
Figure 31: Creativity LSMeans for Two Way Fit ... 95
Figure 32: Creativity LSMeans for Two Way Fit with Analytics Frames of Reference .. 96
Figure 33: Creativity LSMeans for Three Way Fit ... 97
Figure 34: Creativity LSMeans for Three Way Fit with Analytics Frames of Reference 98 Figure 35: Creativity LSMeans for Fit vs. No Fit Across Four Variables ... 100
1
CHAPTER
I
INTRODUCTION
Business analytics has emerged as a hot topic and is widely seen as the next big trend in
the information system field. Business Analytics is defined by Davenport (2010)as “the
broad use of data and quantitative analysis for decision making within organizations. It encompasses query and reporting, but aspires to greater levels of mathematical sophistication.” In a study done by The Data Warehouse Institute in 2009, “Advanced Analytics” was identified as having the highest growth in next generation trends.
The research report that appeared in MIT Sloan Management Review in fall 2011 discussed the role business analytics can play in attaining competitive advantage and the widening divide between companies who embraced business analytics and the ones who did not (Kiron, Shockley, Kruschwitz, Finch, & Haydock, 2011). One of the keys to business impact lies in the ability to turn analytics into insights that results in business action (Harriott, 2013). Davenport (2010) emphasized that analytics should help generate insights and design strategies that can help companies achieve competitive advantage.
Researchers have stressed the need to turn analytics output into actionable insights (Fayyad & Uthurusamy, 2002), (Pearson, 2012). Nevertheless, that is not happening
2
today because of different challenges facing analytics in unlocking insights (S. E. Arnold, 2013). Wilson (2009) notes that “turning analytics into insights is still a rarity, even in the US.”
Business analytics systems sit at the top of the information systems hierarchy. Information systems at the lowest level of the hierarchy should help users with automation and efficiencies of business processes (Laudon, Laudon, & Brabston, 2012). Information systems at the highest level of the hierarchy should help users generate insights and be creative in uncovering the future and designing strategies. Research in this area, however, has tended to look at efficiency as the performance effect of business analytics and decision support systems. Therefore, it is imperative that we research conditions that help business analytics users generate insights and become creative in their decision making.
Business analytics software is becoming sophisticated with very advanced technical capabilities. Nevertheless, the behavioral aspects (i.e. user interaction) of using business analytics software have not reached the same level of sophistication. Very little research in this field discusses how to implement analytical systems and what outcomes these systems will produce. In short, the human interaction with these new software technologies can have surprising and unpredictable results.
Practitioners have pointed out to the fact that user interaction and behavioral aspects are the major challenges facing implementations of business analytics. Fayyad (1996) identified user interaction and prior knowledge as major challenges to business analytics deployment. They highlight the challenge of creating environments that can help users
3
achieve their goals through matching appropriate tools and techniques. They also recommend a focus on human-computer interaction rather than automated systems. Researcher has noted how analytics users are increasingly asking the question of how to turn discovered information into action (Kohavi, Rothleder, & Simoudis, 2002). The main issues reported show that current solutions are very technical and users find it difficult to understand the outcome and what to do with it.
Academics have also pointed to the same challenges. “The form of output is yet another challenge. The inputs to advanced analytics include immense amounts of data but the output needs to be simple, concise, readable, and usable. Finding or designing a system that is able to analyze the data and return output in a way that is valuable to the end-users is extremely important”(R. Bose, 2009). “Since data mining usually involves extracting “hidden” information from a database, this understanding process can get somewhat complicated. Because the user does not know beforehand what the data mining process has discovered, it is much bigger leap to take the output of the system and translate it into an actionable solution to a business problem”(R. Bose, 2009).
Coll (1991) posit that the reason for the degrading effect of DSS on decision quality in several cases was that DSS systems are not deployed appropriately, and that user’s feel implicit criticism of their human abilities working with DSS systems. This is an indication that there is a lack of fit between user’s and DSS systems, and that DSS deployment process need to incorporate different – not only technical but also behavioral
– factors and enhance user interaction. Kriegel (2007) identified usability in business
analytics as a major challenge and pointed to the fact that users do not understand analytics algorithms and patterns. Additionally, researchers posit that the reason behind
4
deployment process failure is the failure of systems to allow managers to make decisions their own way (De Waele, 1978). As a result many managers complain that DSS systems are hard to understand, learn, and use (Sprague & Carlson, 1982).
Designers of business analytics investigate the data structure to decide on the best analytics methodology to use. Focusing on the data structure and not giving proper attention to the user’s cognitive style and the task in hand, makes designers of business analytics lose sight of the ultimate goal of business analytics which is to induce creativity and generate insight. We are proposing that designers should investigate user’s cognitive style and the task in hand to decide on the best analytics methodology to use.
In a latest article of IEEE computer graphics and applications, Choo (2013)argued the same thing:
“Researchers who design computational methods must realize that making an algorithm more interactive and interpretable in practical data analysis scenarios is just as important as addressing practical concerns such as the data’s maximum applicable size, computation time, and memory requirements.”
Researchers are developing the “Business Analytics Capability Model” that guides organizations in enabling BA to create value for organizations. Establishing a sound foundation of high quality, usable, and integrated data creates an enterprise BA capability. Organizations should focus their attention on three dimensions: people, process, and technology in order to turn this data into insights that drive business decisions (Wixom, Yen, & Relich, 2013). Empowering users across the organization with
5
pervasive, predictive real time analytics enables the transformation of insights (Nastase & Stoica, 2011).
Cognitive fit theory (CFT) provides a theoretical foundation of user interaction with business analytics and the interaction effect on performance. We need to understand three important dimensions of user’s interaction with business analytics: task, user, and technology. CFT can be used to show how fit between these variables leads to efficiency in decision-making outcomes. The models developed show that a match between the technology, the user, and the task will make decision making process more efficient. A mental model will be constructed easily when the match exist which helps decision maker in finding the solution.
Although cognitive fit research mainly addresses efficiency has not explored other performance effects such as creativity, the absence of cognitive fit may help us understand situations that will produce other outcomes. Not having a cognitive fit might not necessarily be a bad thing. Mindfulness research suggests that disrupting the mental model of the decision maker can help in immersing the decision maker in the current problem and to think thoroughly of the situation (E. J. Langer & Piper, 1987). While mindfulness might degrade efficiency, the benefit may be to spur more creative solutions by the user. We integrate mindfulness theory with CFT in our research model in order to explore cognitive fit effects on creativity outcomes and insights generated through analytics.
Cognitive fit research has focused on symbolic and spatial output across simple tasks and complex tasks. Predictive analytics methodologies produce output that is different than
6
the traditional business intelligence reporting output. Therefore, we will use decision trees and clustering as the two business analytics outputs. Decision trees exemplify the symbolic type of output, and clustering exemplifies the spatial type of output. The types of questions addressed with analytics move beyond simple and complex tasks. The tasks that will be tested in our research are convergent and divergent processes. These types of tasks allow us to examine creativity in a more direct way.
In order to be complete in our understanding of user interaction with business analytics and the performance effects, we will explore other potential causal mechanism that can have an influence. Cognitive experiential self-theory and technology frames of reference can shed light on the causal mechanism. Cognitive fit assumes that all users will experience fit the same way. Users differ in the approach they take to arrive at a decision. Several researchers stressed that individual user characteristics should play an important role in designing DSS systems (McKenney & Keen, 1974), (Davis & Olson, 1985). Vessey (1991) acknowledges that decision maker’s use different processes in different type of tasks, but individual decision making styles are not included as part of CFT. Cognitive styles are an individual’s consistent approach to organizing and processing information during thinking (Epstein, 2003). Cognitive experiential self-theory identifies two prominent approaches used by users to make a decision; experiential and rational (Epstein, 2003). Our research will explore how cognitive style influences cognitive fit effect on performance.
Technology frames of reference describe the non-contextual factors that work in the background and provide facilitating and restraining effects. Cognitive fit theory examines context specific cognitive components of the problem that directly affect the
7
understanding of the problem; while frames of reference examines surrounding cognitive factors that work in the background and have both facilitating and restraining effects. Cognitive fit looks at the mental model of the elements in the current situation; while technological frames of reference look at the mental model of the situation itself.
Research Question
Our research is looking at conditions that would make user interaction with business analytics improve insights generation (creativity).
We are investigating whether the fit between clustering output and divergent type of task, or between decisions trees output and convergent type of task, have a negative influence on creativity, and if the absence of this fit have a positive influence on creativity. We will also explore if cognitive style and analytics frames of reference amplify the above identified influences.
The first section will include a review of relevant research and theoretical foundation and will identify the research gap in extant research. The second section will give a definition of the variables used in the model. The third section will introduce the model. The fourth section will discuss the methodology proposed to test the model. The fifth section will go through research implication and then practical implications. At the end the conclusion will summarize the findings.
8
CHAPTER II
LITERATURE REVIEW
2.1 Business Analytics
Business analytics (BA) is a hot trend in computing and the number of books, white papers, webinars, and research reports indicate its importance (Watson, 2011). In late 1980s and early 1990s data warehousing and business intelligence (BI) were hot and BI was the umbrella term for technologies, processes, and applications that support decision making; nowadays, analytics is the umbrella term (Watson, 2011).
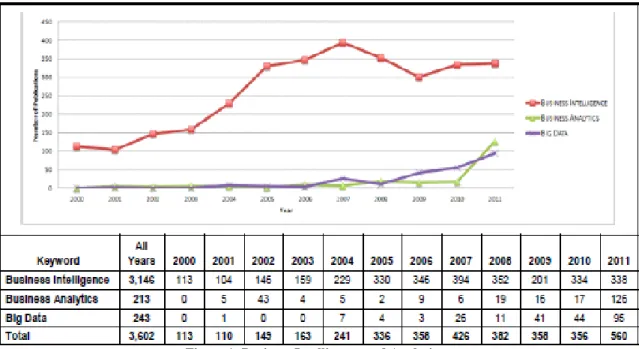
Big data is also hot and is changing the scope of BA. Organizations are trying to tap into structured and unstructured data sets coming from new sources like social networks, documents, emails, call centers, and websites. Software vendors are creating new generation business analytics that can be used with big data to deliver insights. Figure 1 below shows the rise in business analytics and big data in related research publications between the years 2000 to 2011.
9
Figure 1: Business Intelligence and Analytics
Related Publication Trend from 2000 to 2011 (Chen, Chiang, & Storey, 2012)
“Business analytics systems encompass the people, processes, and technologies involved in the gathering, analysis, and transformation of data used to support managerial decision making” (Cosic, Shanks, & Maynard, 2012). BA systems were defined by Negash (2004) by the use of advanced statistical analysis tools to discover patterns, predict trends, and optimize business processes.
“Business analytics allows organizations to face forward, bringing insight to transformative decisions” (Nastase & Stoica, 2011). It benefits all aspects of an organization’s value chain, including: inbound logistics, operations, outbound logistics, marketing and sales, and service” (Nastase & Stoica, 2011).
10
- Optimization analytics: mathematical programming like linear and integer
programming, and simulation.
- Predictive analytics: decision trees, CART, generic algorithms, and neural
networks.
- Descriptive analytics: data visualizations, dashboards and scorecards, drillable
OLAP reports, published reports, SQL queries.
Another interesting categorization of business analytics that is used by practitioners is: Data analysis and Traditional BI, and advanced analytics.
- Data Analysis and Traditional BI: “BI systems combine data gathering, data
storage, and knowledge management with analytical tools to present complex internal and competitive information top planners and decision makers.” (Negash, 2004). Traditional BI uses reports, dashboards, and visualizations to look at historical events which can inform decision making process.
- Advanced Analytics: “The overall process of turning low-level data – database,
textual, and Web – into high-level knowledge by extracting patterns or models from observed data. The mining of data in these three forms uncovers patterns in them using predictive techniques” (R. Bose, 2009).
11
A number of analytics software’s are available in the market today. Louridas and Ebert (2013) provided a list of the most popular statistical analysis shown in table 1. Their list shows how these software tools differ in terms of statistical sophistication required from their users, ease of use, and whether they are primarily stand-alone software packages or programming languages with statistical capabilities.
Table 1: Overview of Available Software for Statistical Analysis (Louridas & Ebert, 2013)
Watson (2011) notes that “analytics has a longer history than most people think” Over the years terminology has evolved to describe similar underlying tools and principles to decision support systems (DSS) (Watson, 2011). DSS is defined by Zwass (1998) as “an information system which is designed to support decision makers by applying decision
12
models to large collections of data.” This definition closely aligns with views of Business Analytics. While keeping a focus on Business Analytics; decades of DSS academic research to help frame our understanding of analytics. With limited prior academic research on business analytics, DSS research helps address the behavioral aspect of implementations (i.e. user interaction) with the technical features of systems.
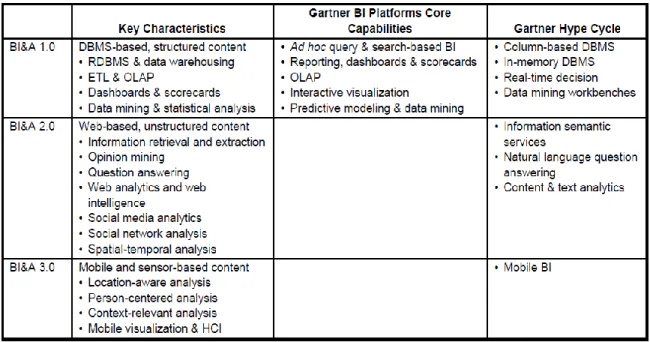
Business analytics is evolving and research opportunities are emerging as well (Chen et al., 2012). Analytics in the beginning was all about structured data that gets cleaned and transferred into an analytics data warehouse where the data is used for statistical modeling and then presented through interactive dashboards to users. Later, BA grew into social media and unstructured data sets, where text mining and social network analysis became paramount. The latest step in the evolution of BA is mobile visualizations and analysis. Analytics went from a focus on BI technologies in 1.0 into a focus on big data, and now 3.0 focuses is embedding analytics into products and offerings (T. H. Davenport, 2013). Analytics 3.0 according to Davenport (2013):
“Analytics 3.0 is a new resolve to apply powerful data-gathering and analysis methods not just to a company’s operations but also to its offerings—to embed data smartness into the products and services customers buy.”
13
Table 2: Business Intelligence and Analytics Evolution Key Characteristics and Capabilities (Chen et al., 2012)
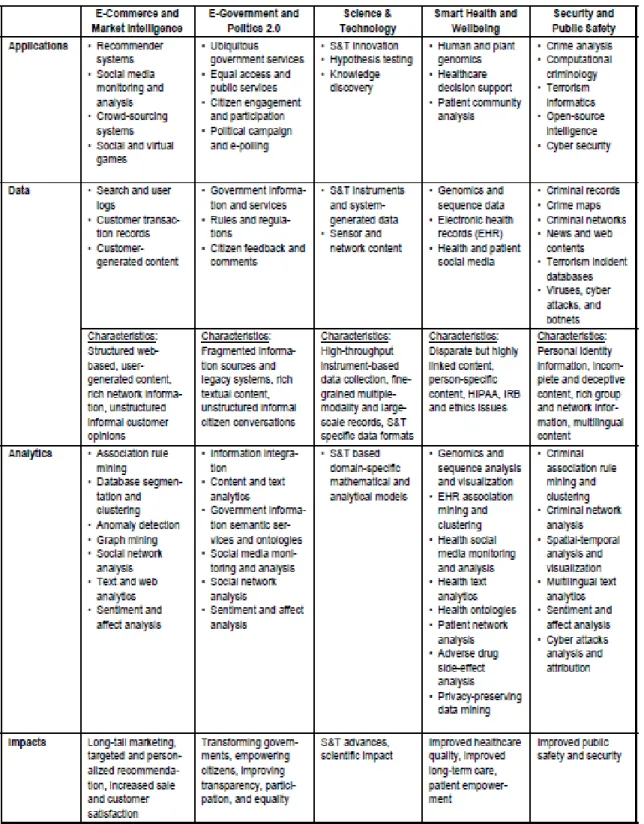
Analytics is penetrating a lot of disciplines and its applications are becoming widespread. Researchers are promoting the use of predictive analytics in information systems research where it can help in building theories and in creating useful practical models (Shmueli & Koppius, 2011). Society for learning analytics (SOLAR) is also promoting the use of analytics in learning and training and promoting an analytics culture inside educational institutions (Siemens, 2013). Table 3 shows the different applications of BA in e-commerce, e-government, science, health, and security (Chen et al., 2012).
14
Table 3: Business Intelligence and Analytics Applications: From Big Data to Big Impact (Chen et al., 2012)
15
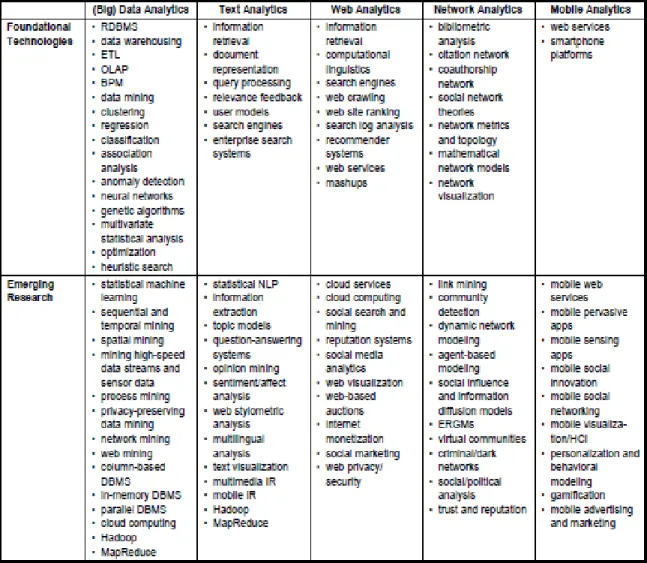
“Business Analytics Capability Model” focuses on three dimensions people, process, and technology that turn data into insights that drive business decisions (Wixom et al., 2013). Delivering value from BA technologies is a challenge that needs to be carefully managed. The market is advancing BA with progressive technologies and that is putting pressure on researchers to create research that uncover the potential of BA. The following table 4 by Chen (2012) shows a list of foundational technologies and emerging research in BA.
Table 4: Business Intelligence and Analytics Research Framework: Foundational Technologies and Emerging Research in Analytics (Chen et al., 2012)
16
BA is more than “nice-to-have” and is now a requirement for competing in the marketplace (Watson, 2011). Numerous case studies on business analytics have shown it can provide benefits to organizations by enabling improvement of business processes, firm performance, and creating competitive advantage (Kohavi et al., 2002). BA systems are essential for enterprises and companies’ failing to adopt BA systems have a big gap with their competitors (Kiron et al., 2011).
In “Competing on Analytics” book, Davenport gives numerous examples of very successful companies achieving competitive advantage through BA. Harrah’s Entertainment became an industry leader with a high profile analytics in areas such as customer profitability, expected lifetime value, campaign design and development, and customer segmentations. The following tag cloud shown in figure 2 shows competitive advantage as a topic discussed heavily in BA related tags. This tag cloud was generated from a list of publications from 2000-2011, these keywords were then ranked based on their frequency, and the top 30 keywords displayed using the tag cloud visualization. More important keywords are highlighted with larger fonts as shown in figure 2 (Chen et al., 2012).
17
Figure 2:Tagcloud Visualization of Major Topics in the Business Intelligence and Analytics Literature (Chen et al., 2012)
In the information systems hierarchy, a DSS system is a system layer that sits on top of the transactional processing systems (TPS)(Laudon et al., 2012). TPS manages and stores transactions and provides standardized reporting which helps in making short term decisions. TPS goal is to give managers the ability to audit operational processes and provide feedback so that these operational decisions can be made faster with fewer errors. DSS systems have a different goal. DSS produce advanced analytics and predictions so that top level managers can be innovative in their thinking process and can be creative in designing strategies. Knowing this, when DSS researchers addressed performance, they used efficiency as the outcome. In practice we see the majority of analytics software industry focusing mainly on using analytics to make faster decisions. While efficiency is an important performance outcome, creativity is another important performance outcome that has largely been overlooked.
Business analytics should help organizations unlock insights (Fayyad & Uthurusamy, 2002), (Pearson, 2012). However, many companies are facing challenges in turning analytics into actionable insights and many organizations are failing in the deployment of
18
analytics(S. E. Arnold, 2013), (Wilson, 2009). BA software vendors are successful in creating a new generation of BA systems that brings lots of capabilities and advanced algorithms to the market. Behavioral research on these new analytics technologies have not picked up in momentum yet (Montibeller & Durbach, 2013). User interaction with BA systems is a challenge and lots of research is needed (Fayyad & Uthurusamy, 2002). Research on user characteristics and the interaction with DSS was dominant in the 1980s, but it has winded down a lot after Huber (1983) criticism of the challenges to customizing DSS according to user’s cognitive style. The new theories in cognitive style, the new advances in the science about intuition and brain functions, and the new advances in BA technologies put pressure on researchers to advance the behavioral studies on user interactions with DSS.
Several studies show the benefits of BA to organizations, but they fail to offer theoretical explanations of the reasons these benefits occur (Cosic et al., 2012). Extant research on decision support systems’ (DSS) effectiveness produced contradicting results. Many researchers have demonstrated the positive effect DSS can have on decision quality (Sharda, Barr, & McDonnell, 1988), (Eckel, 1983), (McIntyre, 1982). At the same time, several researchers have shown that DSS use results in lower quality decisions (Coll et al., 1991), (Aldag & Power, 1986), (Goslar, Green, & Hughes, 1986), (King & Rodriguez, 1978), (Joyner & Tunstall, 1970). User interaction can provide benefits to understanding the way DSS generate benefits (Coll et al., 1991).
There are many challenges facing BA in the usability and user interaction discipline (Kriegel et al., 2007),(Fayyad & Uthurusamy, 1996). Turning BA results into actionable
19
insights is a major challenge and users do not understand BA output or what to do with it (Kohavi et al., 2002).
IBM recognized the need to focus on integrating analytics with human cognition to generate insights. IBM next big thing after Watson is “Cognitive Systems”. According to
IBM Research (http://www.research.ibm.com/cognitive-computing), Cognitive Systems
are categories of technologies that uses machine learning to enable people and machines to interact more naturally to extend and magnify human expertise and cognition. Cognitive systems will extend our cognition and free us to think more creatively and speed innovation. IBM held the first Cognitive System Colloquium in October 2013.
2.2 Cognitive Fit Theory
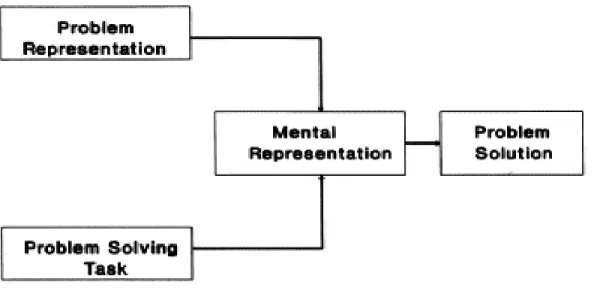
Cognitive fit theory was introduced by Vessey (1991); the theory proposes that the correspondence between task and information representation formats leads to superior task performance for individual users. Shaft and Vessey (2006) extended the cognitive fit theory and split information representation into internal representation and external representation of the problem domain.
How information is presented and the task characteristics affect how information is processed in working memory and the decision processes used to arrive at a decision outcome (Vessey, 1991). The theory suggests that efficiency and effectiveness of the problem solution depends on a fit between the problem representation and the problem solving task. Cognitive fit occurs when the decision processes required by the task match the decision processes supported by the problem representation. When cognitive fit occurs, a consistent and accurate mental representation of the problem results. This, in
20
turn Leads to more effective and efficient task performance. When the problem representation does not match the task, cognitive fit will not happen because similar decision processes cannot be used on both the problem representation and the task. As a result, the problem solver must exert additional cognitive load to solve the problem which will increase task time (Vessey, 1991),(Vessey & Galletta, 1991).
Figure 3: Cognitive Fit Model (Vessey, 1991)
According to Vessey (1991) the cognitive process of interest goes as follows: 1) when information representation, internally and externally, and task both assert similar types of knowledge, 2) this will lead the problem solver to formulate a consistent memory representation, and there will be no need for any mental representation transformation, 3) which will lead to a more effective and efficient problem-solving performance.
Internal representation is what the decision maker brings to the task based on prior knowledge and experience. External representation is the way the task is presented. Mental representation is represented in working memory and determines the decision
21
processes and strategies used during problem solving for task solution. Problem solving performance is usually captured in terms of accuracy or effectiveness.
Graphs are spatial problem representations, since they emphasize and provide visualizations of the relationships among the data and allow the user to view the data as an integrated unit. While tables are symbolic problem representations, since they present discrete data values (Vessey, 1991),(Vessey & Galletta, 1991). External representation used in cognitive fit papers has evolved through the years from graphs vs. tables into maps and multimedia. Tasks have been extended from spatial vs. symbolic to simple vs. complicated to estimations and projections.
Upon reviewing cognitive fit literature used in the information systems discipline, you can recognize the following observations relevant to our study phenomenon. First, creativity as a dependent variable was not discussed nor tested in the literature. Most of the studies used efficiency and effectiveness to measure the outcome of cognitive fit. Second, there is not enough research on the absence of cognitive fit and how that can affect different outcomes. It might be as interesting to research different outcomes when cognitive fit does not happen. Third, external representations variable in cognitive fit theory has moved beyond the traditional graph vs. table literature and has incorporated many different kinds of representation formats. Maps, lists, and spreadsheets are some examples. Fourth, task variable has also been tested in other than spatial and symbolic types. For example, analytics vs. holistic was used, and simple vs. complex. Fifth, IS researchers have extended cognitive fit theory by adding other variables to the original model and by incorporating cognitive fit theory as the base for other theories
22
development as in the technology dominance theory. In the following paragraphs, we will expand on the above observations in relevance to our study.
Information systems studies that used cognitive fit, measured the dependent variable in terms of efficiency in most cases. The dependent variable was measured using time and accuracy in majority of studies(Vessey & Galletta, 1991), (Dennis & Carte, 1998), (Mennecke, Crossland, & Killingsworth, 2000), (Speier, Vessey, & Valacich, 2003), (Speier, 2006), (Hock, Goswami, & Hee-Woong Kim, 2012), (Shen, Carswell, Santhanam, & Bailey, 2012). There are some IS studies that used other dependent variables. Adipat, Zhang, and Zhou (2011) used perceived ease of use and perceived usefulness as additional dependent variables. Intention to purchase and intention to return was used by (Kamis, ArnoldKoufaris,MariosStern, Tziporah, 2008). Up to our knowledge and upon a comprehensive investigation of research databases of all research papers that used cognitive fit theory– up to December of 2013 – we did not find any study which discussed or used creativity as the dependent variable or the outcome of cognitive fit variables.
The empirical research on cognitive fit used the absence of cognitive fit as the null hypothesis in the research model test, and the existence of cognitive fit as the alternative hypothesis of interest. This practice gives significant analysis and explanations of cognitive fit outcome, but does not provide sufficient analysis and explanations of the absence of cognitive fit. The null hypothesis is potentially rejected or disproved on the basis of the data that is significantly under its assumption, but the null hypothesis is never accepted or proved. Using absence of a relationship in the model allows the researcher to explore the causal mechanism that exists in the absence of this relationship and it allows
23
researchers to find subsequent results of this relationship. Accordingly, the absence of relationship becomes the alternative hypothesis and can then be tested and proved.
This is a research gap we found while investigating cognitive fit literature, therefore, we will research and explore the absence of cognitive fit as a phenomenon by itself. Our research will study and investigate the existence of cognitive fit in the first alternative hypothesis, and will research and test the absence of cognitive fit in the second alternative hypothesis. This will permit exploration of other interesting results such as creativity.
External representations in the earlier cognitive fit literature have moved beyond the graph and table formats. Some researchers used maps (Smelcer & Carmel, 1997), (Dennis & Carte, 1998), (Mennecke et al., 2000). Other researchers have used lists vs. matrix and spreadsheets (Hong, Thong, & Kar, 2004), (Goswami, Suparna Hock Chuan Chan Hee Woong Kim, 2008). Some have also used programming languages and modeling tools as the external representations (Sinha & Vessey, 1992), (Agarwal, Sinha, & Tanniru, 1996). Although many research studies used external representations other than table and graph; none of them used business analytics outputs – decision trees or clustering for example – in earlier studies.
In a similar way task has also been extended from spatial and symbolic in Vessey’s original research to many other task types. Some studies used searching vs. browsing tasks (Hong et al., 2004), others have used simple vs. complex (Speier et al., 2003), and analytics vs. holistic (Tuttle & Kershaw, 1998). Convergent vs. divergent task types are more pertinent to business analytics systems and the scenario researched in our study.
24
Shaft and Vessey(2006) used cognitive fit to understand software comprehension and modifications. They extended the model by distinguishing between the external and internal representations. Both representations and the interaction between them influence the mental representation for the task solution. Thus, cognitive fit depends on characteristics of internal problem representation, characteristic of the task, and presentation format.
Figure 4: Extended Cognitive Fit Model (Shaft & Vessey, 2006)
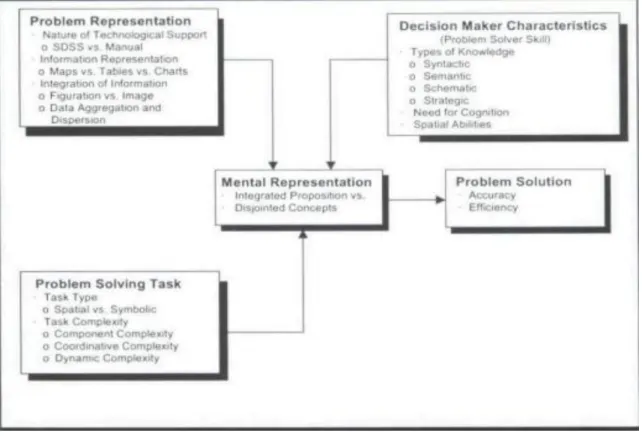
Mennecke(2000) also extended cognitive fit theory to incorporate additional variables – decision maker characteristics – to the original theory variables. The study investigated how the use of spatial decision support systems influenced the accuracy and efficiency of different type of problem solvers – professional’s vs. students – completing problems of varied complexities (Mennecke et al., 2000). Their study posits that individual characteristics, such as the different type of knowledge the decision maker has, should be part of cognitive fit. Subject characteristics were found to have significant effect on
25
performance. Similarly, our study will extend cognitive fit theory by adding cognitive style variable to the original model.
Figure 5: Extended Cognitive Fit Model (Shaft & Vessey, 2006)
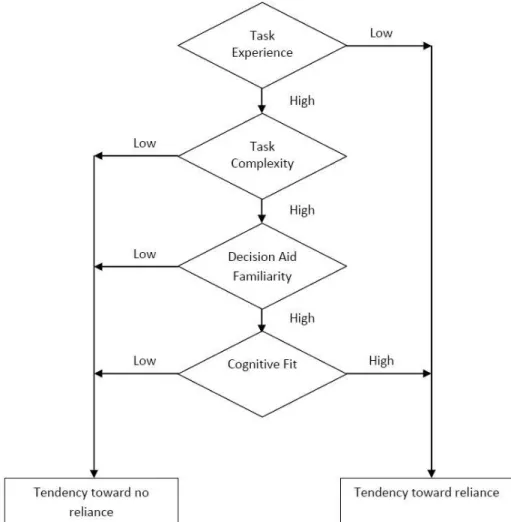
Cognitive fit theory has been used in developing other theories in information systems. Arnold (1998) developed the theory of technology dominance; where cognitive fit theory was one of the base theories they used in developing this theory. Theory of technology dominance says that a decision maker may become reliant on a decision aid when decision maker’s task experience is low or when decision maker’s task experience, task complexity, decision aid familiarity, and cognitive fit are all high. One of the developed propositions of this theory says that “when task experience and perceived task complexity
26
are high, there is a positive relationship between cognitive fit and reliance on the decision aid.”
Figure 6: Theory of Technology Dominance (V. Arnold, 1998)
An interesting concept we found during the review of cognitive fit is that decision performance might be more effective when mixing presentation formats on users. Kelton, Pennington, and Tuttle (2010) reviewed cognitive fit using accounting information systems and extended cognitive fit using feedback loops to learn repeated use of the
27
system. The authors pointed out that future research should check using a combination of external problem representations.
Cognitive fit gives a framework of the benefits for having a match between the variables which can help in digesting the problem and reaching a solution. The proposed match by this theory can enhance the time it takes to reach a solution and will require fewer resources to reach a solution. Nevertheless, cognitive fit did not measure other outcome indicators such as creativity. Cognitive fit can potentially have adverse effects on creativity since the user will depend on familiar mental models and might not pay attention to the distinctness of the situation. Integrating mindfulness theory can fill in this gap in cognitive fit theory and allow us understand causal mechanisms with the absence of cognitive fit.
2.3 Mindfulness Theory
Integrating theories will allow us to have a holistic view on the phenomenon. Using one theory to explain a phenomenon is rarely enough to present all contradictions and causal mechanisms. According to Robey and Boudreau (1999), “theories that use a logic of opposition, when coupled with appropriate research methodology, can make better sense of observed contradictions in empirical studies than theories that use deterministic logic” (Robey & Boudreau, 1999).
We will integrate cognitive fit theory with mindfulness theory as this represents an opportunity to uncover causal mechanisms working in this phenomenon. The juxtaposition of conflicting results forces researchers into a more creative,
frame-28
breaking mode of thinking than they might otherwise be able to achieve (Eisenhardt, 1989).
We wish to explore the different performance effect of user interaction with business analytics. Cognitive fit research shows performance in terms of efficiency and effectiveness, but does not show performance in terms of creativity. When we investigate creativity as a performance, the absence of cognitive fit becomes an interesting situation. The theory that can provide the causal mechanism behind cognitive fit and the absence of cognitive fit is mindfulness theory. Mindfulness research examines the phenomenon of not having an appropriate mental model for the task, and shows a degrading effect on efficiency but an enhancing effect on creativity.
Mindfulness theory is about paying attention to the information being presented in the moment, getting involved, and thinking thoroughly through the issue. Mindlessness is when the information is familiar with something that was experienced in the past, based on that the individual reaches a preconceived commitment to the conclusion (E. J. Langer & Piper, 1987).
Langer & Piper (1987) introduced mindlessness as well which posits that the repetition of routine situations would increase the chance of individuals making premature commitment to decisions. The perception of certainty introduced by familiar tasks hinders the attention of individuals to change. Individuals rely on the past and use categorizations schema to reach solutions. The advantage of mindlessness is that it improves efficiency and allows individuals to be faster in making decisions. The
29
disadvantage of mindlessness is the premature commitment to solutions which lowers the adaptability and competence of individuals in dynamic situations.
Mindfulness happens when individuals are presented with unfamiliar situations, they get motivated to think thoughtfully through the problem. The distinct nature of the problem invokes contextual thinking of individuals which would lead to innovative solutions. Individuals get immersed in the present and can look at the distinct nature of the problem at hand. The advantage of mindfulness is that individuals are able to reach reliable creative solutions. The disadvantage of mindfulness is that it is less efficient in terms of speed in comparison with mindlessness.
According to mindfulness theory, introducing similar situations to users over and over would lead to a lower level of mindfulness which would impede creativity. Butler and Gray (2006) talked about the negative effects of cognitive fit on creativity in the information systems context.
In solving problems, people try to find orderly routines they used in the past, and apply it to the current problem; hence, people tend to ignore surrounding information (Weick, Sutcliffe, & Obstfeld, 1999). The brain evaluates the problem and will try to apply familiar historical processes. Doing this will enhance efficiency since users can solve problems with less time. Minor variations between the current problem and the historical processes will become hard to detect.
If the brain is able to make a distinction between historical processes and current problem (distinction making), the brain realizes it cannot use the same historical processes to solve the current problem. The brain will involve locally in these distinctions made and will
30
scan the environment for more clue (environment scanning), until the brain finds a new process that can solve the problem. This newly created process is not totally new; it is based on a combination of some old processes and newly created processes.
2.4 Cognitive Experiential Self Theory
Vessey (1991) called for extending cognitive fit and for exploring other variables effect. An underlying assumption in cognitive fit is that all users will behave the same way in the fit phenomenon. Although Vessey mentioned the different thinking styles of users in her research, she did not include it in the model nor test for it, but she recommended extending cognitive fit later with more variables.
User interaction with business analytics should include three important dimensions in the study; the task, the technology, and the user. Designing successful DSS systems requires that developers pay attention to incorporating individual user characteristics (McKenney & Keen, 1974), (Davis & Olson, 1985). Adding user’s cognitive style to cognitive fit will add an important element to the current phenomenon studied.
We will intersect the cognitive fit theory with the cognitive experiential self-theory (CEST) in order to measure the “internal representation” of the problem domain construct. CEST posits that individual’s process information internally through two distinct information processing systems, experiential and rational. The two information processing systems are independent and operate by different rules (Epstein, 2003). Integrating this theory with cognitive fit can help in operationalizing the internal representation of the problem and it can give rigor to the analysis.
31
In the theoretical support of the theory, Vessey (1991) discussed two alternative information processing approaches identified in earlier literature. The first is a judgment holistic approach and the other is a choice attribute based information processing approach. The way people process information defined by Vessey and the way CEST theory defines the two alternative information processing approaches is in line.
Intuition is receiving a lot of attention in recent years. Klein(2003) explored the critical abilities of intuition and its effect on decision making. And a growing number of publications, i.e. (Hodgkinson & Clarke, 2007), studied intuition effect on organizational decision making and promoted ways to train managers on developing their intuition. An area of interest within this discipline is identifying the dominant cognitive style of managers. Allinson and Hayes (1996) developed psychometric measurement tools, cognitive style index (CSI), for identifying the dominant human cognitive style, intuitive vs. analytical.
Several measures have been developed to find the cognitive style of individuals. Some of these measures are: Myers-Briggs Type Indicator (Myers, 1962), Human Information Processing (W. M. Taggart & Torrance, 1984), and Personal Style Inventory (W. M. Taggart, Taggart-Hausladen, Taggart, & Taggart-Hausladen, 1991). The main issue with most of these measures is that they are cumbersome to be applied in organizational studies (Allinson & Hayes, 1996).
Allinson and Hayes (1996) designed the Cognitive Style Index to be used in organizational settings. While many cognitive style tools exist, we will adopt the Cognitive Style Index developed by Allinson and Hayes as our psychometric
32
measurement tool because of its simplicity, ease of use, and application in organizational settings.
Individuals have a rather permanent stylistic orientation to the use of one hemisphere (Allinson & Hayes, 1996). Epstein (1996) assert with evidence that rational and experiential processing are independent. They posit that “behavior and conscious thought are a joint function of two systems. The systems normally engage in seamless, integrated interaction, but they sometimes conflict, experienced as a struggle between feelings and thoughts. Other evidence of the existence of two modes of processing is that people are aware of two different ways of thinking.”
Hodgkinson and Clarke (2007) demonstrated the individual differences in information processing. The authors theoretically show that individuals think about decision problems and evaluate possible responses according to two processes. The first is a largely automated pre-conscious process, involving the development and deployment of heuristics and intuition. The second is a deeper, more effortful process, which entails the use of analytics. These two processes work in parallel to each other, and individuals have a preference toward one of these processes.
Cognitive style has been defined by Messick (1976) as “consistent individual differences in preferred ways of organizing and processing information and experience”. Intuition and Analysis are the terms used to describe the right brain and left brain thinking. According to Allinson and Hayes (1996), “Intuition, characteristic of the right brain orientation, refers to immediate judgment based on feeling and the adoption of global
33
perspective. Analysis, characteristic of the left brain orientation, refers to judgment based on mental reasoning and a focus on detail.”
34
INTUITION ANALYSIS
Non-conscious.
Learners are unaware that they are acquiring and using knowledge
Conscious
Learners are aware that they are acquiring and using knowledge
Automatic
Because learning and problem solving is a non-conscious process it happens
automatically and without any deliberate effort or attention.
Intentional/deliberate
Learning involves a deliberate and conscious effort to achieve understanding.
Non-selective
Intuition is non-selective because it draws on all available data and does not involve any conscious attempt to filter out any elements that appear to be irrelevant.
Selective
Analysis is selective because it involves attending to and thoroughly assessing only those elements of a situation that are perceived to be relevant
Unconstrained
Intuition is unconstrained because it includes the processing of non-salient associations between elements. These associations are so
Constrained Rule based/rational
Analysis is constrained because it is restricted to the processing of salient associations between elements. Because
35
Table 5: Differences Between Intuition and Analysis (Allinson & Hayes, 1996)
2.5 Cognitive Style and DSS in earlier research
Several decision support systems researchers have found that individual user characteristics should play an important role in the design and development of DSS systems (McKenney & Keen, 1974), (Davis & Olson, 1985). Other researchers exerted weak that they are below the threshold for
conscious awareness and therefore they are inaccessible to conscious control and logical manipulation.
learners are consciously aware of these associations, the processing of information tends to be much more rational and open to conscious manipulation.
Holistic (big picture),
Intuition is holistic in the sense that it focuses on the big picture and considers all elements of a situation simultaneously.
Segmented (focus on parts)
Analysis is a fragmented process in the sense that it involves considering all the separate parts of a situation in turn.
Synthesis and recognition of patterns
Intuition involves synthesizing data and recognizing connections that build to provide a non-conscious understanding of the rules and principles that govern a situation.
Logical search for connections
Analysis involves a search for connections that entails a conscious step-by-step application of rules or other systematic procedures and/or the formulation and testing of hypotheses.
36
evidence that task characteristics, structured versus unstructured, are the important factors that should influence DSS use and design (Chervany & Dickson, 1978), (Huber, 1983), (Webby & O'Connor, 1994). We examined the role of both, user characteristics and tasks, in enabling better DSS outcome through the lenses of cognitive fit theory.
Chakraborty, Hu, and Cui (2008) found that user cognitive style has a significant direct effect on technology acceptance constructs: ease of use, usefulness, and subjective norms. User cognitive style has been proven important in understanding intentions to use a technology. We are extending these studies which looked at user cognitive style effects, by looking at how cognitive style can also affect DSS outcome.
Extant research has shown that managers will not use DSS systems which do not allow them to make decisions according to their style (De Waele, 1978), (Sprague & Carlson, 1982). Whereas, Huber (1983) argued that cognitive style influence on DSS design is exaggerated. His argument was that cognitive style has not been developed well enough to be used in system design and is lacking a foundational theory to support it. And he said that systems will become very flexible in the future which can fit the different cognitive styles of users. Going forward in history, many researchers have developed several instruments that can identify the cognitive style of individuals, and cognitive-experiential self-theory of personality was developed. Additionally, research is still showing that DSS is still predominantly supporting the analytical cognitive style, but is still lagging in incorporating the intuitive cognitive style. This undermines Huber’s call for stopping research on cognitive style and DSS design (Huber, 1983).
37
Lu, Yu, and Lu (2001) investigated cognitive style effect on DSS acceptance. Although Lu’s research is studying the same overall phenomenon as our research paper, this research paper is different in many ways. First, our research focuses on the cognitive fit theory studying the characteristics of fit and its subsequent effects. Lu looked at how cognitive style, not cognitive fit, can affect DSS intention to use. Second, we looked at how user cognitive fit affects decision quality. While Lu examined how cognitive style of users would affect their perceived ease of use and perceived usefulness of a DSS. Third, our research is using the latest business analytics models, specifically the latest data mining models, in our experiment. Lu used traditional statistical models such as fuzzy weighted-sum model, analytic hierarchy process, and linear weighted-sum model.
Epstein (2003) developed the cognitive-experiential self-theory of personality, and many researchers have developed several instruments that can identify the cognitive style of individuals. Additionally, research is still showing that DSS is still predominantly supporting the analytical cognitive style, but is still lagging in incorporating the intuitive cognitive style (Robey & Taggart, 1982), (Sauter, 1999), (Kuo, 1998). This again undermines Huber (1983) call for stopping the research on cognitive style and DSS design.
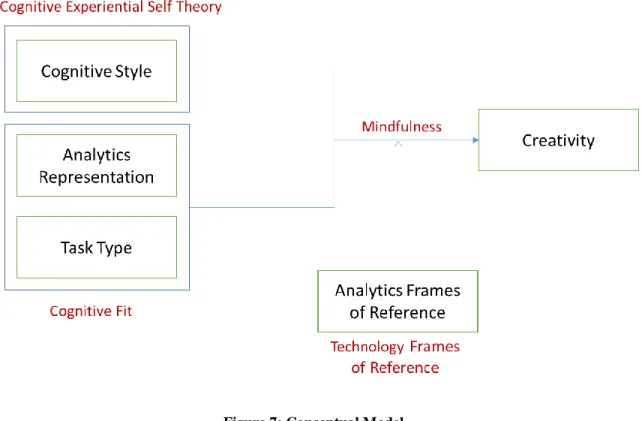
38
Figure 7: Conceptual Model
2.6 Technological Frames of Reference Theory
When people use business analytics, they come at it with assumptions, expectations, and knowledge about it. User’s interpretations of business analytics shape their attitude towards it. “Understanding of people’s interpretations of a technology is critical to understanding their interaction with it” (Orlikowski & Gash, 1994). User’s perceptions of business analytics impose a cognitive structure that is used to solve the problem.
On the one hand, as Gioia (1986) [p. 346] notes, frames are helpful when they structure organizational experience, allow interpretation of ambiguous situations, reduce uncertainty in conditions of complexity and change, and provide a basis for taking action.
An individual’s frame of reference has been described as “a built-up repertoire of tacit knowledge that is used to impose structure upon, and impart meaning to, otherwise
39
ambiguous social and situational information to facilitate understanding” (Gioia, 1986)[p. 56]. “Frames are likely to be both time- and context-dependent, and are always more valid when examined in situation rather than assumed ahead of time” (Orlikowski & Gash, 1994).
Orlikowski and Gash (1994)defined technology frames as the understanding of particular
technological artifacts, and they include not only knowledge about the particular technology but also local understanding of specific uses in a given setting.
Endsley (2000)said that the sources of information for Situation Awareness SA come from system knowledge, interface knowledge, and the real world. Technological frames of reference create mental model of the described situation and form a “situation model”. External cues from the situation being evaluated, goals of the user, past experience with technology, expectations on the role of technology activate these situation models.
For example, some users think that computers are dumb processing machines and computer decision making is not helpful. Those are very cautious in taking any recommendation from an analytics system and they will depend on their own abilities to interpret the results and make a decision. Other users think that computers have superior abilities and can augment the gaps in human intelligence; hence they rely on the analytical system recommendation more than others.
Davidson did two research studies using technology frames of reference theory. In the first study, she investigated how technology frames of reference and shifts of these frames influence sense making during requirement determination. The study used qualitative measures to measure technology frames of reference (E. J. Davidson, 2002).In
40
her second study; Davidson (2006) discussed the need for further development in the theoretical framework. The study calls for development by focusing analysis on frame structure, investigating framing as a dynamic interpretive process, and examining cultural and institutional basis of organizational frames (E. Davidson, 2006).
We need to integrate cognitive fit theory with technological frames of reference in order to get a complete understanding of user’s interaction with business analytics. Cognitive fit theory examines context specific cognitive components of the problem that directly affect the understanding of the problem; while frames of reference examines surrounding cognitive factors that work in the background and have both facilitating and restraining effects. Cognitive fit looks at the mental model of the elements in the current situation; while technological frames of reference look at the mental model of the situation itself.
2.7 Creativity
Creativity can be defined as the ability to discern new relationships, examine subjects from new perspectives and to form new concepts from existing notions (Couger, 1995). Researchers have found that creativity can be enhanced and developed through cognitive variables, environmental variables, and personality variables. Creativity may not so much be the result of genius as being in an idea-nurturing work environment (Turban, Aronson, & Liang, 2005). In fact, it has been proven that decision support systems are tools that can potentially enhance creativity in the decision making process (Elam & Mead, March 1990), (Forgionne & Newman, 2007). “Creativity often originates from the sudden