Building Utilisation Analytics:
Human Occupancy Counting and
Thermal Comfort Prediction
with Ambient Sensing
A thesis submitted in fulfilment of the requirements for
the degree of Doctor of Philosophy
Irvan Bastian Arief Ang
Bachelor of Science in Resources Engineering 《BSc(Eng) 》[National Cheng Kung University - 國立成功大學]
Master of Business Information Systems (Professional) 《 MBIS Prof 》 [Monash University]
School of Science
College of Science, Engineering and Health
RMIT University
Melbourne, Australia
July, 2018
Declaration
I certify that except where due acknowledgement has been made, the work is that of the author alone; the work has not been submitted previously, in whole or in part, to qualify for any other academic award; the content of the thesis is the result of work which has been carried out since the official commencement date of the approved research program; any editorial work, paid or unpaid, carried out by a third party is acknowledged; and, ethics procedures and guidelines have been followed. I acknowledge the support I have received for my research through the provision of an Australian Government Research Training Program Scholarship.
Irvan Bastian Arief Ang (翁道益)
School of Science RMIT University
2nd July 2018
Acknowledgement
All praise, honour and glory to my Lord Jesus Christ for His richest grace and mercy for the accomplishment of this thesis. I am humbled by and grateful for the company of great colleagues, friends and mentors that I enjoyed for many years.
It is with great pleasure that I express my sincere gratitude to my academic supervisors, Dr Flora Dilys Salim and Associate Professor Margaret Hamilton, for their undying support during the last three and a half years. Their patience, motivation, direction and immense knowledge were tremendous and made my graduate experience manageable, invaluable and fulfilling. I am indebted to them for their encouragement and inspirational advice throughout our association. I appreciate their enthusiasm for my research and their assistance in writing this thesis. Specifically, I would like to thank Flora for being incredibly patient while teaching me valuable research techniques. She pushed me beyond my comfort zone and, for the first time, I learnt the real meaning of the words resilience and perseverance. Her never-ending guidance in designing my research was crucial, and I could not imagine having a better advisor and mentor for my PhD study. I profoundly thank Margaret for her patience, encouragement and guidance. I have learnt a lot from her friendly and calm personality in the last four years of my research. Not only did she advise me on the scientific aspects of my research, she also diligently critiqued my academic writing. Margaret was also the one who kept a sense of humour when I had lost mine. Additionally, she enhanced my confidence to accomplish this research.
I take this opportunity to express my appreciation to the special people who provided me with a fulfilling research candidature at RMIT University. Those people start with the members of the Context Recognition and Urban Intelligence (CRUISE) research group. Dr Mohammad Saiedur Rahaman, my longlasting and loyal officemate, for always accompanying me when we were moving between three different research spaces during the last 3.5 years. By supporting one another in the gravest moment, we pushed our limits and became better
iv
researchers. Jonathan Liono, for staying together night by night, a brother who has a similar mentality who understands both academic and industry mindsets. Your brotherly love and care will always be treasured. Samuel Shao, for always reminding us that PhD life is not just about research and always being able to start conversations on a variety of topics. Other CRUISE group members were Amin Sadri, Hui Song and Rumi Shakila Khan, and with them I shared sweat, tears, joy, love and many wonderful moments during the course of my doctorate. It has been a great pleasure to meet each one of them, and I hope our lives will cross paths again in the future. The time spent with every CRUISE group member will always be remembered and cherished. The group meetings advanced my understanding in the many areas that you guys work in.
I would also like to extend my appreciation to my church community in general and to the CIA cell group members specifically: Stanley S., Priska, Allegra, Nicky, Candy, Janice, Stanley C., Jeannifer, Delicia, Meiga, Yovita, Rebecca, Nathania, Cynthia, Daniel, Ravarrell, Amanda, Alfred, Jesslyn and Kenan. You were my second family to me while I was far from home. I would also like to mention my close friends Roby Lie, Ferryan Khodiat and Juwita Susanto for being there for me whenever I needed moral support. I am also grateful to my friends from PPIA who indirectly supported me throughout my PhD journey. I thank RMIT University, Siemens and Honeywell for providing me with financial support in the form of Sustainable Urban Precincts Program (SUPP) double scholarships, and the Government of Australia for
an Australian Government Research Training Program (RTP) scholarship. Thank you to J¨org
Wicker for providing the cinema dataset and Mikkel Baun Kjærgaard for providing the study zones and the classrooms dataset.
On another note, I am deeply grateful to Nobuo Uematsu (植松 伸夫), Yasunori Mitsuda
(光田 康典) and Michiko Naruke (成毛 美智子) for creating the mesmerising music from the Final Fantasy, Xeno-Chrono and Wild Arms series. That music accompanied me during my
research time. Thank you to Keiji Inafune (稲船 敬二) for creating fantastic games in Mega
Man series (ロックマン) where I learnt the true meaning of determination and endurance since
I was small. I thank Ars`ene Wenger for managing my favourite team, Arsenal Football Club,
to win the British Premier League without a single defeat in a season with The Invincibles.
Finally, I would like to express my deep appreciation to my father, my mother, my brothers and my sister for supporting me throughout my PhD study and my life in general.
Dedication
I would like to dedicate the hard work of this thesis to my loving and supportive parents, Arief
Hartono (翁志鴻) and The Swie Tjo (鄭瑞珠). Without their support during this lengthy
journey, I would have never been able to go through the uphill battles of hard work and produce this tome. I would love to say that I have finally fulfilled our family dream of finishing my PhD and making my parents proud of their son in becoming the first in the Arief family to hold the title “Dr”.
I would like to express my sincere gratitude to my father, who always told me “Love what you do, to do what you love”. Indeed, I love technology, and I loved what I did during my PhD. His encouragement has been a constant source of inspiration in my journey and is what made me able to continue with all the hard work and finish my thesis. He gives me the strength and courage to persevere and has made me a better person. My mother’s never-ending love and care makes me strong. She is the one who always reminds me to take a break and take care of my health. My mother always believed in me and never doubt me for a single moment. This belief was my motivation to continue. I learn what real kindness is from my mother. My father improves me, and my mother makes me complete.
To my eldest brother, Arief Handoko (翁道漢), you always give me as much advice as
possible. I really appreciate all of that advice and implement it in my life. Thank you ko Han.
To my second elder brother, Arief Gunawan Halim (翁道坤), as middle siblings we always have
a rebellious attitude and are more straightforward to our family. I like the straightforwardness
and learn a lot from you. Thank you ko Gun. To my cutest little sister, Lusiana Arief (翁惠
玲), we all love you; but, if we feel bored, we like to tease you. That’s the fate of the little
sister. But you are very dependable and mentally strong. Thank you nonik. To all of my siblings, thank you for the endless prayers and words of support.
This thesis is also dedicated to the memory of my beloved grandfather, Arief Hersanto (翁
德遠/翁青山). I will never forget all the life advice that you have given since I was a kid. Your
vi
untimely departure from us has left me in sadness. May you find peace while you rest. In memory of Poniyem (Mbek-Mbek), you taught me many lessons about life since I was small. Those invaluable skills are still relevant today, and I will always treasure each one of them.
To all my family and friends, without your continuous support and motivation, I would not have been able to get through these hard times. You were always extremely strong supporters of me and my passion for research. Although I have completed my tertiary studies away from home, my friends, as the second family here, always made feel at home.
I dedicate this thesis to all of you.
Music is a mysterious thing. Sometimes it makes people remember things they do not expect. Many thoughts, feelings, memories... things almost forgotten... Regardless of whether the listener desires to remember or not. Dr Citan Uzuki
Statistical Summary
Total number of pages: 222 pages
Total number of word count: 68,073 words Total number of figures : 77 figures
Total number of tables: 34 tables
Total number of references: 154 scientific literatures
Credits
Portions of the material in this thesis have previously appeared in the following publications:
Irvan B. Arief Ang, Flora D. Salim, and Margaret Hamilton. “Human Occupancy
Recog-nition with Multivariate Ambient Sensors”. In the Proceedings of the fourteenth IEEE
International Conference on Pervasive Computing and Communication Workshops
(PerCom 2016), pages 1-6. IEEE, Sydney, Australia. 14-18 March 2016.
DOI:10.1109/PERCOMW.2016.7457116 [Ang et al., 2016] (Workshop at a CORE Rank A* conference)
Irvan B. Arief-Ang, Flora D. Salim, and Margaret Hamilton. “SD-HOC: Seasonal
De-composition Algorithm for Mining Lagged Time Series”. Communications in Computer
and Information Science, volume 845, pages 1-19. ISBN 978-981-13-0292-3. Springer
In-ternational Publishing. 2018. DOI:10.1007/978-981-13-0292-3 8[Arief-Ang et al.,2018b]
Irvan B. Arief-Ang, Flora D. Salim, and Margaret Hamilton. “DA-HOC: Semi-Supervised
Domain Adaptation for Room Occupancy Prediction using CO2 Sensor Data”. In the
Proceedings of the fourth ACM International Conference on Systems for Energy-Efficient
Built Environments (BuildSys 2017), pages 1-10. Delft, The Netherlands. 8-9 November
2017. DOI:10.1145/3137133.3137146 [Arief-Ang et al.,2017](CORE Rank A)
Irvan B. Arief-Ang, Margaret Hamilton, and Flora D. Salim. “RUP: Large Room
Utilisa-tion PredicUtilisa-tion with Carbon Dioxide Sensor”. Pervasive and Mobile Computing. Volume
46, June 2018, pages 49-72. DOI:10.1016/j.pmcj.2018.03.001 [Arief-Ang et al., 2018a]
(Impact Factor:2.349, SJR: Q1)
Irvan B. Arief-Ang, Margaret Hamilton, and Flora D. Salim. “A Scalable Room
Occu-pancy Prediction with Transferable Time Series Decomposition of CO2 Sensor Data”.
ix
ACM Transactions on Sensor Networks (TOSN).Accepted. May 2018.
DOI:10.1145/3217214(Impact Factor:2.322, SJR: Q1)
Irvan B. Arief-Ang, Margaret Hamilton, and Flora D. Salim. “THERMO: Thermal
Comfort Prediction and Adjustment in Shared Office Environment”. Proceedings of the
ACM on Interactive, Mobile, Wearable and Ubiquitous Technologies (IMWUT). Under
Review (major revision). May 2018. IMWUT is the journal ofthe ACM International
Joint Conference on Pervasive and Ubiquitous Computing (UbiComp 2018) (CORE
Rank A*)
This research is supported by the Australian Government Research Training Program Scholarship and two RMIT and Siemens Sustainable Urban Precinct Project (SUPP) grants: “iCo2mmunity: Personal and Community Monitoring for University-wide Engagement towards Greener, Healthier, and more Productive Living” and “The Greener Office and Classroom”.
Contents
Declaration ii
Acknowledgement iii
Dedication v
Statistical Summary vii
Credits viii
Contents x
List of Figures xvii
List of Tables xxi
Abstract 2
1 Introduction 3
1.1 Background and Motivations . . . 5
1.2 Research Challenges . . . 5
1.3 Research Questions . . . 7
1.4 Research Contributions . . . 8
1.5 Thesis Organisation . . . 10
2 Sensors: Preliminary Analysis 13 2.1 Introduction . . . 13
2.2 Related Works . . . 14
CONTENTS xi
2.3 Methodology . . . 15
2.3.1 Feature Engineering . . . 15
2.3.2 Machine Learning Algorithm . . . 17
2.4 Data Collection and Preprocessing . . . 18
2.4.1 Type of Sensor Devices . . . 18
2.4.2 Occupancy Web-based Application . . . 19
2.4.3 Data Preprocessing . . . 20
2.5 Experiments and Results . . . 21
2.5.1 Experiment 1 (Normalised Raw Data) . . . 22
2.5.2 Experiment 2 (Ten-Minute Time Segments) . . . 22
2.5.3 Experiment 3 (Part of the Day Segments) . . . 23
2.5.4 Most Dominant Sensor in Determining Human Presence . . . 23
2.5.4.1 CO2 Rate vs Indoor Human Occupancy . . . 23
2.5.4.2 Illumination Level vs Indoor Human Occupancy . . . 24
2.5.4.3 Sound Rate vs Indoor Human Occupancy . . . 24
2.6 Conclusion . . . 25
3 SD-HOC: Seasonal Decomposition Algorithm for Mining Lagged Time Series 26 3.1 Introduction . . . 26
3.2 Background and Related Work . . . 28
3.3 Problem Definition . . . 28
3.3.1 Scenario Assumption . . . 29
3.3.2 Time Series . . . 29
3.4 The Features . . . 30
3.4.1 Time Delay Components . . . 31
3.4.2 Cross-Correlation and the Line of Best Fit . . . 31
3.4.3 Time Lag . . . 33
3.5 The Framework . . . 34
3.5.1 Seasonal-Trend Decomposition (STD) . . . 34
3.5.2 Correlation Models . . . 37
3.5.2.1 Correlation Model for Trend Feature (Tt) . . . 37
3.5.2.2 Correlation Model for Seasonal Feature (St) . . . 38
CONTENTS xii
3.5.3 Zero Pattern Adjustment . . . 39
3.6 Experiments and Results . . . 40
3.6.1 Experiment Setting . . . 40
3.6.1.1 Small Room A . . . 40
3.6.1.2 Big Room B . . . 40
3.6.1.3 Experimental Tool . . . 41
3.6.2 Experimental Parameters . . . 41
3.6.2.1 Experiment for Small Room A Dataset . . . 41
3.6.2.2 Experiment for Big Room B Dataset . . . 42
3.6.3 Experimental Results with Other Data Mining Algorithms . . . 42
3.6.4 Experimental Results with Support Vector Regression (SVR) on Differ-ent Number of Prediction Days . . . 43
3.6.4.1 Evaluation and Baseline . . . 43
3.6.4.2 Experimental Results for Small Room A Dataset . . . 44
3.6.4.3 Experimental Results for Big Room B Dataset . . . 44
3.7 Discussion . . . 45
3.8 Conclusion . . . 45
4 RUP: Large Room Utilisation Prediction with Carbon Dioxide Sensor 47 4.1 Introduction . . . 47
4.1.1 Research Motivation . . . 49
4.1.2 Research Contribution . . . 50
4.2 Background and Related Work . . . 51
4.2.1 Background Study of Human Occupancy Calculation . . . 51
4.2.2 Simulation-Based Indoor Human Occupancy Detection . . . 52
4.2.3 Radio-Based Indoor Human Occupancy Detection . . . 53
4.2.4 Indoor Human Occupancy Detection with Sensors . . . 53
4.2.5 CO2-Based Indoor Human Occupancy Detection . . . 58
4.2.6 Summary of Related Work . . . 59
4.3 Problem Definition . . . 60
4.3.1 Scenario Assumption . . . 61
4.3.2 Problem Definition . . . 61
4.4 Method . . . 62
CONTENTS xiii
4.4.1.1 Academic Staff Room . . . 62
4.4.1.2 Cinema Theatre . . . 63
4.4.1.3 Experimental Tool . . . 63
4.4.2 Data Preprocessing . . . 64
4.4.2.1 Autocorrelation and the Line of Best Fit . . . 65
4.4.2.2 Time Lag . . . 66
4.4.3 Room Utilisation Prediction Algorithm . . . 66
4.4.3.1 Decomposition Methodologies . . . 67
4.4.3.2 Correlation Models . . . 70
4.4.3.3 Occupancy Model . . . 73
4.5 Experiments, Results and Discussion . . . 73
4.5.1 Experiments . . . 73
4.5.1.1 Experimental Parameters for Academic Staff Room Dataset . 74 4.5.1.2 Experimental Parameters for Cinema Dataset . . . 74
4.5.1.3 Evaluation and Baselines . . . 74
4.5.2 Experimental Result . . . 75
4.5.2.1 Experimental Result for Academic Staff Room Dataset . . . . 75
4.5.2.2 Experimental Result for Cinema Dataset . . . 76
4.5.3 Discussion . . . 77
4.6 Conclusion . . . 78
5 DA-HOC++: A Scalable Room Occupancy Prediction with Transfer-able Time Series Decomposition of CO2 Sensor Data 79 5.1 Introduction . . . 79
5.1.1 Research Motivation . . . 81
5.1.2 Research Contribution . . . 82
5.2 Background and Related Works . . . 82
5.2.1 Related Work . . . 82
5.2.2 Semi-Supervised Domain Adaptation . . . 84
5.2.3 Carbon Dioxide - Human Occupancy Counter Model . . . 84
5.3 Problem Definition . . . 86
5.3.1 Scenario . . . 87
5.3.2 Domain Adaptation . . . 88
CONTENTS xiv
5.4.1 Preprocessing DA-HOC++ . . . 89
5.4.2 Main Algorithm DA-HOC++ . . . 91
5.4.2.1 Domain Adaptation Method for the Trend Feature (T FtDA) . . 92
5.4.2.2 Domain Adaptation Method for the Seasonal Feature (SFtDA) 93 5.4.2.3 Domain Adaptation Method for the Irregular Feature (IFtDA) 94 5.4.2.4 Domain Adaptation Method for the Zero Pattern Adjustment Feature (ZFtDA) . . . 95
5.4.3 Post Adjustment DA-HOC++ . . . 95
5.5 Location Detail, Settings and Parameters . . . 98
5.5.1 Location Settings and Parameters . . . 99
5.5.1.1 Source Domain Location . . . 99
5.5.1.2 Target Domain Location . . . 100
5.6 Experiments and Results . . . 101
5.6.1 Experiment Tools . . . 102
5.6.2 Baselines . . . 102
5.6.3 Experimental Results . . . 105
5.6.3.1 Domain Adaptation for Cinema Dataset . . . 105
5.6.3.2 Domain Adaptation for Study Zones Dataset . . . 108
5.6.3.3 Domain Adaptation for Classrooms Dataset . . . 108
5.6.4 Evaluation Metrics . . . 109
5.7 Conclusion . . . 111
6 THERMO: Thermal Comfort Prediction and Adjustment in Shared Office Environments 112 6.1 Introduction . . . 112
6.1.1 Research Motivation . . . 115
6.1.2 Research Contribution . . . 116
6.2 Background and Related Works . . . 116
6.2.1 Background Study of Indoor Thermal Comfort . . . 117
6.2.2 Related Works . . . 119
6.3 Problem Definition . . . 122
6.3.1 Scenario Assumption . . . 122
6.3.2 Problem Definition . . . 122
CONTENTS xv
6.4.1 The Main Group of Features in THERMO . . . 125
6.4.1.1 Ambient Sensor . . . 125
6.4.1.2 Daily Survey Data . . . 125
6.4.1.3 Background Survey . . . 126
6.4.2 Data Pre-processing . . . 127
6.4.2.1 Data Cleansing . . . 127
6.4.2.2 THERMO Weight Level . . . 128
6.4.3 THERMO Prediction Algorithm . . . 129
6.4.3.1 Pre-model . . . 130
6.4.3.2 THERMO Main Model . . . 130
6.4.4 THERMO Adjustment Algorithm . . . 131
6.5 Evaluation . . . 133
6.5.1 Datasets . . . 133
6.5.2 Experiment Tool . . . 134
6.5.3 Evaluation and Baseline . . . 135
6.6 Experimental Results . . . 136
6.6.1 Thermal Sensation Results and Analysis . . . 137
6.6.2 Analysis related to Season . . . 137
6.6.3 Adjustment Results . . . 139
6.7 Conclusion . . . 139
7 Conclusion 141 7.1 Research Questions and Answers . . . 142
7.2 Future Directions for Research . . . 145
Bibliography 147 A Sensor Devices 164 A.1 List of devices (sensors) and Their Capacities. . . 164
B App System Architecture used in Chapter 2 166 C Machine Learning Techniques and Their Abbreviations 167 D Completed Ethics Proposal, Ethics Approval and Survey Documents 169 D.1 Ethics Approval Document . . . 184
CONTENTS xvi
D.2 Participant Information Document . . . 186
D.3 Consent Form Document . . . 190
D.4 Survey Form Document . . . 192
E Full Experiment Accuracy Result for both Academic Staff Room and
List of Figures
1.1 List of Multiple Ambient Sensors. . . 4
1.2 The Location of Each Dataset Used in This Thesis. . . 6
1.3 Main Framework Diagram of Building Utilisation Analytics Related to Ambient Sensors. . . 7
1.4 Thesis Structure and Organisation. . . 9
2.1 (1) SmartThings SmartSense Open/Closed Sensor; (2) Netatmo Urban Weather Station; (3) Z-Wave Aeon MultiSensor;(4) SmartThings SmartPower Outlet. . . . 18
2.2 Occupancy Web-based Application. . . 19
2.3 Root-mean-square Error Results of Various Machine Learning Algorithms. . . 22
2.4 Occupancy Recognition Probability over CO2 Level. . . 23
2.5 Occupancy Recognition Probability over Illumination Level. . . 24
2.6 Occupancy Recognition Probability over Sound Sensor Rate. . . 25
3.1 Real-time Prediction Scenario Showing Human Occupancy and CO2 Fluctuation. The Fundamental Task is to Predict the Number of Occupants at Time t+∆t. . 29
3.2 Data Collection and Analysis Framework. . . 30
3.3 Ordinary Least Square Regression Normalised Root Mean Square Error Between CO2 Data and Actual Occupancy for 60 Minutes Time Lag. . . 33
3.4 Seasonal Decomposition for Human Occupancy Counting (SD-HOC) Analysis Framework. . . 35
3.5 Accuracy Results of Various Machine Learning Algorithms. . . 42
3.6 Small Room A Dataset - Comparison for Indoor Human Occupancy. . . 43
3.7 Big Room B Dataset - Comparison for Indoor Human Occupancy. . . 44
LIST OF FIGURES xviii
4.1 CO2 concentration in the movie theatre over time. (a) shows an overview of all
measurements; days, times and movies screening can be easily identified. (b) shows the concentration on December 28; movie screenings can be seen and the shape
of each screening can be identified differently. (c) shows the CO2 concentration
during the movie “The Hunger Games 2: Catching Fire” on December 28, 2013 at 13:15. . . 49
4.2 Simplified presentation of gas exchange in the respiratory chamber whereϕi(t) is
the flow rate of input air at time t, ϕo(t) is the flow rate of output air at time t,
V is the volume at time t, and ug(t) is the gas production rate at time t. . . 52
4.3 Real-time prediction scenario showing human occupancy and CO2 fluctuations.
The fundamental task is to predict the number of occupants at time t+∆t. . . . 60
4.4 Data Collection and Analysis Framework. . . 61
4.5 A Netatmo urban weather station (left), a sensor device to gather ambient CO2
data that was set up near the window in the academic staff room (right). . . 63
4.6 Measurement in the cinema theatre. Air is drawn out from the screen room via
the ventilation system and is transported to the mass spectrometer. [Wicker et al.,
2015] . . . 63
4.7 Correlation between the number of occupants and CO2 readings (ppm) with time
lag 0. . . 64
4.8 Ordinary Least Square Regression Normalised Root Mean Square Error (NRMSE)
between CO2 data and actual occupancy, for 60 minutes time lag. . . 65
4.9 Large Room Utilisation Prediction (RUP) with Carbon Dioxide Sensor. . . 67
4.10 Examples of Time Series Decomposition. . . 68
4.11 Confusion Matrix between Real Occupancy and Prediction Occupancy for Cinema
Theatre. . . 73
4.12 Academic staff room dataset: comparison for indoor human occupancy with zero
unit of error tolerance. . . 75
4.13 Academic staff room dataset: comparison for indoor human occupancy with one
unit of error tolerance. . . 75
4.14 Cinema dataset: comparison for indoor human occupancy with zero units of error
tolerance. . . 76
4.15 Cinema dataset: comparison for indoor human occupancy with ten units of error
LIST OF FIGURES xix
5.1 Illustration for the Main Algorithm DA-HOC++. . . 80
5.2 Domain adaptation prediction scenario in target domain showing human occu-pancy and CO2 fluctuations. The fundamental task is to predict the number of occupants at time t+∆t. . . 86
5.3 Data Collection and Analysis Framework. . . 87
5.4 Overview of the Semi-supervised Domain Adaptation Learning Method. . . 88
5.5 Correlation between human occupancy number and carbon dioxide concentration. 89 5.6 Semi-supervised domain adaptation method for Seasonal Decomposition for Hu-man Occupancy Counter Double Plus (DA-HOC++). . . 91
5.7 The correlation plot between trend, seasonal, irregular and CO2 value between vacant (red) and non-vacant (blue) room. . . 96
5.8 Source Domain and Target Domain. . . 96
5.9 The DA-HOC++ experiment covers multiple locations in three different coun-tries, in six different rooms with a variety of sizes, surrounding environments and characteristics. . . 97
5.10 A Netatmo urban weather station (left), a sensor device to gather ambient CO2, data which was set up near the window in the academic staff room (right). . . . 99
5.11 Measurement in the cinema theatre. Air is drawn out from the screen room via the ventilation system and is transported to the mass spectrometer [Wicker et al., 2015]. . . 100
5.12 One of the classrooms located in OU44 building (shown top-right) at the Univer-sity of Southern Denmark [Sangogboye et al.,2017]. . . 101
5.13 Binary Occupancy Prediction Result for the Cinema Dataset. . . 103
5.14 Occupancy Counting Accuracy Result for the Cinema Dataset. . . 103
5.15 Binary Occupancy Prediction Results for the Study Zone 1 Dataset. . . 104
5.16 Occupancy Counting Accuracy Results for the Study Zone 1 Dataset. . . 104
5.17 Binary Occupancy Prediction Results for the Study Zone 2 Dataset. . . 105
5.18 Occupancy Counting Accuracy Results for the Study Zone 2 Dataset. . . 105
5.19 Binary Occupancy Prediction Results for the Classroom 1 Dataset. . . 106
5.20 Occupancy Counting Accuracy Results for the Classroom 1 Dataset. . . 106
5.21 Binary Occupancy Prediction Results for the Classroom 2 Dataset. . . 107
LIST OF FIGURES xx
6.1 ASHRAE 7 Point Scale plots of Friend Center for three participants survey results
regarding their general thermal comfortsand thermal sensations. . . 113
6.2 Some of the Factors influencing Thermal Comfort. . . 117
6.3 Real-time prediction scenario for continuous t showing multiple ambient sensor fluctuations. The fundamental task is to predict both general thermal comfort and thermal sensation at time t+∆t. . . 121
6.4 The data flow in THERMO and the detailed source of groups of features covering ambient sensors, daily survey data and background survey with the distribution of different weighted levels. . . 123
6.5 The measurement of General Thermal Comfort (From very uncomfortable [1] to very comfortable [6]). . . 124
6.6 The measurement of Thermal Sensation (From cold [-3] to hot [+3]). . . 124
6.7 The Complete Framework Structure of THERMO. . . 126
6.8 Complete THERMO Prediction Algorithm Model. . . 130
6.9 The Friend Center in Philadelphia, USA. . . 133
6.10 The Friend Center Floor Map [Langevin et al.,2015]. . . 133
6.11 ROC Curve Plot of General Thermal Comfort for Various Machine Learning Al-gorithms. . . 136
6.12 ROC Curve Plot of Thermal Sensation for Various Machine Learning Algorithms. 136 6.13 The distribution of general thermal comfort by each season (From the left to the right: Spring, Summer, Autumn and Winter). . . 137
6.14 General Thermal Comfort Distribution. . . 137
6.15 The distribution of thermal sensation by each season (From the left to the right: Spring, Summer, Autumn and Winter). . . 138
6.16 Thermal Sensation Distribution. . . 138
A.1 Z-Wave Aeon Multi Sensors . . . 164
A.2 SmartThings SmartSense Open/Closed Sensor . . . 164
A.3 SmartThings SmartPower Outlet . . . 165
A.4 Netatmo Urban Weather Station . . . 165
List of Tables
2.1 List of coefficients for each parameter for non-linear regression formula . . . 21
2.2 List of coefficients for each parameter for regression line polynomial order of 4. . 23
2.3 R2 value and Pearson correlation r-value for the three most dominant sensors for recognising indoor human occupancy. . . 24
3.1 Accuracy results of various machine learning algorithms. . . 43
4.1 Models, parameters and reported accuracies for radio-based occupancy detection research. . . 53
4.2 Models, parameters and reported accuracies for sensor-based occupancy detection research. . . 54
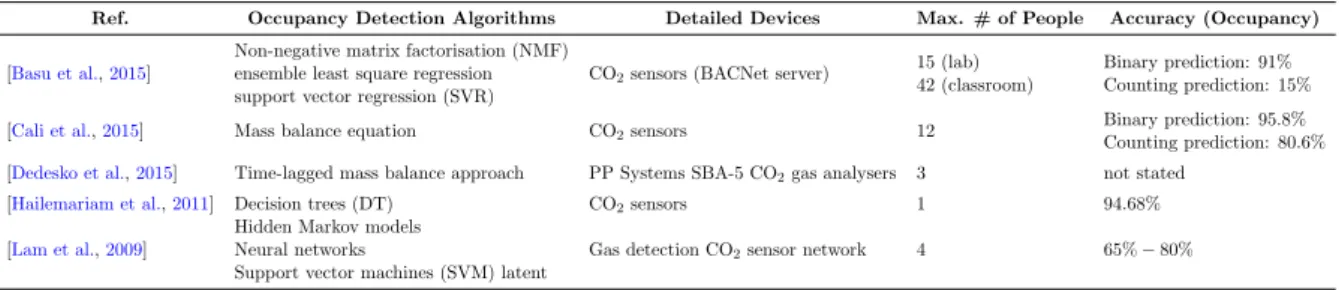
4.3 Algorithms, devices and reported accuracies for CO2 sensor-based occupancy de-tection research. . . 58
4.4 Example of Indoor Human Occupancy History Data. . . 60
4.5 Academic staff room indoor human accuracy result. . . 75
4.6 Cinema theatre indoor human occupancy accuracy result. . . 77
5.1 Algorithms, devices and reported accuracies for CO2-sensor-based occupancy de-tection research. . . 85
5.2 Detailed statistical information on the datasets for small and large rooms. . . 98
5.3 SVR (+TB), SD-HOC (+TB), SVR (-TB), SD-HOC (-TB) and DA-HOC++ Human Binary Occupancy and Occupancy Counting Prediction Accuracy Results for the Cinema Dataset. . . 103
5.4 SVR (+TB), SD-HOC (+TB), SVR (-TB), SD-HOC (-TB) and DA-HOC++ Human Binary Occupancy and Occupancy Counting Prediction Accuracy Results for the Study Zone 1 Dataset. . . 104
LIST OF TABLES xxii
5.5 SVR (+TB), SD-HOC (+TB), SVR (-TB), SD-HOC (-TB) and DA-HOC++
Human Binary Occupancy and Occupancy Counting Prediction Accuracy Results for the Study Zone 2 Dataset. . . 105
5.6 SVR (+TB), SD-HOC (+TB), SVR (-TB), SD-HOC (-TB) and DA-HOC++
Human Binary Occupancy and Occupancy Counting Prediction Accuracy Results
for the Classroom 1 Dataset. . . 106
5.7 SVR (+TB), SD-HOC (+TB), SVR (-TB), SD-HOC (-TB) and DA-HOC++
Human Binary Occupancy and Occupancy Counting Prediction Accuracy Results
for the Classroom 2 Dataset. . . 107
5.8 The Accuracy, Precision, Recall and F-Score for Cinema Dataset. . . 108
5.9 The Accuracy, Precision, Recall and the F-Score for Study Zones 1 and 2. . . 109
5.10 The Accuracy, Precision, Recall and F-Score for Classrooms 1 and 2. . . 110
6.1 Five different level of weighting in THERMO. . . 127
6.2 General Thermal Comfort and Thermal Sensation Prediction Accuracy Results
from THERMO and other Machine Learning Algorithms. . . 135
6.3 A General Thermal Comfort Comparison Snapshot between the Original and after
Adjustment. . . 139
C.1 Machine Learning Techniques and their abbreviations that are used in related works.168
E.1 Academic staff room indoor human occupancy accuracy result for 1 day and 2
days prediction with 7-13 days training data . . . 195
E.2 Academic staff room indoor human occupancy accuracy result for 3 days and 4
days prediction with 7-11 days training data . . . 196
E.3 Academic staff room indoor human occupancy accuracy result for 5 days and 6
days prediction with 7-9 days training data . . . 196
E.4 Academic staff room indoor human occupancy accuracy result for 7 days
predic-tion with 7 days training data . . . 196
E.5 Cinema theatre indoor human occupancy accuracy result with ten unit error
tol-erance for 1 day and 2 days prediction with 12-22 days training data . . . 197
E.6 Cinema theatre indoor human occupancy accuracy result with ten unit error
tol-erance for 3 days and 4 days prediction with 12-20 days training data . . . 197
E.7 Cinema theatre indoor human occupancy accuracy result with ten unit error
LIST OF TABLES xxiii
E.8 Cinema theatre indoor human occupancy accuracy result with ten unit error
tol-erance for 7 days and 8 days prediction with 12-16 days training data . . . 198
E.9 Cinema theatre indoor human occupancy accuracy result with ten unit error
tol-erance for 9 days and 10 days prediction with 12-14 days training data . . . 198
E.10 Cinema theatre indoor human occupancy accuracy result with ten unit error
Abstract
With advancement in sensors and the Internet of Things, gathering spatiotemporal information from one’s surroundings has become more convenient. There are multiple phenomenological behaviours, such as indoor comfort and occupancy trends, that can be inferred from this information. There are multiple advantages to having an accurate indoor occupancy prediction, including better understanding of space-room utilisation, which can be used to further inform energy consumption reduction, human indoor comfort optimisation and security enhancement. We use non-intrusive ambient sensors to infer indoor occupancy patterns. Non-intrusive ambient sensors are utilised because they are commonly available in building management systems (BMSs). Machine learning techniques are applied and data-driven approaches are implemented to identify indoor human occupancy and predict comfort. These facilitate the decision-making tasks for building management professionals and are used in real-time mon-itoring. Our preliminary study with multiple ambient sensors reveals that carbon dioxide is one of the best predictors of indoor human occupancy.
We design a seasonal trend decomposition algorithm by implementing pervasive sensing and leveraging carbon dioxide data from BMS sensors. The first model is seasonal decomposition for human occupancy counting (SD-HOC), a customised feature transformation decomposition prediction model. This provides a novel way to estimate the number of people within a closed space, using one carbon dioxide sensor. SD-HOC integrates a time lag and line of best fit model in the preprocessing algorithms and customises different regression algorithms for each subcomponent, to predict each respective human occupancy component value. Utilising several machine learning techniques, a set of prediction values for each component is obtained. Finally, additive decomposition is used to reconstruct the prediction value for human indoor occupancy. We improve the algorithm to cover multiple buildings with different contexts and locations and develop a large Room Utilisation Prediction with carbon dioxide sensor (RUP). RUP im-proves SD-HOC and is able to predict a larger number of occupants, up to three hundred, using
2
data from a single carbon dioxide sensor. RUP de-noises and pre-processes the carbon dioxide data. We use multiple variants of seasonal decomposition techniques and feature factorisation for both occupant and carbon dioxide datasets, and develop a zero pattern adjustment model to increase the accuracy. We run our model in two different locations that have different con-texts. The prediction accuracy results outweigh the state-of-the-art techniques for time series decomposition and regression.
RUP is a reliable model for any building with adequate historical data. In the real world, this condition is not always feasible, due to several limitations such as a new building only having limited historical data, or government/military buildings that have strictly controlled access to historical ambient sensor data. One way to solve this problem is by implementing a transfer learning technique with SD-HOC. We design a semi-supervised domain adaptation method for carbon dioxide - human occupancy counter (DA-HOC) to estimate the number of people within one room, by using a carbon dioxide sensor with a limited number of training labels (as little as one day of historical data). The DA-HOC model is trained using data from a source domain that has a more complete set of training labels, and transferred to predict the occupancy of a much larger room of the target domain, with very little training data. We enhance DA-HOC into DA-HOC++ and successfully experiment with the model to transfer the knowledge from one room to five different rooms in different countries.
Moving beyond indoor human occupancy, each occupant’s comfort is also a crucial problem that needs to be considered. Indoor comfort prediction is crucial for energy efficiency cost adjustment, human productivity and non-wastage of resources. Maintaining human indoor comfort levels at acceptable values is one of the primary goals in any building and room utilisation. The main problem is that everybody has a different level of acceptance of what is comfortable. We implement a machine learning algorithm to predict the thermal comfort for each occupant. Our model successfully achieves a respectable accuracy of comfort prediction to help the BMS adjust the temperature.
This thesis presents several contributions in machine learning for indoor human occupancy and comfort prediction. This research implements and extends existing data mining techniques to solve problems on time series prediction. The solutions are scalable and can also work with minimal sets of historical training data with a transfer learning method. The research contributions in this thesis present multiple occupancy algorithms for both indoor human occupancy and thermal comfort. We believe that this research provides a big step towards building a robust solution for smart homes and smart buildings, in which the buildings are more aware of their occupants and can adapt to their needs.
Chapter 1
Introduction
Building and housing are an integral part of human life. From education and work to entertain-ment and leisure, every aspect of life activity needs some shelter. The study of building-related
domains has been underway for many years [Dodier et al., 2006, Lu et al.,2010, Feige et al.,
2013,Sangogboye et al.,2017]. Due to its importance, there are many studies around building
management, which includes smart buildings [Lam et al.,2014,Shin et al.,2017], indoor
ana-lytics [Huang et al.,2012,Jiang et al.,2012] and energy efficient buildings [Delaney et al.,2009,
Jradi et al.,2017]. As buildings are becoming smarter every day [Agarwal et al.,2010], concern about how smart buildings deliver more benefits and better experiences to their owners and inhabitants is also growing [Zhang et al.,2011,Beltran et al.,2013,Clear et al.,2013,Ascione et al.,2014].
With advances in ambient sensors around us, gathering ambient information and translating
it to data has never been easier [Ekwevugbe et al.,2013b,Khan et al.,2014]. Smart buildings
utilise multiple sensors with different capabilities to increase the way they communicate with their inhabitants. With numerous different types of sensors that can be installed in a building, the possibilities are limitless. There are multitudinous benefits from sensor installation in
buildings, such as intelligent building security [Luo et al., 2003], indoor air quality [Jiang
et al., 2011], the Internet of Things [Swan, 2012] and pervasive and ubiquitous computing [Erickson et al.,2009]. Variety types of ambient sensors are shown in Figure 1.1.
A key part of smart building management is an efficient building utilisation [Akkaya et al.,
2015]. Understanding how a building and space are utilised improve the quality of human life.
The study of building utilisation focuses on knowing where the inhabitants are at one specific point in time. Understanding how many people are within a building or in one particular room
CHAPTER 1. INTRODUCTION 4 Temperature Illuminate Door Open/ Close Power Consumption CO2 Humidity Motion Pressure Noise
Figure 1.1: List of Multiple Ambient Sensors.
level is an important component for smart heating, ventilation and air conditioning (HVAC) systems. On the other hand, if the number of occupants can be precisely identified, HVAC systems can be adjusted to be more efficient. The room temperature can be adjusted when there is at least one person inside the room, and electricity can be saved when there is nobody inside.
The majority of buildings do not have apposite infrastructure to accurately sense people and where they are within a building. With this limitation, it is difficult to obtain accurate occupancy data inside a building and to get the precise ground truth value for analysis purposes. Existing works mainly focus on the use of simulation models [Goldstein et al.,2010,Page et al.,
2008] to reduce energy consumption. Others simulate occupant behaviour and aim for reducing
energy consumption based on their behaviour [Richardson et al.,2008,Saelens et al.,2011]. A
stable model for transfer learning is needed so that a human occupancy model can be deployed in another context with acceptable accuracy of prediction.
The process of reducing the cost and knowing the number of people should not sacrifice personal indoor comfort, and these domains are strictly related to one another. Indoor comfort includes visual comfort, acoustic comfort, thermal comfort and good air quality. Thermal
Background and Motivations 5
comfort analysis is the most complicated of these, as every human has a different sense of what is comfortable. This analysis requires both quantitative sensor data and qualitative survey data. By marrying these data, an indoor thermal comfort and thermal sensation prediction model can be developed.
1.1
Background and Motivations
The research area of human occupancy prediction has become established in recent years due to advances in powerful technologies for data analysis. In the past, only a supercomputer could handle the analysis of millions of data. However, in recent years, this limitation is closing and a standard personal computer can do basic data analysis for a few million data points with an acceptable processing time.
Many practical real-life advantages can be obtained by knowing the number of occupants residing in one building or one room at a particular time. The benefits include energy consump-tion reducconsump-tion, human indoor comfort and security. Knowing the number of people in advance can be used to adjust the HVAC to reduce the power if there will be nobody inside a room for a given period. Human comfort quality can be improved by increasing or decreasing the heating or air conditioning based on the crowdedness of a room. For security, if the owner of a building knows that there should be no-one inside the building at a particular time, detecting a person at that point could be linked to a security breach.
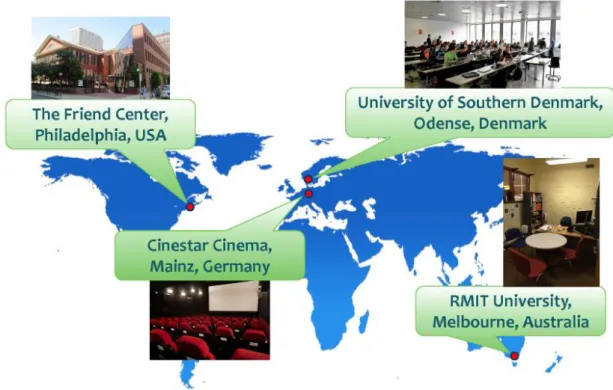
Understanding the occupancy pattern is also necessary for space utilisation. If the usage pattern of one room is low, the room can be utilised for other more beneficial purposes. Max-imising space and room utilisation creates greater space efficiency and could increase both individual and group productivity. Our research gathered and utilised data from around the world as shown in Figure 1.2 to ensure that our solutions can be implemented everywhere.
1.2
Research Challenges
In this thesis, we aim to utilise ambient sensors to address multiple key challenges related to building analytics. The rapid growth of availability of a variety of sensors, and the possibility of mass production of those sensors in an affordable manner, enables the collection of diverse time series of ambient sensor data.
Advances in artificial intelligence for data analysis in machine learning facilitates a new way of handling massive amounts of data - sometimes reffered to as big data, which is data
Research Challenges 6
Figure 1.2: The Location of Each Dataset Used in This Thesis.
that contain the 3Vs volume, variety and velocity [Douglas, 2001]) - and the ability to infer
the meaning of the data in a useful way.
In summary, the core challenges in building analytics surrounding human occupancy and thermal comfort are:
Fusion, integration and representation of collected large ambient and survey-related data
sources.
Providing intelligent analysis and prediction on human indoor occupancy and thermal
comfort.
Performing building utilisation analytics prediction without breaching occupants’ privacy.
Inferring sparse sensor and occupancy contexts from limited annotation data (e.g. from
Research Questions 7
Understanding and correlating both quantitative and qualitative data to mine deeper
meaning to support building and machine automation.
Indoor human occupancy has been explored for more than a decade [Barandiaran et al.,
2008, Erickson et al., 2009, Lee et al., 2011]. One of the most prominent problems is how to study human occupancy without a camera. Image processing techniques from vision-based devices could be very accurate but raise privacy issues. This thesis tries to fill this research gap by introducing a new approach of counting people using a device unrelated to human occupancy and several other new techniques for this domain. The main framework of this thesis in one single image is summarised in Figure 1.3.
Temperature Humidity Air Flow Radiant Heat Sunlight (heat) Lumens CO2 Pressure Noise 3 people 2 people Thermal comfort perception
Figure 1.3: Main Framework Diagram of Building Utilisation Analytics Related to Ambient Sensors.
1.3
Research Questions
In order to overcome the aforementioned research challenges, the following research questions (RQs) are defined, with the goals of achieving the most robust building analytics around
hu-Research Contributions 8
man occupancy and thermal comfort.
RQ-1. How to recognise indoor human occupancy using multivariate ambient sensor data?
Understanding whether a room is occupied or vacant is the foundation of this research. We utilise various machine learning algorithms to find the best method for binary indoor human occupancy: whether the room is vacant or occupied. Furthermore, we build a model to com-pare which ambient sensor is the most dominant.
RQ-2. How to perform room utilisation prediction using carbon dioxide data?
From the first research question, we found that carbon dioxide is the best ambient sensor predictor for recognising indoor human occupancy. We develop a novel feature engineered method to utilise only carbon dioxide data to predict the number of occupants in a space.
RQ-3. How to perform transfer learning to use an existing occupancy prediction model to predict the utilisation of another room with limited training data?
Continuing from the previous research question, we develop a domain adaptation technique using information from one location to other location. A general transfer learning model is examined and customised for the domain of indoor human occupancy.
RQ-4. How to predict indoor comfort based on ambient sensor and users’ survey data?
Thermal comfort and thermal sensation are two central matrices in understanding the level of satisfaction in one building. Understanding human indoor comfort in general is crucial as part of a complete model of building utilisation analytics.
1.4
Research Contributions
To address the aforementioned research questions, the contributions of this thesis are as follows:
To investigate and analyse space and room utilisation with the use of only ambient sensor
Research Contributions 9
To develop and model a novel method for indoor human occupancy using only one type
of ambient sensor data.
To design a transfer learning model for human occupancy that can be used across different
locations.
To redefine and redesign the thermal comfort and thermal prediction models with machine
learning, and automate the HVAC adjustment model.
This research focuses on counting human occupancy and indoor comfort, and builds a transferable generic model to other locations to avoid over-fitting a design model. The analysis is conducted from a data-driven perspective.
The practicality of this problem can be applied to multiple domains. It is known that
suitable indoor comfort improves the overall productivity of inhabitants [McCartney and
Humphreys,2002,Akimoto et al.,2010]. Furthermore, the health and wellbeing of each
inhab-itant can be maintained in a comfortable environment [Matzarakis and Amelung,2008,Ortiz
et al.,2017].
Building Utilisation Analytics
People Counter Transfer Learning
Preliminary Analysis (Chapter 2)
Primary Research Advanced Research SD-HOC: Seasonal Decomposition Algorithm
for Mining Lagged Time Series (Chapter 3)
THERMO: Thermal Comfort Prediction and Adjustment in Shared Office Environment
(Chapter 6) Thermal Prediction
Indoor Human Occupancy Thermal Comfort
RUP: Large Room Utilisation Prediction with
Carbon Dioxide Sensor
(Chapter 4) DA-HOC and DA-HOC++: Semi-Supervised Domain
Adaptation for Room Occupancy Prediction using Carbon Dioxide (Chapter 5)
Thesis Organisation 10
1.5
Thesis Organisation
Each chapter starts with a chapter introduction, motivation and contribution. Background and related works are discussed to give the reader context for that chapter. The problem is defined and followed by methodology, experiments and results. Each chapter closes with a conclusion. An overarching view of thesis structure and organisation is shown in Figure 1.4. The thesis is organised as follows:
Chapter 2 - Sensors: Preliminary Analysis
A preliminary experiment with a variety of ambient sensors is conducted and recorded.
The solution presented in this chapter relates toRQ-1. The detailed correlation between
sensor data and human presence is modelled, and the three most dominant sensors in determining human presence are identified.
Copyright/credit/reuse notice: The contents of this chapter have been taken and revised
as needed from a paper published as: [Ang et al.,2016]
Irvan B. Arief Ang, Flora D. Salim, and Margaret Hamilton. “Human Occupancy
Recog-nition with Multivariate Ambient Sensors”. In the Proceedings of the fourteenth IEEE
International Conference on Pervasive Computing and Communication Workshops
(PerCom 2016), pages 1-6. IEEE, Sydney, Australia. 14-18 March 2016.
DOI:10.1109/PERCOMW.2016.7457116
Chapter 3 - SD-HOC: Seasonal Decomposition Algorithm for Mining Lagged Time Series
SD-HOC is a customised feature transformation decomposition, a novel way to estimate the number of people within a closed space using only a single carbon dioxide sensor.
The solution presented in this chapter answered half ofRQ-2.
Copyright/credit/reuse notice: The contents of this chapter have been taken and revised
as needed from a paper published as: [Arief-Ang et al.,2018b]
Irvan B. Arief-Ang, Flora D. Salim, and Margaret Hamilton. “SD-HOC: Seasonal
De-composition Algorithm for Mining Lagged Time Series”. Communications in Computer
and Information Science, volume 845, pages 1-19. ISBN 978-981-13-0292-3. Springer
International Publishing. 2018. DOI:10.1007/978-981-13-0292-3 8
Thesis Organisation 11
Chapter 4 - RUP: Large Room Utilisation Prediction with Carbon Dioxide Sensor
RUP is a novel machine learning technique to estimate the number of people within a closed space from a single carbon dioxide sensor. RUP is the extension work from SD-HOC, and at the time of this thesis being written, is the state-of-the-art machine learning technique for people counting. The solution presented in this chapter completed
the answer forRQ-2.
Copyright/credit/reuse notice: The contents of this chapter have been taken and revised
as needed from a paper published as: [Arief-Ang et al.,2018a]
Irvan B. Arief-Ang, Margaret Hamilton and Flora D. Salim. “RUP: Large Room
Utilisa-tion PredicUtilisa-tion with Carbon Dioxide Sensor”. Pervasive and Mobile Computing. Volume
46, June 2018, pages 49-72. DOI:10.1016/j.pmcj.2018.03.001
Chapter 5 - DA-HOC++: A Scalable Room Occupancy Prediction with
Transferable Time Series Decomposition of CO2 Sensor Data
DA-HOC and DA-HOC++ are the two main techniques that we developed for domain adaptation related indoor human occupancy prediction. The solution presented in this
chapter completed the answer forRQ-3.
Copyright/credit/reuse notice: The contents of this chapter have been taken and revised
as needed from papers published as: [Arief-Ang et al.,2017]
Irvan B. Arief-Ang, Flora D. Salim, and Margaret Hamilton. “DA-HOC: Semi-Supervised
Domain Adaptation for Room Occupancy Prediction using CO2 Sensor Data”. In the
Proceedings of the fourth ACM International Conference on Systems for Energy-Efficient
Built Environments (BuildSys 2017), pages 1-10. Delft, The Netherlands. 8-9 November
2017.
DOI:10.1145/3137133.3137146
Irvan B. Arief-Ang, Margaret Hamilton and Flora D. Salim. “A Scalable Room Occu-pancy Prediction with Transferable Time Series Decomposition of CO2 Sensor Data”.
ACM Transactions on Sensor Networks (TOSN). 2018. (Accepted)
Thesis Organisation 12
Chapter 6 - THERMO: Thermal Comfort Prediction and Adjustment in
Shared Office Environments
THERMO is a prediction and adjustment model for both general thermal comfort and thermal sensation in a shared office environment. The solution presented in this chapter
completed the answer for RQ-4.
Copyright/credit/reuse notice: The contents of this chapter have been taken and revised
as needed from a paper published as:
Irvan B. Arief-Ang, Margaret Hamilton and Flora D. Salim. “THERMO: Thermal
Com-fort Prediction and Adjustment in Shared Office Environments”. Proceedings of the ACM
on Interactive, Mobile, Wearable and Ubiquitous Technologies (IMWUT). 2018. (Under
review) DOI:
- Chapter 7 - Conclusion
This chapter concludes the thesis by summarising the main contributions, key findings and limitations of the proposed methods. In addition, the significance of this research and potential future directions in this area are also discussed.
Chapter 2
Sensors: Preliminary Analysis
2.1
Introduction
As discussed in Chapter 1, intelligent analysis and prediction of indoor human occupancy is very important for a variety of purposes, including energy saving. Data obtained from the
Department of Energy indicates that the average cost of HVAC [DOE.,2010] accounts for
35-45% of the total maintenance costs within a building. Due to this factor, there are substantial investments made to automate the temperature control systems of buildings, and any type of methodology to improve this area is heavily sought after. Reducing HVAC usage will massively reduce overall energy consumption. One way to improve this is to recognise human occupancy inside each particular space so that a building management system (BMS) can intelligently adjust the HVAC.
The majority of buildings (especially older ones) do not have adequate infrastructure to accurately sense people and to locate where they are within a building, which makes it difficult to obtain accurate occupancy data. Due to this, obtaining a precise ground truth value for analysis will be challenging. Ambient sensors are readily available in most buildings with a BMS, but they have been under-utilised for occupancy recognition.
Ambient intelligence is a vision where technology blends naturally with our everyday life [Basten et al.,2003]. This area has become extremely significant in recent years as more people become aware of their surroundings and want to know more about them. One approach to obtain information about the ambient environment is to use sensor data. With the latest technology, sensor devices are becoming more accurate and economical.
In this chapter, we propose a method of extracting sensor data and correlating this
Related Works 14
mation with the number of occupants. Our research contributions are:
1. A feature engineering and selection method to determine the three most dominant feature sets extracted from raw data and using statistical analysis.
2. Using regression and correlation analysis, to determine the most dominant ambient sensor channel for detecting occupancy.
2.2
Related Works
Occupancy detection analysis has existed for some time, and the biggest challenge is to do
this without using image recognition. Human occupancy detection using cameras [Erickson
et al.,2009] can be accurate, however this method raises privacy issues. Researchers have been undertaking studies to propose various other methods to detect human occupancy.
As occupancy usually relies on motion detection, some researchers [Leephakpreeda,2005,
Dutta et al.,2006] focus on measuring movement. One study used microwave motion sensors to detect motion and then controlled lighting with a time delay to reduce electricity consumption [Leephakpreeda, 2005]. Other research took advantage of ultra-wideband radar to recognise
people, because radar can work beyond the line of sight [Dutta et al.,2006]. However, the cost
of using radars for occupancy detection is high.
The most popular method for indoor occupancy detection is by using passive infrared (PIR)
sensors [Agarwal et al., 2010, Dodier et al., 2006, Garg and Bansal, 2000, Howard and Hoff,
2013,Lu et al.,2010,Wang et al.,2005], as they are cheap and can detect motion easily. Some of these sensors combine PIR sensors with magnetic reed switches and are installed on the
doorjamb to detect when the door is opened or closed [Agarwal et al., 2010, Lu et al.,2010,
Srinivasan et al., 2010]. A combination of PIR sensor and magnetic reed switches has been used in many types of research, and this has become an unofficial standard to detect indoor human occupancy. SPOT+ uses a Microsoft Kinect sensor, an Arduino microcontroller and
an infrared sensor to identify and track the location of user [Gao and Keshav,2013].
In the last few years, Wi-Fi technology has been used to locate and count the number of
occupants in the room. Jiang et al. [Jiang et al.,2012] developed ARIEL, a room localisation
system that automatically learns a room’s fingerprints based on occupants’ indoor movement.
Khan et al. [Khan et al., 2015] used smartphones’ acoustic, locomotive and location sensors
with zero configuration to infer the number of people present at one location. In their research, they required people to keep their smartphones in a pocket or hand, which might not be an
Methodology 15
ideal in some cases. Recent work of Depatla et al. [Depatla et al., 2015] in a device-free area
used only Wi-Fi signals to estimate occupancy of up to nine people. However, the accuracy dropped significantly when the experiment was conducted indoors. Wi-Fi-based localisation generally requires people to log in to a network or carry their device. There is another Wi-Fi-based localisation technique that does not require users to carry any device, however this only
works for a limited number of occupants [Youssef et al.,2007].
Given that occupancy recognition does not require users to be tracked, which would rely on the use of vision-based or wireless-based technology, we ask the following research question ‘Is it possible to detect indoor occupancy using the proliferation of sensor devices that are already widely available in buildings and installed for other purposes, so that we can leverage the functionality of these devices?’ The Building-Level Energy Management Systems (BLEMS)
project at the University of Southern California [Mamidi et al., 2012] has considered this
possibility and is addressing it using several ambient sensors, such as indoor temperature, relative humidity, illumination, carbon dioxide and sound sensors. The limitations of their research are that they did not use cross-validation to optimise the results and they used limited types of sensors.
With regards to the locations of occupancy detection experiments, a few studies have focused on residential houses [Lu et al.,2010,Srinivasan et al.,2010,Barbato et al.,2009]. Most research is related to user profiling for the purpose of reducing energy consumption. Other
research has focused more on single person office rooms [Leephakpreeda, 2005, Wang et al.,
2005], as this is a more controlled environment, and supervised learning could be implemented
with fewer people engaged.
This research focuses a on using contact-free, device-free approach to occupancy recognition using ambient sensors. With ambient sensors, users’ privacy is protected, and the devices are
widely available in existing buildings with HVAC systems installed [Agarwal et al.,2011,Tsao
and Hsu,2013].
2.3
Methodology
2.3.1 Feature Engineering
For feature extraction, several types of sensors were used as our main features. The overall set of features were:
Methodology 16
Segment of the day: the days were divided into four equal subsections: morning,
after-noon, evening and night (only for experiment 3).
Indoor temperature (T): the room temperature, in Celsius, which is recorded by the
sensor.
Relative humidity (H): the ratio of the partial pressure of water vapour to the equilibrium
vapour pressure of water recorded by the sensor.
CO2 rate (CO2): the carbon dioxide content in ppm recorded by the sensor.
Sound rate (S): the level of noise within a room in decibels recorded by the sensor.
Atmospheric pressure (P): the value of pressure exerted by the weight of air recorded by
the barometer.
Illumination (L): the level of brightness within a room in lux recorded by the sensor.
To collect ground-truth data (the number of people who were staying in the room at that time), several other sensors and a web-based app were used:
Door state: all opening and closing events were recorded.
Power consumption: computer monitor power usage was monitored.
Motion sensor: detected and stored data if there was motion within the range of the
sensor.
Occupancy app: our own custom-built web-based app to gather ground-truth data. The
room owner stores data about the times when people enter and leave the room, and records the number of people in the room as it changes.
Door state, power consumption, and motion sensor data were for ground truth and were not to be used for the data mining analysis.
Other than normalised raw data analysis, there were several derived features, as follows: 1. Ten-minute time segment
a) Ten-minute time window with maximum value b) Ten-minute time window with minimum value
Methodology 17
c) Ten-minute time window with mean (µ) value
d) Ten-minute time window with variance (σ) value
2. Segment of the day: we divided the data into time segments (morning, afternoon, evening and night), as follows:
Morning (6 a.m. to 12 p.m.)
Afternoon (12 p.m. to 6 p.m.)
Evening (6 p.m. to 12 a.m.)
Night (12 a.m. to 6 a.m.)
To summarise, eight main features were used in our experiment.
2.3.2 Machine Learning Algorithm
In this chapter, we use multi-layer perceptron, Gaussian processes with radial basis function (RBF) as core, support vector machine (SVM), random forest and na¨ıve Bayes to recognise the level of accuracy.
To identify the most dominant sensor, we fit our data to linear regression in Equation 2.1 and perform regression analysis.
ˆ
O=αT +βH+γCO2+δS+P +ζL+η (2.1)
where ˆO is the number of occupants, T is temperature, H is humidity, CO2 is the level of
CO2, S is sound, P is pressure and L is light (illumination). Our formula provides a
straight-forward but effective way to identify the dominant sensors for human occupancy, as they will have higher coefficients than the other sensors.
For each dominant sensor, we fit a fourth order polynomial and perform a logistic regression
analysis to check the goodness of fit and R2, a statistical measure of how close the data are to
the fitted regression line. For our final evaluation, we compute the Pearson product-moment correlation coefficient to check the correlation between each sensor and the occupancy data.
Data Collection and Preprocessing 18
Figure 2.1: (1) SmartThings SmartSense Open/Closed Sensor; (2) Netatmo Urban Weather Station; (3) Z-Wave Aeon MultiSensor;(4) SmartThings SmartPower Outlet.
2.4
Data Collection and Preprocessing
2.4.1 Type of Sensor Devices
For this experiment, we deployed a Z-Wave Aeon Multi Sensor, a SmartThings SmartSense Open/Closed Sensor, a SmartThings SmartPower Outlet and a Netatmo Urban Weather Sta-tion, as shown in Figure 2.1. We ran the experiment continuously for two weeks and gathered
data for indoor temperature, relative humidity, the rate of carbon dioxide (CO2), sound level,
atmospheric pressure, level of illumination, whether the door was open or closed, the power consumption of the monitor, and the motion within the room.
We deployed the SmartSense Open/Closed Sensor on the door, to detect the opening or closing of the door. The Urban Weather Station consists of multivariable sensors that can
detect indoor temperature, relative humidity, atmospheric pressure, the rate of CO2 in the air,
and the sound level. The SmartPower Outlet was combined with a step-down converter due to the difference in voltage between the device’s country of origin (USA) and our country’s
Data Collection and Preprocessing 19
voltage (Australia), and installed with the monitor. The MultiSensor, which is a combination of four sensors (indoor temperature, relative humidity, illumination level and motion sensor), was deployed in front of the user and below the monitor so that it would detect motion every time a user sits in front of the PC.
Figure 2.2: Occupancy Web-based Application.
2.4.2 Occupancy Web-based Application
We developed an occupancy application to collect user annotations of their room’s actual occupancy. This is a web-based application for the room owner to complete every time an
Data Collection and Preprocessing 20
event occurs with the door, where “event” means that a person comes in or out. The interface of this application is shown in Figure 2.2.
2.4.3 Data Preprocessing
To be able to recognise indoor human occupancy and correlate it with ambient sensor data, ground truthing of about the number of people within a room at a specific time is required. On the other hand, privacy must be respected and therefore the use of cameras was not an option. Thus, multiple methods are applied to secure a solid ground truth.
Human occupancy ground truth data was collected from a web-based application, which provides a form to be filled in by the resident every time a person enters or leaves the room. As ground truth data from human input may be unreliable, we added three more validation layers to ensure high-quality ground truth data. The first validation layer is a power consumption sensor that connects to the monitor. If the power consumption goes up after a while, it is assumed that there is a person in the room. The second validation layer is a motion sensor, and the last is a door open and close sensor. Every time the door is opened and closed, there is a possibility that the number of people in the room changes. With those three additional validation layers of ground truth, we have developed a rigorous evaluation method to obtain an accurate measure of indoor human occupancy without using a camera. To handle the missing occupancy value problem, we designed a simple logic shown in Algorithm 1.
Algorithm 1 Fixing missing occupancy value algorithm
1: procedure MISSING OCCUPANCY(SensorData[t])
2: Occ[t]← 0 . Occ[t]: Occupancy
3: P C[t]← low . P C[t]: Power Consumption
4: M[t]← low . M[t]: Motion
5: DS[t]← 0 . DS[t]: Door State
6: for each nodei∈SensorData[t] do
7: if (Occ[i] = 1) AND (P C[i] =high) then
8: if (M[i] =high) AND (DS[i] = 1)then
9: SensorData[i].Occupancy ←1
10: end if
11: end if
12: end for
13: end procedure
For data collection, we set up background devices to gather the data from various different sensors. As we gathered the data using a variety of devices, data integration is challenging.
Experiments and Results 21
Table 2.1: List of coefficients for each parameter for non-linear regression formula Experiment Temp (α) Humidity (β) CO2 (γ) Sound (δ) Pressure () Illumination (ζ) Coefficient (η)
Exp. 1 -29.55 -6.20 144.80 54.98 -12.15 83.59 -0.06 Exp. 2 - Max -26.96 -6.90 137.66 51.82 -12.32 83.00 -0.48 Exp. 2 - Min -40.50 -5.11 132.09 49.12 -15.81 74.82 6.43 Exp. 2 - Avg -31.59 -6.23 128.85 55.03 -13.28 82.40 1.57 Exp. 2 - Var 26.39 0.00 53.79 159.23 68.86 213.29 5.98 Exp. 3 0.00 0.00 0.00 96.57 0.00 64.46 -6.28
Some sensors’ data (temperature, humidity, illumination, CO2, sound and pressure) are
con-tinuous data, whereas the door open/close and web-based app data are events-based discrete data. We used the timestamp to integrate the data and generate the missing data using the interpolation method.
Each sensor datum was normalised between 0-1 to ensure consistency. The normalisation process was conducted for each type of sensor. All indoor human occupancy data from the web-based app input was converted to binary occupancy and was integrated with normalised sensor data using timestamp as the joint key.
2.5
Experiments and Results
In this chapter, we present three experiments with the data. The first experiment used the normalised raw data with the pre-processing method that was explained in the previous section. We used each of the data mining algorithms mentioned previously to determine the most accurate algorithm. In the second experiment, the normalised raw data were aggregated at ten-minute intervals. Several statistical features, such as maximum value (max), minimum
value (min), average value (µ) and variance (σ), were used for analysis. We adopted the same
data mining algorithms for each feature to see if the result differ from the first experiment. In the third experiment, the data were segmented into four temporal segments (morning, afternoon, evening, night) before using each data mining algorithm. This was done because every temporal segment has a different context that may indicate the difference in occupancy number (i.e. night time has fewer people), so this is a reasonable segmentation. We compared all three results and determined which condition generates the highest level of accuracy. Table 2.1 shows the coefficient results for Equation 2.1.
Experiments and Results 22
Figure 2.3: Root-mean-square Error Results of Various Machine Learning Algorithms.
2.5.1 Experiment 1 (Normalised Raw Data)
This experiment utilised a total of 32,152 normalised raw data points that were collected from
one single-person office room. Table 2.1 shows that CO2, light and sound are three dominant
features to be considered for human occupancy recognition. Random forest has the highest accuracy result and has a more stable performance across different feature sets compared to other machine learning algorithms. Figure 2.3 shows that most machine learning algorithms have low RMSE, with the exception of SVM. With this finding, the accuracy result can be trusted.
2.5.2 Experiment 2 (Ten-Minute Time Segments)
For the ten-minute time segments, four sets of features were extracted: data analysis with the
maximum value (max), the minimum value (min), the average value (µ) and variance (σ). For
the first three analyses (max, min and µ), the results were similar to Experiment 1