the Deployment of Small Cells in 2-Tier
Heterogeneous Wireless Networks
Dorathy Obianuju Abonyi
Department of Electronic and Electrical Engineering
The University of Sheffield
This dissertation is submitted for the degree of
Doctor of Philosophy
I hereby declare that except for where specific references are made to the works of others and duly acknowledged, the contents of this dissertation are original and the results of my own work. Nothing in it is an outcome of any collaboration except where specifically indicated in the text and the contents of this dissertation have not been submitted either in whole or part for consideration for any other degree or qualification except to this University.
Dorathy Obianuju Abonyi February 2019
First and foremost I thank the Almighty God who made it possible for me to make it to this final stage of my PhD research. For keeping me alive and taking care of my health through all the challenging periods of emotional, psychological and academic traumas. For being my hope in all hopelessness. God, am grateful!
I most sincerely thank my supervisor Dr Jonathan Rigelsford for his guidance, patience, contributions and support throughout this research. You are the best supervisor any researcher would wish to have, I am grateful Sir. My thanks also go to my second supervisor, Dr Lee Ford.
I deeply appreciate the patience, support and understanding from my husband, Hon. Dr. Godwin Ejikeme Abonyi and also thank him in a special way for proof reading my work not minding the professional diversity. Thanks for holding on and carrying the burden of bringing up the children all alone while I was away for study, you are awesome! An unquantifiable thanks goes to my lovely children, Onyedikachukwu, Chiamaka, Chibuokem, Nzubechukwu and Obianuju for four years of having a struggling mother in far away Europe not being available nor in a good state of mind to care and attend to your needs. At my worst moments, my thoughts of you all, kept me going. So thankful for your little voices of encouragement, "mummy, we are fine and we are praying for you to come back tomorrow", the tomorrow that kept reoccurring, most times we all ended in tears. You all have been wonderful and am happy to tell you that the ’tomorrow’ is here! God bless you all as I look forward to beholding you all soon.
Thanks to my other family members especially my mother, Mrs Susanna Mamah (Mama Uju) whose determination to train all her seven children through the university all alone having lost our daddy when I was only three built me up for hard work and determination. Mummy, I appreciate all your hard work and prayers, may God bless you and keep you in good health. To my sister Sochima for all the love, sacrifices and support, thanks so much. To all the people that kept my home running and showing love and care to my children; Blessing, Cecilia, Oge, Chidi and Celestina, God bless you all.
To my colleagues at C34, Portobello Center, University of Sheffield, friends at home and in United Kingdom and everyone I met in one way or the other on this PhD journey, I say thanks and God bless you all.
Due to the ever growing population of mobile device users and expansion on the number of devices and applications requiring data usage, there is an increasing demand for improved capacity in wireless cellular networks. Cell densification and 2-tier heterogeneous networks (HetNets) are two solutions which will assist 5G systems in meeting these growing capacity demands. Small-cell deployment over existing heterogeneous networks have been considered by researchers. Different strategies for deploying these small-cells within the existing network among which are random, cell-edge and high user concentration (HUC) have also been explored. Small cells deployed on locations of HUC offloads traffic from existing network infrastructure, ensure good Quality of Service (QoS) and balanced load in the network but there is a challenge of identifying HUC locations.
There has been considerable research performed into techniques for determining user location and cell deployment. Currently localization can be achieved using time dependent methods such as Time of Arrival (ToA), Time Difference of Arrival (TDoA), or Global Positioning Systems (GPS). GPS based solutions provide high accuracy user positioning but suffer from concerns over user privacy, and other time dependent approaches require regular synchronization which can be difficult to achieve in practice. Alternatively, Received Signal Strength (RSS) based solutions can provide simple anonymous user data, requiring no extra hardware within the mobile handset but often rely on triangulation from adjacent Base Stations (BS). In mobile cellular networks such solutions are therefore often only applicable near the cell edge, as installing additional BS would increase the complexity and cost of a network deployment.
The work presented in this thesis overcomes these limitations by providing an observer system for wireless networks that can be used to periodically monitor the cell coverage area and identify regions of high concentrations of users for possible small cell deployment in 2-tier heterogeneous networks. The observer system comprises of two collinear antennas separated byλ/2. The relative phase of each antenna was varied using a phase shifter so that
the combined output of the two antennas were used to create sum and difference radiation patterns, and to steer the antenna radiation pattern creating different azimuth positions for AoA estimation. Statistical regression analysis was used to develop range estimation models based on four different environment empirical pathloss models for user range estimation. Users were located into clusters by classifying them into azimuth-range classes and counting the number of users in each class. Locations for small cell deployment were identified
based on class population. BPEM, ADEM, BU EM, EARM and NLOSMit models were
developed for more accurate range estimation. A prototype system was implemented and tested both outdoor and indoor using a network of WiFi nodes. Experimental results show close relationship with simulation and an average PER in range estimation error of 80% by applying developed error models. Based on both simulation and experiment, system showed good performance.
By deploying micro-, pico-, or femto-cells in areas of higher user concentration, high data rates and good quality of service in the network can be maintained. The observer system provides the network manager with relative angle of arrival (AoA), distance estimation and relative location of user clusters within the cell. The observer system divides the cell into a series of azimuthal and range sectors, and determines which sector the users are located in. Simulation and a prototype design of the system is presented and results have shown system robustness and high accuracy for its purpose.
List of figures xvii
List of tables xxiii
List Symbols and Acronyms xxiv
1 Introduction 1
1.1 Research Background . . . 1
1.2 Motivation . . . 5
1.3 Research Problem Statement . . . 6
1.4 Proposed Approach . . . 7
1.5 Main Contribution Of Research . . . 8
1.5.1 List Of Publications . . . 10
1.6 Thesis Outline . . . 11
2 Literature Review 13 2.1 Introduction . . . 13
2.2 Overview of Wireless Networks . . . 13
2.2.1 Types of Wireless Network . . . 14
2.2.2 Cellular Networks . . . 14
2.2.3 Wireless Network Deployment . . . 15
2.2.4 Heterogeneous Networks . . . 16
2.2.5 WiFi Networks . . . 18
2.2.6 Internet of Things Technology . . . 19
2.2.7 Capacity and Coverage in Wireless Networks . . . 20
2.2.8 Capacity Enhancing Techniques . . . 20
2.2.9 Small Cell Deployment . . . 22
2.3.1 Radar . . . 24
2.3.2 Global Positioning System (GPS) . . . 26
2.3.3 Other Location Based Services (LBS) . . . 26
2.3.4 Localization In Wireless Networks . . . 27
2.3.5 Localization Classification . . . 28
2.4 Antenna Systems . . . 32
2.4.1 Antenna Array . . . 33
2.4.2 Broadside and Endfire Array . . . 34
2.4.3 Adaptive Antenna Systems . . . 35
2.4.4 Antenna Array Feed Network . . . 36
2.4.5 Two-Element Array System . . . 38
2.5 Delay and Sum Beam Steering . . . 39
2.5.1 Phase Delay Calculation . . . 40
2.5.2 Beam Scanning By Phase Weighting . . . 41
2.6 Phase Shifter . . . 41
2.6.1 Switched Line Phase Shifter (SLPS) . . . 42
2.6.2 Switched Line Phase Shifter Design . . . 43
2.6.3 RF Transmission Lines For SLPS Design . . . 43
2.7 Localization Algorithm in Mobile Networks . . . 44
2.8 Angle of Arrival Localization Algorithm . . . 44
2.8.1 Maximum Likelihood Estimation (MLE) . . . 46
2.8.2 Approximate Maximum Likelihood (AML) Estimation . . . 47
2.8.3 Hybrid Approximate Maximum Likelihood (HAML) Estimation . . 48
2.9 Range Estimation . . . 49
2.9.1 Time Of Arrival (TOA) Based Range Estimation . . . 49
2.9.2 Time Difference Of Arrival (TDOA) Based Range Estimation . . . 49
2.10 RSS Based Localization . . . 50
2.10.1 Radio Wave Propagation . . . 50
2.10.2 RSS Based Localization Algorithm . . . 52
2.10.3 RSS Fingerprinting . . . 53
2.10.4 Localization Systems Based on RSS . . . 53
2.11 Radio Location Errors . . . 54
2.12 Localization Performance Metrics . . . 54
2.13 Localization Applications . . . 55
3 System Modelling and Simulation 57
3.1 Introduction . . . 57
3.2 Simplified Hybrid Approximate Maximum Likelihood (SHAML) . . . 58
3.2.1 Error Mitigation in SHAML . . . 59
3.3 Proposed System Block Diagram . . . 59
3.4 Antenna Model . . . 61
3.4.1 A Half Wave Dipole Antenna Model . . . 61
3.4.2 High Gain Antenna Model . . . 61
3.4.3 Array System Modeling . . . 62
3.5 Grounded Coplanar Waveguide (GCPW) SLPS Design . . . 63
3.6 Radio Coverage and Channel Model . . . 65
3.6.1 Propagation Channel Link Model . . . 66
3.6.2 Received Signal Strength (RSS) Model . . . 67
3.7 Adaptive Array Smart Antenna Model . . . 69
3.7.1 Beam-forming and Beam-steering Simulation . . . 70
3.8 Environment Model . . . 70
3.8.1 Environment Pathloss Model Analysis . . . 72
3.8.2 Effect Of Environment On Measured RSS . . . 72
3.8.3 Effect Of Directional Beam On Measured RSS . . . 73
3.9 Localization algorithm . . . 74
3.9.1 Azimuth Location Position Model . . . 75
3.9.2 Angle Of Arrival Estimation Model . . . 77
3.9.3 Angle Of Arrival Estimation Of Sample Users . . . 77
3.10 Range Estimation . . . 79
3.10.1 Range Estimation Of Users In Known Environment . . . 83
3.11 Errors in Range Estimation . . . 84
3.11.1 Effect of Beam Position on Range Estimation . . . 85
3.11.2 Effect of User Azimuth Direction on Range Estimation . . . 86
3.11.3 Effect of Unknown Environment on Range Estimation . . . 87
3.11.4 Range Estimation Of Random Users In Unknown Environment . . 88
3.12 Range Estimation Error Prediction . . . 90
3.12.1 Error Due To Beam Position . . . 90
3.12.2 Beam Position Error Model (BPEM) . . . 90
3.12.3 Error Due To Angular Deviation . . . 92
3.12.5 Range Estimation Of Random Sample Users With BPEM and ADEM 95
3.12.6 Boundary User Error Model (BUEM) . . . 97
3.12.7 Performance Analysis of System Error Models . . . 98
3.12.8 Environment Adaptive Range Model (EARM) . . . 100
3.12.9 Noise Model . . . 103
3.13 System Application in 2-tier HetNet . . . 106
3.14 Effect Of Non Line Of Sight On Range Estimation . . . 107
3.15 Summary of Simulation Study . . . 109
4 System Implementation 113 4.1 Introduction . . . 113
4.2 Implementing Network . . . 113
4.3 Array System Implementation . . . 115
4.3.1 System Array Elements . . . 115
4.3.2 Antenna Array Testing . . . 115
4.3.3 Antenna Array Result and Analysis . . . 117
4.3.4 Antenna Array Measurement Error Investigation . . . 119
4.3.5 Antenna Array Radiation Pattern Of Interest . . . 120
4.4 Phase Shifter implementation . . . 121
4.4.1 SLPS Implementation with Coaxial Cables . . . 121
4.5 Phase shifter Testing . . . 123
4.5.1 Phase Measurement . . . 123
4.5.2 Phase Measurement Result Analysis . . . 124
4.5.3 Return Loss Result and Analysis . . . 125
4.6 Summing Array Output Implementation . . . 125
4.7 Small Cell Localization Algorithm Implementation . . . 127
4.7.1 Hardware Implementation . . . 127
4.7.2 Software Implementation of Network . . . 129
4.7.3 Data filtering and analysis . . . 134
4.7.4 User localization and small cell deployment Implementation . . . . 134
4.8 Conclusion . . . 135
5 Experimental Validation 137 5.1 Introduction . . . 137
5.2 Methodology . . . 137
5.2.2 Indoor Experimental Setup . . . 139
5.3 Outdoor Round-Trip RSS Measurement . . . 140
5.4 Outdoor RSS-Distance Relationship Test . . . 141
5.4.1 Outdoor Measured RSS Distribution . . . 142
5.4.2 Effect Of Noise on Measured RSS . . . 142
5.4.3 Attenuation Rate (Ar) . . . 144
5.4.4 Difference In Measured RSS Per Distance Test . . . 144
5.4.5 Measured RSS At Same Distance But Different Scans . . . 145
5.4.6 Experimental Range Estimation Model . . . 145
5.5 Outdoor Network Trial Experiment . . . 146
5.5.1 AoA Estimation . . . 147
5.5.2 Range Estimation and Environment Prediction . . . 148
5.5.3 User Cluster Localization And Small Cell Deployment . . . 150
5.6 Outdoor Final Experiment . . . 151
5.6.1 AoA Estimation . . . 152
5.6.2 Range Estimation and Environment Prediction . . . 152
5.6.3 User Cluster Localization And Small Cell Deployment . . . 155
5.7 Indoor Wireless Local Area Network Application . . . 156
5.7.1 Indoor Experimental AoA Estimation . . . 156
5.7.2 Indoor Experimental Range Estimation . . . 156
5.7.3 Indoor Experimental Range Estimation with NLOS Mitigation . . . 157
5.7.4 Indoor User Cluster Localization and Small Cell Deployment . . . 158
5.8 Conclusions . . . 159
6 Conclusions and Future Work 161 6.1 Conclusions . . . 161
6.2 Research Contribution To Science, Engineering and Technology . . . 163
6.3 Future Work . . . 165
References 167
1.1 Predicted global mobile data traffic from 2015 to 2021 [3] . . . 2
1.2 Problem background and proposed approach . . . 4
1.3 Problem background and proposed approach . . . 7
2.1 Traditional homogeneous network . . . 16
2.2 Heterogeneous Network: A mixture of high power macrocell and low power small cells . . . 17
2.3 Some small cell deployment strategies (a) Cell edge (b) Uniform small cell deployment strategies . . . 24
2.4 Some milestone in the history of tracking technology . . . 25
2.5 Layers of a localization system . . . 27
2.6 Radiating Regions . . . 33
2.7 Standard array system [144] used in adaptive smart antennas . . . 34
2.8 Radiation pattern for a 2 element array showing main beam on (a) broadside (b) end-fire . . . 35
2.9 Possible antenna array feed networks for 2 element array system (a) parallel (b) series approaches . . . 37
2.10 Two Dipole antenna array system showing plane wave arriving from broad-side direction of interest . . . 38
2.11 Required delay to steer main beam to positions (a) 135° (b) 45° (c) 180° (d) 0° 40 2.12 Switched Line phase shifter schematic with (a) SP2T (b) SP4T switches . . 42
2.13 Switched line phase shifter schematic . . . 43
2.14 Three major approaches to PCB transmission line design (a) microstrip (b) grounded coplanar waveguide (c) stripline . . . 44
2.15 Mobile device localization algorithm trend of research . . . 45
3.2 Localization system block diagram used in this work . . . 60
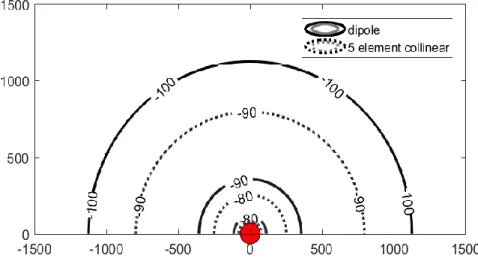
3.3 A single half-wave dipole antenna model showing Omni-directional radiation pattern on azimuth . . . 62
3.4 High gain collinear antenna model on CST . . . 63
3.5 Array radiation pattern simulation on CST . . . 63
3.6 PCB based phase shifter schematic design using diptrace software . . . 65
3.7 Designed phase shifter using diptrace software (a) top (b) Bottom layers . . 66
3.8 Modeled relative (a) range and (b) angle from the observer system position 66 3.9 Illustration of wireless communication channel for link budget calculation . 67 3.10 Effect of antenna gain on RSS and coverage range . . . 68
3.11 Beam-forming and beam-steering for (a) [0,0] (b) [120,0] (c) [0,120] phase (d) [180,0] phases (degrees) . . . 71
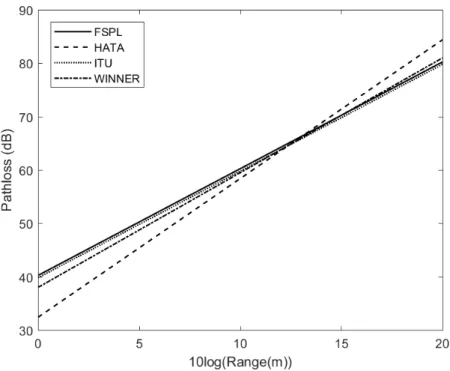
3.12 Four environment path loss characteristics based on empirical models of Table 3.7 in a log-log scale . . . 73
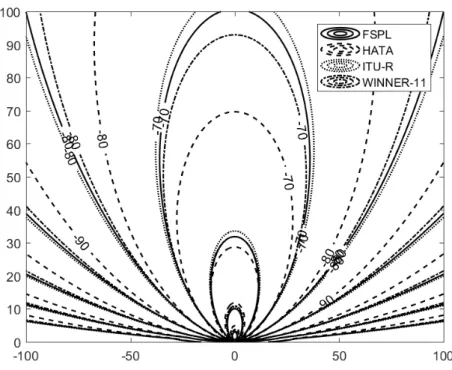
3.13 Calculated RSS with dipole omni-directional receiver antenna showing cov-erage in four different environments . . . 74
3.14 Calculated RSS with 2-element array receiver antenna showing greater direc-tional coverage in four different environments . . . 75
3.15 Illustration of (a) azimuthal sectors for AoA classification (b) range ring for cluster identification . . . 75
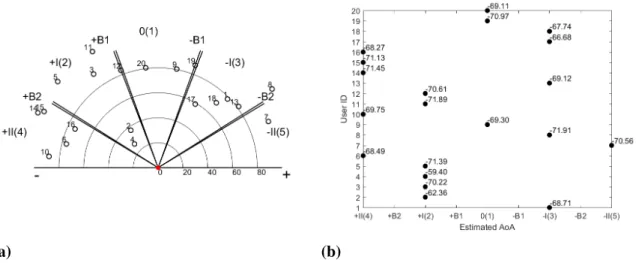
3.16 AoA Estimation of 20 random users (a) actual location (b) AoA classification of users . . . 79
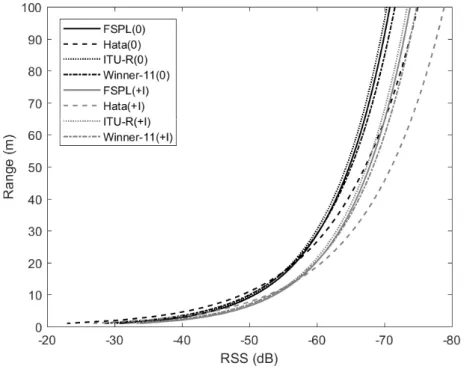
3.17 Range estimation models based on beam position in four environments . . . 80
3.18 FSPL range estimation model showing RSS-Range data and the 6th order polynomial curve fitting as an optimum fit for the data . . . 82
3.19 Range estimation of users in four different known ideal environments show-ing greater range error with users 1, 2, 3, 4, 5, 8, 12, 13, 17, 18 located in azimuth positions +I and -I but lesser error with other users because they were located in other azimuth positions . . . 84
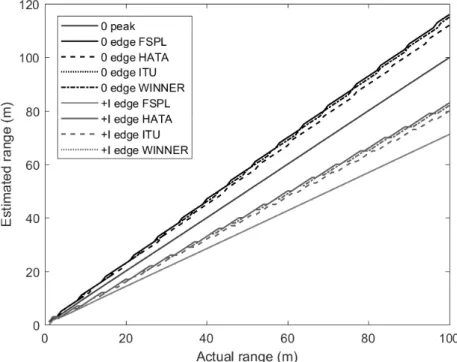
3.20 Range estimation in all known environments for both broadside and off broadside users showing over-estimation error as users are deviated from peak 85 3.21 Estimated range of azimuth peak users for four different environments show-ing correct estimation for broadside and difference users but under-estimation for left and right of broadside users . . . 86
3.22 Range estimation of FSPL beam edge users showing that there is difference in range estimation for users at +I position left and right edges . . . 87 3.23 Range estimation in unknown four environments using (a) FSPL, (b) HATA
(c) ITU-R (d) WINNER-11 range estimation models for users located at the center of azimuth position 0 showing that in ideal case, accurate estimation is only achieved with correct environment model . . . 88 3.24 Range estimation of randomly distributed users in unknown ideal (a) FSPL
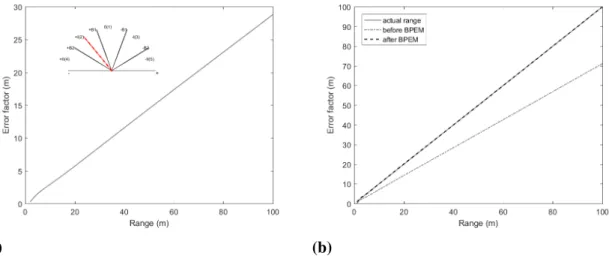
(b) HATA (c) ITU-R (d) WINNER-11 environments showing that randomly distributed users encounter different kinds of errors based user azimuth location but best estimate is achieved if environment is known . . . 89 3.25 Improved range estimate with BPEM (a) BPEV for development of BPEM
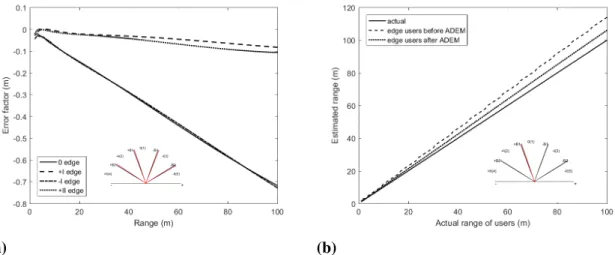
Equation (b) estimated range in FSPL environment for users in azimuth position +I centre before and after BPEM . . . 91 3.26 Angular deviation error model (ADEM) (a) angular deviation error model
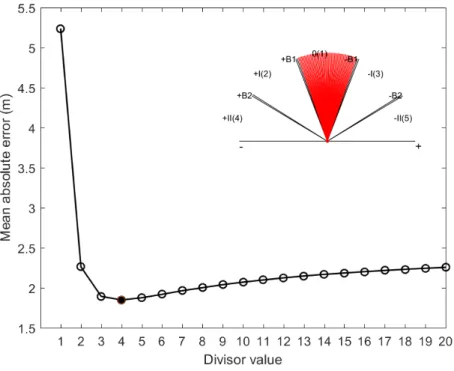
(ADEM) for FSPL environment based on half the residual (b) range estima-tion error reduced by half for +I azimuth posiestima-tion edge users . . . 93 3.27 Dividing factor used in developing ADEM to achieve optimum error
reduc-tion in range estimareduc-tion . . . 96 3.28 Range estimation of randomly distributed users (a) before (after BPEM) (b)
after ADEM showing better range estimation accuracy for users located at azimuth positions +I and -I and users deviated from the azimuth center . . . 97 3.29 Boundary user error model (BUEM) (a) calculated BUEV used to develop the
BUEM in all four environments (b) range estimation error of +B1 boundary users reduced by half . . . 98 3.30 Performance evaluation of BPEM, IADEM and BUEM using random sample
users . . . 101 3.31 Range prediction using estimated range in four different environments with
four range models in each environment for EARM development . . . 101 3.32 Boundary user error model using+B1 boundary users (a) error spread with
distance for±0.5 error in measured RSS (b)+B1 expected error for multiples of random error in measured RSS . . . 104 3.33 Measured RSS of twenty sample users at four main azimuth positions (a)
0 (b) +I (c) -I (d) +II with mean, median and mode to determine the best statistical tool for more accurate result . . . 105
3.34 Fifty distributed users in a macro-pico HetNet for user cluster localization and small cell deployment location identification . . . 107 3.35 User cluster localization (a) optimum location for small cell deployment (b)
coordinates of small cell deployment positions with opportunity for cell type deployment decision . . . 107 3.36 User cluster localization in a noisy environment (a) optimum location for
Small cell deployment in a noisy environment (b) coordinates of positions for Small cell deployment in a noisy environment . . . 108 3.37 Effect of NLOS on range estimation (a) line of sight and Non line of sight
ITU and WINNER channel models (b) estimated range before and after NLOS mitigation in WINNER environment . . . 110 4.1 Structural illustration of the observer system . . . 114 4.2 Input reflection coefficient (S11) test of the antennas used for the observer
system implementation . . . 116 4.3 Array measurement in GBSAR anechoic chamber (a) schematic setup (b)
experimental setup inside the chamber . . . 117 4.4 Array measurement in GBSAR anechoic chamber . . . 118 4.5 Measured RSS from the horn antenna transmitter by the array system receiver
at all phase states . . . 118 4.6 Angles of highest RSS for each antenna phase combinations showing unique
beam maximum radiation at all angles . . . 119 4.7 Phase offset error investigation showing that error is as a result of chamber
features and not the array system under test . . . 120 4.8 Measured and simulated array radiation patterns at each beam steered positions121 4.9 Implemented switched line phase shifter using two HMC241ALP3E SP4T
switches . . . 122 4.10 Phase Switching between PS1 and PS2 with (a) PS1 line 1 as reference (b)
PS2 line 1 as reference showing phase switching at−179° . . . 124 4.11 Phase shiftS11measurement of PS1 . . . 126 4.12 Input reflection coefficient measurement (S11) of the 2 Way SMA power
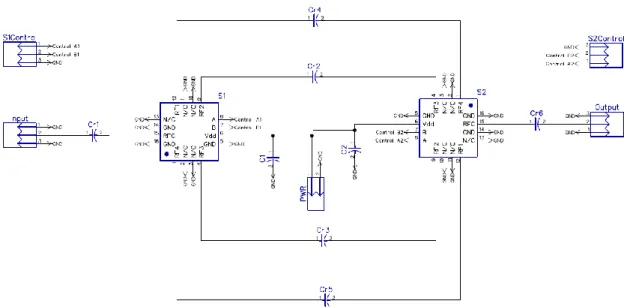
combiner to ensure proper impedance matching and good radio wave radiation127 4.13 Hardware implementation of network users (a) ESP8266 Thing used for
4.14 Implemented hardware of the observer system showing both internal and external circuitries . . . 129 5.1 Outdoor experimental setup showing some of the distributed users on red
and deployed observer system on yellow . . . 139 5.2 Indoor experimental setup . . . 139 5.3 On-the-fly to and fro movement from 1 to 100m to check RSS-distance
relationship . . . 140 5.4 Ten measured RSS using omni-directional antenna to test RSS-distance
hypothesis . . . 141 5.5 Histogram plot of average measured RSS to check the distribution of
mea-sured RSS data . . . 143 5.6 Deviation of measured RSS at each distance for ten scans (a) deviation from
mean RSS (b) amount of deviation . . . 143 5.7 Comparison of simulated and experimental (a) RSS (dBm) in relation to
distance (b) attenuation rate . . . 146 5.8 User deployment for trial experiment showing (a) actual user position before
localization (b) measured RSS from user devices at all azimuth positions . . 147 5.9 AoA estimation results (a) experiment (b) simulation showing accurate AoA
estimation for both simulation and experiment . . . 148 5.10 Experimental range estimation showing actual, simulated and experimental
estimate . . . 150 5.11 User cluster localization and optimum small cell deployment position
identi-fication using (a) experimental (b) simulation data . . . 151 5.12 User deployment for final experiment showing (a) actual user position before
localization (b) measured RSS from user devices at all azimuth positions . . 152 5.13 AoA Estimation Results (a) experiment (b) simulation showing accurate
AoA estimation for both simulation and experiment . . . 153 5.14 Estimated range of users using all four range models with experimental
measured RSS as input . . . 153 5.15 Experimental validation of developed error models showing mean absolute
error in range estimation after AARM, BPEM, ADEM and BUEM . . . 154 5.16 Experimental small cell deployment strategy showing (a) user cluster
5.17 User deployment for Indoor experiment showing (a) actual user position before localization (b) measured RSS from user devices at all azimuth positions156 5.18 AoA Estimation Results (a) Experiment (b) Simulation showing accurate
AoA estimation for both simulation and experiment in indoor environment . 157 5.19 Actual, simulated and experimental range estimated in indoor environment
using all four range estimation models before NLOS mitigation . . . 157 5.20 Indoor Experimental range estimation with all four range estimation models
after NLOS mitigation using (a) ITU (b) WINNER based NLOS mitigation models . . . 158 5.21 Indoor cluster localization and small cell deployment positions (a) before (b)
2.1 Common Types of Wireless Network . . . 14 2.2 Wifi protocols and data rate . . . 19 3.1 Simulation parameters . . . 61 3.2 Collinear antenna CST modeling parameters . . . 62 3.3 Antenna array radiation pattern simulation on CST . . . 64 3.4 CST calculated phase shifts for frequency span of 2.4 to 2.5GHz . . . 64 3.5 CST calculated phase shifts for frequency span of 2.4 to 2.5GHz . . . 65 3.6 Simulated result of RSS by two different antennas . . . 68 3.7 Propagation Models Applied for Line of Sight (LOS) Channel Modeling . . 72 3.8 Range estimation model equations for four azimuth positions in different
environments . . . 82 3.9 Mean absolute error in range estimation of users for all environments using
all range models . . . 89 3.10 ADEM equations for four main azimuth positions in different environments 93 3.11 IADEM equations for four main azimuth positions in different environments 96 3.12 BUEM equations for four main azimuth positions in different environments 98 3.13 Performance evaluation of BPEM, IADEM and BUEM using systematic users100 3.14 Environment adaptive range estimation models . . . 102 3.15 Mean absolute error after EARM for four different environments . . . 103 3.16 Statistical Evaluation of Measured RSS with Random Noise . . . 105 3.17 LTE-A Parameters For Simulation . . . 106 3.18 Range Estimation Model Equations For Four azimuth Positions in Different
Environments . . . 108 4.1 Control Truth Table Of SLPS design . . . 123 4.2 Measured Phase Result of PS1 and PS2 . . . 124
4.3 Phase Plot Over Frequency Span of 2.4 to 2.5GHz . . . 125 4.4 System Control Truth Table . . . 129 5.1 Correlation between different scans for the same distance range . . . 145
Introduction
1.1
Research Background
Mobile devices have been a driving force to wireless technological growth since the inception of mobile phones in 1973. Mobile phone technology constantly grew from a device for wireless voice calls to a hand-held machine that is capable of doing everything that can be imagined of a computer system and even more. Smartphones and tablets are hand-held data hungry computers that have the capability of making a voice call, browsing the internet, sending media data etc. Mobile devices became very popular and unavoidable because of the convenience of doing things on the go and with their friendly mobile applications that make life easy and interesting. There has therefore, been a constant growth in mobile device usage as compared to a desktop computer. According to Comscore’s mobile data 2017, mobile devices have become the leading digital platform, with majority of activities on smartphones and tablets [1].
The availability and affordability of smartphones with expansion in mobile app usage led to an exponential growth [2] in number of mobile device users generating traffic concern on existing network infrastructure. Due to insecurity in the world and development in the mode of teaching and assessment in education system, age groups of people that use mobile phones have also expanded from fully grown adults to youths and children as well. Data by Cisco’s Global Visual Networking Index (VNI) of Figure 1.1 shows that by 2021, there will be 11.6 billion mobile-connected devices generating mobile data traffic of 49 billion gigabytes per month as against 7 billion gigabytes for 2016 [3]. This growth is mostly caused by tremendous increase in the number of smart phones and machine to machine (M2M) modules like wearable devices and IoT devices — most of which have embedded cellular
Fig. 1.1Predicted global mobile data traffic from 2015 to 2021 [3]
connections. By Cisco’s prediction, there will be more mobile-connected devices than the human population by 2021.
In other to cope with traffic requirements of future wireless networks [4] driven by increasing number of mobile broadband data subscribers and bandwidth-intensive services competing for limited radio resources, there is need for increased capacity to keep up with these challenges. Network Operators have tried meeting this challenge by increasing capacity with new radio spectrum, adding multi-antenna techniques and implementing more efficient modulation and coding schemes. Unfortunately spectrum is very expensive and rarely available, there are limit to the number of antennas that can be used in a single mast and more efficient modulation scheme results in increased complexity of the system.
Network densification which means adding more cell sites and bringing the network closer to users is another option the operators are exploring. This can be achieved by adding more sectors or by reducing the macro-cell site area and maintaining a homogeneous network. This is not economical and such cell sites are not always available especially in city centers.
Another way is to underlay low power small cells within the existing macro-cell and integrate them to work together forming a heterogeneous network (HetNet) [5, 6]. Small cells can be a microcell, picocell, femtocell or a relay depending on the size of its coverage area and its transmission power. Site acquisition is easier and cheaper with small cell base transceiver station (BTS) equipment as they are correspondingly smaller.
Appropriately deployed small cell will offload traffic from macrocell, ensure good Quality Of Service (QoS) and balanced load in the network. Small cells can be deployed randomly within the macrocell[7], at the cell edge[8, 9], around high traffic user [10] or within high user concentration (HUC) location [11]. Though there is fear over random small cell deployment, [12] proposed an analytical framework to test probability of outage in heterogeneous cellular network and reports that random deployment does not affect quality of service. It was reported in [5] that small cells are under-loaded unless they are deployed in dense traffic locations. This implies that even though a randomly deployed small cell does not reduce the quality of service, it can be under-loaded causing waste of network resources and can be a potential source of interference in the network. On the other hand, it may not necessarily offload the traffic from macrocell especially when it falls in no or less user locations. Cell edge deployment strategy will provide better quality signal to users at the cell edge but will not offload the traffic from macrocell since there may be only but few users at the cell edge to use the network. Heavy user location may by some percentage offload traffic from the macrocell but need traffic data recording for years to be able to identify location of heavy users. Deployment of small cells in HUC location will offload considerable amount of traffic from the macrocell and balance the load on the network by removing a chunk of users from the big cell but then, the operators need to be able to identify locations of HUC.
In traditional network planning, sites are selected and base station (BS) environment modeled using RF tools. Optimal balance between capacity and coverage was achieved in homogeneous network using this traditional network-centric design. This traditional homogeneous network deployment strategy solved the capacity problem of early network but it is not a good solution for the traffic requirement of present and future network where hotspots are inevitable. Hotspots are persistent cluster of users in an existing network which were not considered in the original network planning. Heterogeneous network is a solution that will help operators meet up with capacity requirement of 5G. Network operators primarily deploy small cells to increase capacity in hotspots like airports, hotels, coffee shops, stadium and other places where business people tend to congregate. These areas are hotspots expected location and traffic solution can be provided by deploying small cells. Researchers are also exploring using WiFi in hotspots to offload traffic from cellular networks [13]. Due
to development, migration and unemployment in developing countries like Nigeria and india, unexpected hotspots are very common. In some dynamic expected hot spots like sports stadium, traffic and small cell requirement may not be the same at all times. A mobile small cell deployment strategy for unexpected hotspots was proposed in [14] with the assumption that the operators are able to identify locations of hotspots. If operators are able to identify hotspots, small cells will be promptly and optimally deployed to offload traffic from existing network infrastructure and ensure good service quality in the network. There is therefore need to periodically monitor the macro-cell coverage area to be able to identify areas of traffic hot and dead zones for prompt and optimal deployment of a small cell to ensure maintained QoS and traffic load balance within the network.
A precise location is not a necessity in this case since anywhere within the highly populated area will still serve as an optimum position for small cell deployment. For instance, Figure 1.2 is a recruitment scene at Abuja national stadium, Nigeria where applicants gathered for Nigerian immigration service recruitment test on March 15th, 2014. This is a typical
Fig. 1.2Problem background and proposed approach
hotspot scenario and deploying a small cell any where within this area, examples shown with red circles will still offer the solution expected of the small cell. In this research therefore, an area location within which a small cell can be deployed is of interest and not a precise location. Currently localization can be achieved using time dependent methods such as time of arrival (TOA) [15], time difference of arrival (TDOA) [16] or global positioning systems
(GPS). GPS based solutions provide high accuracy user positioning but suffer from concerns over user privacy [17] and indoor usage. Other time dependent approaches require regular synchronization which can be difficult to achieve in practice. Alternatively, received signal strength (RSS) based solutions can provide simple anonymous user data, requiring no extra hardware within the mobile handset but often rely on triangulation [18, 19] from adjacent BTS. In mobile cellular networks such solutions are therefore often only applicable near the cell edge as installing additional base station (BS) would increase the complexity and cost of a network deployment.
The work presented in this thesis aims to overcome these limitations by providing an observer system that can be easily incorporated in a wireless network BTS with low complexity. This system can be used to periodically monitor the cell coverage area and identify regions of high concentrations of mobile users for possible small cell deployment in 2-tier heterogeneous networks.
1.2
Motivation
Due to continuous growth in wireless network and the traffic demand that accompany it, there is a need to balance the ever growing demand with network facilities to ensure good quality of service within the network. Led by poor, expensive and unreliable internet services in my home country, Nigeria due to unavailability of fixed access and total dependence on limited mobile broadband (3G and 4G), numerous amount of people connect to the network at the same time from Universities, businesses, job centers etc. making the services frustrating and unusable. Cell densification and 2-tier heterogeneous networks (HetNets) are two solutions which will assist future wireless networks like 5G systems in meeting these growing capacity demands. Due to developmental, political and social nature of man, users tend to cluster in certain locations causing hotspots. In developing countries like Nigeria where unemployment is an issue, any job interview centre is a potential unexpected hotspot. In some other countries, unexpected hotspots are created for different reasons like sales in shops, sporting events, shows and promotions etc. In busy places like airports, stadia and universities, hotspots are inevitable. Appropriately deployed small-cells offload traffic from a macro-cell and ensure balanced load as well as good quality of service (QoS) in the network. HetNet planning was usually based on expected user distribution and long-term collection of mobile traffic data which creates latency in small cell deployment and would not solve the problem of promptly offloading traffic from the umbrella cell to effect a balance in the network for an unexpected hotspots. If the network coverage area is periodically monitored and relative locations for small cell deployment displayed on a laptop or phone screen, the operator is able to identify locations of hotspots as they occur and be able to deploy say
mobile small cell with little or no delay. Deployment time will only be based on efficiency of network operator and other factors like road traffic as the small cell is being conveyed to the identified deployment location.
Small cell deployment strategies in literature focused more on positions to deploy small cells and mathematical algorithms that optimizes the positions for better throughput, in most cases with the assumption that the operators can identify those locations. Different strategies for small cell deployment in high user concentration location have been proposed in [14, 20] but with the assumption that locations of hotspots are known by the operators. According to the report by Real Wireless for OfCom [21] on Techniques for increasing the capacity of wireless broadband networks: UK, 2012-2030, it was reported that if the operators would be able to identify locations of hotspots, effective use of outdoor small cells would provide a low cost solution to capacity problems in wireless networks. To the best of our knowledge, there is no system in place or in any research paper that proposes a practical approach that will help operators to promptly identify locations of hotspots. The aim is for the location algorithm to have a level of accuracy which is within the reasonable constraints of the urban built environment i.e±5 to 15m.
Our research question is: "Is it possible to develop a system that can easily be integrated into the existing network infrastructure to help wireless network operators promptly identify locations for small cell deployment in a two tier heterogeneous network?"
1.3
Research Problem Statement
Consider a tri-sector network base transceiver station (BTS) with hexagonal homogeneous macrocells as illustrated in Figure1.3 and considering only 180 degrees coverage of this network. A cell or multiple cells within the network have obvious clusters of users within the cell causing an overload on the macrocell bts servicing those cells resulting in low quality service and customer dissatisfaction. Deploying a small cell BTS randomly [22] have no certainty of offloading traffic from the big cell. On the other hand, deploying small cell uniformly among the three cell will result to a waste of resources as the three cells do not equally need the same amount of small cells. If small cells are deployed round the cell edge [23], loads of resources will be wasted and most of the small cells will be under utilized such that instead of being an advantage, they will become a disadvantage causing interference in the network. This indicates that the aim of HetNet will not be achieved by blind or random placement of small cells in this network. Only by deploying small cells to areas of HUC will the full potential of multi-tier HetNets be achieved.
Fig. 1.3Problem background and proposed approach
1.4
Proposed Approach
The approach in this research is to share the network space into azimuth sectors and range from a reference point. With an observer system to monitor the entire space, users sector angle as well as range are calculated to group users into clusters in each angle-range sector. By calculating the number of users in each section of the space, locations for small cell deployment is identified based on the area with high user concentration.
Considering a tri-sector wireless network of Figure 1.3 for example, using a directional beam and beam steering the coverage space is shared into azimuth locations defined by beam positions as shown in Figure 1.3 meaning that AoA estimation model can be developed based on how RSS measured from each azimuth position compares with RSS measured from other azimuth positions. By further sharing the coverage area into range sections of defined intervals, the entire space is divided into angle-range sections creating different azimuth-range classes for user cluster localization and small cell deployment. Depending on the operator agreed threshold of number of users for small cell deployment and the types of small cell, locations for small cell deployment can be identified. This research focuses only on a 180° coverage but can be expanded to 360° coverage in future work.
1.5
Main Contribution Of Research
In this research, a novel and practical small cell deployment strategy for a 2-tier HetNet has been proposed and also a prototype system was designed to demonstrate the proposed strategy. The main contributions in this research include:
• A practical approach that will help operators identify optimum locations for small cell deployment with minimal adjustment to the existing network infrastructure is presented in this research.
• Secondly, a strategy that will help mobile operators make good decisions on the type of small cell to be deployed based on the number of users in each cluster is also presented. • Third, a simple yet effective RSS based angle of arrival estimation algorithm that can
be applied in any localization system both indoor and outdoor has been simulated and experimented.
• Forth, a simple range estimation model that is both environment and angle adaptive (angle adaptive range model (AARM)) for the purpose of reduced error in estimation has been simulated and experimented. On the range estimation, three error models which include beam position error model (BPEM), angular deviation error model (ADEM), boundary user error model (BUEM) and also a model for environment adap-tive range estimation (environment adapadap-tive range model (EARM)) were developed for application in RSS based range estimation systems.
• Fifth, a novel but simple switched line phase shifter on a printed circuit board for phase switching of 60° step that can be applied in a phased array antenna system for array scanning has been designed and implemented.
• Finally, simulation and experimentation of a simple but accurate localization system for user and user-cluster localization in a wireless network has been carried out. This can also be applied to identify a particular room where a user is located like in the case of elderly in an emergency cases.
Large-scale path loss and small-scale fading statistics are parameters obtained prior to deployment of a new network BS. These are calculated by determining the appropriate propagation characteristics (pathloss and multipath) of the deployment environment. With the pathloss information, the network coverage as well as BS placement and optimization is determined. The statistics of small-scale fading provides information on local field variation which is used for calculation of parameters used in improving the design of radio receiver and to mitigate against multipath fading. Among the approaches for Pathloss prediction are empirical models. These are a set of equations obtained from extensive field measurement
that qualitatively describe different environment scenarios like open, urban, suburban and rural areas. Though not as accurate as theoretical or site-specific models, it is known for its simplicity [24]. This research applied four different empirical pathloss models to characterize radio propagation and develop range estimation models so that in unknown open environment each model is used to estimate rate and most likely environment predicted. This means that instead of generalizing the open space environment, the most likely open space for better accuracy can be obtained. The novelty of this research can be summarized in three places as follows;
⇒ Novelty Of Application: In the literature, there is no practical solution to network operators identifying locations for small cell deployment. This is an entirely new strategy for optimal small cell deployment with optimum position detection. Adopting the application of a localization system in this area of wireless network is novel because to the best of our knowledge, there is no place in literature where localization system is applied to identify locations for small cell deployment. The deploying network environment is assumed to be one of the four implemented radio propagation environments. The network coverage area is segmented into a series of azimuth classes defined by beam position and also relative range from the BS. Each of the implemented propagation models are applied to classify users as clusters into each of the azimuth-range classes. Based on the environment model that returns average least error in azimuth-range estimation of all deployed users, most likely model is predicted. Estimations by the predicted environment is displayed giving operators the ability to identify locations of user cluster for small cell deployment.
⇒ Novelty Of System: The existing theory of beam-forming and beam-steering was adopted to develop an AoA and range based system with minimal possible number of antennas. Phased array antenna systems were characterized with multiple antennas but this system was developed with only two antennas. A new idea of sharing the network coverage area into azimuthal positions defined by the beam positions was also developed. By adopting the statistical regression analysis, range estimation model was developed for four different environments which resolves user range in real time and based on all users estimated range in an unknown environment, predicts the closest environment among all four range models. This is the first practical localization system with only 2 antenna elements that resolve AoA, range, user cluster as well as predict most likely environment using only measured RSS. The simplicity of approach makes it attractive.
⇒ Novelty Of Algorithm:A novel centralized hybrid AoA/RSS localization algorithm with only one BS and one phase has been developed. The existing AoA/RSS algorithms are based on fingerprinting which involves two phases or based on using at lease two base stations but the approach in this research has bypassed multiple BS and phases by using only RSS data measured from only one BS to estimate both AoA and range in real time without the need for off-line phase. Normally the offline phase is to obtain accurate propagation of the deployment environment but this algorithm uses four closely related empirical models (open space) that estimates range and predicts the most likely model out of all implemented models for more accurate localization. In case of non line of sight application (NLOS), the algorithm incorporates NLOS mitigation factor to compensate for NLOS effect. The algorithm in this research promotes customer privacy as it works with new assigned IDs of users with only measured RSS which makes it anonymous.
Based on the listed contributions of the research, the following publications have been achieved and three journal papers in the pipeline.
1.5.1
List Of Publications
1. Dorathy Abonyi, Jonathan Michael Rigelsford, "Localisation system for network planning in 2-tier heterogeneous networks", Progress In Electromagnetics Research Symposium (PIERS), Shanghai, China, Aug. 2016.
2. Dorathy O Abonyi, Jonathan M Rigelsford, "A hardware localisation system for ZigBee wireless sensor networks", Progress In Electromagnetics Research Symposium (PIERS), Shanghai, China, Aug. 2016.
3. Dorathy O Abonyi, Jonathan M Rigelsford, "Cellular Network Load Balancing Strategy For Unexpected Hotspots in Developing Countries", International Conference of Women Engineers and Scientists (ICWES), New Dehli, India, Oct. 2017.
4. Dorathy O Abonyi, Jonathan M Rigelsford, "A System for Optimizing Small-Cell Deployment in 2-Tier HetNets", International Workshop on Computer Aided Modeling and Design of Communication Links and Networks (CAMAD), Barcelona, Spain, Sep. 2018.
Based on the key novelty areas mentioned above, the following journal papers are on the pipeline to be sent out for publication;
(a) Dorathy Abonyi, Jonathan Michael Rigelsford, "A Novel Strategy For Prompt Small-Cell Deployment in 2-Tier HetNets".
(b) Dorathy O Abonyi, Jonathan M Rigelsford, "An Observer System for Optimizing Small-Cell Deployment in 2-Tier HetNets".
(c) Dorathy O Abonyi, Jonathan M Rigelsford, "Localization Algorithm For Opti-mizing Small-Cell Deployment in 2-Tier HetNets".
1.6
Thesis Outline
Chapter 1 is an introduction to the research which includes motivation, problem statement and the objective to meet up with in this research. Chapter 2 is a review of the literature within the research area, Chapter 3 presents the system block diagram and the models of the individual components as well as the system simulation which shows the possibility of this system working in real sense. Chapter 4 is the system hardware implementation and Chapter 5 is the experimental validation in both indoor and outdoor scenarios. Chapter 6 concludes the thesis and draws attention to future work.
Literature Review
2.1
Introduction
Right from the beginning of mankind, man has always been inquisitive of finding where things are in the universe. The birth of wireless technology and the onset of world war II promoted the technology of finding objects popularly known as localization. The very popular and foremost technology was applied in radar systems for military tracking of enemy ships and aeroplanes. From this, other localization technologies using mobile phones and other radio devices emerged. This chapter looks at the technology of wireless networks, capacity requirements/improvement and then localization itself. It also reviews literature on phased array antennas, beam steering and phase shifters.
2.2
Overview of Wireless Networks
Wireless networks are one of the most transforming technology of the past decade enabling unprecedented connectivity, user convenience and mobility [25]. Users are able to access all on-line services (email, web browsing etc) regardless of location, time or circumstances. Users at present are proactive about finding wireless network connectivity like looking for a wifi hotspot to connect to but the future wireless network looks forward to an omnipresent connectivity. Due to different multiple use cases and applications of wireless networks, many wireless technology exist. These include; WiFi, Bluetooth, ZigBee, Near Field Communication (NFC), earlier 3G standards, Worldwide Interoperability for Microwave Access (WiMAX), Long-Term Evolution (LTE), High Speed Packet Access (HSPA), Long-Term Evolution Advance (LTE-A), 5G, Evolution-Data Optimized (EV-DO), satellite services etc. Not withstanding the diversity, most wireless technologies operate on common principles, have common trade-offs, and are subject to common performance criteria and constraints. Although the mechanics of data delivery through radio communication are
fundamentally different, all applications perform well creating the same user experience. This section explores some wireless technologies and their standards with more interest on using small cell to improve capacity.
2.2.1
Types of Wireless Network
Communication between devices in wireless network is achieved using electromagnetic waves like radio frequencies (RF), infra-red etc. Within the radio communication platform, there are different technologies designed for use at different scales, topologies, and for different applications as summarized in Table 2.1. Global technological specifications and standards are made by Institute of Electrical and Electronics Engineers (IEEE) and wireless work group is IEEE 802, they develop and maintain networking standards and recommend practices for local, metropolitan, and other area networks.
Table 2.1Common Types of Wireless Network
Type Range Applications Standards Personal area
net-work (PAN)
Within reach of a per-son Cable replacement for peripherals Bluetooth (IEEE 802.15.1), ZigBee (IEEE 802.15.4) , Near Field Commu-nication (NFC) Local area network
(LAN) Within a building or campus Wireless extension of wired network IEEE 802.11 (WiFi) Metropolitan area network (MAN)
Within a city Wireless inter-network connectivity
IEEE 802.15 (WiMAX)
Wide area network (WAN)
Worldwide Wireless network ac-cess
Cellular (UMTS, LTE, etc.)
2.2.2
Cellular Networks
A Cellular network is a type of wireless area network which achieve long range wireless connectivity using cells, each served by at least one fixed-location transceiver called the base station (BS). Cellular communication technology has many technical standards, which are named according to their generation, such as 1G, 2G, 3G, 4G and 5G with increasing data rates.
Improving capacity using small cells in cellular networks started with 1G when analog Advanced Mobile Phone Service (AMPS) operators deployed micro-cells of 100 meter radius and inter-cell distance of 200 meters at the corners of nearby cities in North America. This provided a good solution to traffic and customer satisfaction was assured but it was quite expensive [26]. GSM (2G) provided a lower cost solution with better performance using extra spectrum, high spectrum efficiency and frequency reuse capability thereby reducing the
need for small cells [27, 28]. A laptop size 2G pico-cell BTS existed. Technological advances for efficient spectrum usage such as MIMO and high order modulation were alternatives that delayed the expansion of small cells during this time. On the other hand, small cell required excessively high operational expenditure requiring leased line for backhaul. Moreover at this time there was limited traffic pressure for mobile broadband to necessitate the need for small cells. Small cells in 3G needed an entire carrier to operate but operator had only limited carriers. At this time, small cells were seen as an offload technique but in 4G, the principle of heterogeneous network (HetNet) was introduced where the mobile network is constructed with layers of small and large cells from where small cells became popular [29].
LTE and LTE-A are the driving force for small cells. A major requirement in 3GPP Release 12 was the need to support rapid increase in mobile data usage [30] of which small cells for LTE was one of the resolutions. Three main purposes for small cell deployment in LTE and LTE-A are first to increase capacity density in areas with high user densities mostly in (indoor) public places, dense urban areas and inside buildings with a high subscriber density [31]. Second, to improve coverage and thus available data rates and service quality in user-dense, marginal-coverage areas that cannot be adequately reached by macro cells such as at cell edges or in “black spots,” both outdoors and indoors [32]. Third, to extend handset battery life raised up by higher-order modulations, broader bandwidth, MIMO, and enhanced processor power. The energy efficiency of small cell deployment was analysed in [33].
2.2.3
Wireless Network Deployment
To deploy a wireless network, first operators decide the type of wireless network to be deployed by considering expected number of users to serve, type of traffic, the amount of throughput to provide and the number of access points or cells needed and placement positions to achieve optimal coverage. This is done by interviewing stakeholders or by using network monitoring tool. This enables the operator to gather information about the goals and expected uses of the wireless network. Secondly, the operator carries out a predictive site survey using a planning tool to estimate how many APs or cells are needed, where to place them and the required power levels to set so as to meet the coverage and capacity requirements. Lastly a manual real-time site survey is carried out to verify the accuracy of predictive survey to the real environment of application. Necessary adjustments are then made to realize the network design goals and deliver a wireless solution that meets the level of service required. This traditional network deployment strategy results in a well organized uniform cell/AP of Figure 2.1 known as a homogeneous network [34] which is not a sufficient solution for capacity in present day wireless networks. A homogeneous network is therefore a network with the same access technology like a cellular network of
Fig. 2.1Traditional homogeneous network
only macrocells or a network of only WiFi. An improved performance in homogeneous network using reconfigurable antennas that switches between narrow beam and wide beam was explored in [35].
2.2.4
Heterogeneous Networks
A heterogeneous network (HetNet) is a network with different formats of base stations, access technologies and power levels. For example, a Wide Area Network that uses macro-cells, picomacro-cells, and/or femtocells in order to offer wireless coverage in an environment with a wide variety of wireless coverage zones, ranging from an open outdoor environment to office buildings, homes, and underground areas as shown in Figure 2.2 is referred to as a HetNet. These low power nodes are overlaid on existing cells of homogeneous network to achieve higher coverage and capacity as well as proximity between transmitter and receiver ensuring a better QoS [36]. Different tiers of HetNet exist, while macro cells are used to provide coverage, pico cells and micro cells are used to enhance capacity in busy and hotspot areas. Femto cells and Wi-Fi are used at the offices and at homes. Deployment of these low power cells are key feature of the HetNet approach as they are flexible with their placement positions. Wi-Fi plays a significant role in HetNets, both in terms of data offload and in terms of roaming, especially between an outdoor and indoor environments. Proper cell planning is required to ensure optimal performance in a HetNet.
Cell planning optimization is driven by three main factors which include, interference, radio propagation and user locations [37]. A considerable amount of work has focused on resource management and interference mitigation in heterogeneous networks [38, 39]. Modeling techniques that are used for optimized cellular network include:
internet Core network wide area macrocell DAS Fibre optics picocell femtocell Relay gateway
Fig. 2.2Heterogeneous Network: A mixture of high power macrocell and low power small cells
1. Monte-Carlo cell model which is a simulation based approach involving multi-effect which cannot be easily described using mathematical functions like pathloss models, antenna patterns, ray tracing, terrain, cluster and specific cell configuration data. A large volume of data is required to model a specific site. The Monte-Carlo simulation model is used with detailed terrain maps and ray-tracing pathloss model so that given a set of possible small cell deployment locations, the optimal positions are determined using any of the optimization techniques like integer programming, genetic programming or simulated annealing. Monte-Carlo simulation approach was described in [40].
2. Stochastic geometry model which is a statistical approach used to capture network performance in a non-uniform network deployment scenario. In this approach, only stochastic effects which are mathematically resolvable are included. A tutorial descrip-tion of this approach is presented in [41].
3. Single cell linear model which is a deterministic model that captures the performance of a single cell in a multi-cell network [42]. In this approach only a dominating interfering BS is considered which gives it a limitation.
4. Automated small cell deployment position approach which uses knowledge of existing cell, user locations and the propagation environment to develop an algorithm that determines the optimal location for new small cell deployment in HetNets. This is the state-of-art approach. The work in [43] presented a theoretical solution where a closed-form mathematical expression that maximizes the throughput given some key statistical parameters of the network was derived. Another theoretical solution was
presented in [42] where a theoretical framework that considers the effect of interference and capacity saturation to determine the optimal small cell deployment positions was presented. The work presented in [37] focused on optimizing the cell deployment location based on the interference pattern for a given user distribution and propagation model. By simulation with real network data, this researcher found out that network degradation occurs when optimal small cell deployment is not determined but an intelligent HetNet with low complexity results when optimum positions are known prior to deployment.
These and other recent works [44–46] have presented theoretical optimization solution for automated small cell deployment in HetNet. Non of these approaches have given a practical solution that will help network operators to be able to determine optimum positions for small cell deployment with less latency in deployment decision taking.
2.2.5
WiFi Networks
WiFi is a WLAN protocol based on the 802.11 IEEE network standard, operating in the 2.4 and 5 GHz Industrial, Scientific and Medical (ISM) radio bands. It is the most popular means of wireless data communication. To keep up with capacity requirement driven by more users and traffic requirement, there has been a constant improvement on the technology resulting in different existing protocols as summarized in Table 2.2. WiFi has a range of approximately 70 meters. With continuous increase in deployment of WiFi hotspots in both home and public indoor environments, indoor localization using WiFi infrastructures is being intensively studied [47–50]. Wifi networks are deployed in hotspots, where there are multiple users like in hotels, airports, coffee shops etc. Hotspots are generally owned by Wireless service providers (WSP) and technically they consist of one or several wireless access points (APs) installed inside buildings and/or adjoining outdoor areas.
Access points are small physical devices consisting of radio transceivers, antennas and device firmware closely resembling home broadband routers. Wireless routers used for home networking have these access points built into the hardware, and can work together with standalone AP units. These APs are typically networked to printers and/or a shared high-speed Internet connections. While most homes only require one wireless router (AP) to cover the physical space, businesses need many APs. Determining the optimal locations for where to install an AP can be a challenging task even for network professionals due to the need to cover spaces with a reliable signal. A WiFi AP deployment model was proposed in [51] where using generic algorithm multiple objective decision-making problem were solved addressing AP types, cost and instances of multiple APs. With the proposed system in this research, WiFi operators will be able to identify locations of high user concentration
for optimum deployment of APs. On the other hand this system can also be used for room location of users indoors for elderly tracking if implemented on WiFi AP.
Table 2.2 shows the different wifi protocols with their different data rates [52]. 802.11n is the most widely available of the standards and is backward compatible with a, b and g. The shown data rates are theoretical and gets a lot lower in practice. For instance, even though 802.11g can theoretically handle up to 54 megabits of data per second, it only achieves real-world speeds of about 24 megabits of data per second because of network congestion. Also 802.11n can transmit up to four streams of data, each at a maximum of 150 megabits per second, but most routers only allow for two or three streams.
Table 2.2Wifi protocols and data rate
Protocol Frequency Maximum data rate 802.11ac wave2 5 GHz 1.73 Gbps 802.11ac wave1 5 GHz 866.7 Mbps 802.11n 2.4 , 5 GHz 450 Mbps 802.11g 2.4 GHz 54 Mbps 802.11a 5 GHz 54 Mbps 802.11b 2.4 GHz 11 Mbps
Several devices with wifi adapter can connect to the Internet via one router. This connection is convenient, virtually invisible and fairly reliable; however, if the router fails or if too many people try to use high-bandwidth applications at the same time, users can experience interference or lose their connections. To avoid this, there is need to offload traffic from congested APs by deploying more APs in the appropriate locations and to ensure balanced loading of the network. This is important as cellular network Operators are exploring WiFi as a complementary technology and an extension of their network to help offload traffic from existing network infrastructure [53].
2.2.6
Internet of Things Technology
Internet of Things (IoT) is a new approach to wireless communication where numerous devices are interconnected using different wireless communication technologies like WiFi, bluetooth, ZigBee and cellular network all together to make the world a smart and small place, closing the gap of distance. LoRaWAN is a low power WAN technology that appears promising for Internet of Things. In a LoRaWAN, thousands to millions of smart devices are connected to the gateway through only one hop of connectivity [54]. A good architecture for IoT technology is shown and explained in [55] and an overview of bluetooth technology was explored in [56]. The IoT concept is very popular these days because of the availability of low power, low cost sensor nodes and their numerous applications like different system
man-agement like street light, building, parking, energy efficiency, fire fighting, home automation, personal assistant system, smart lighting solution, weather monitoring, agriculture, smart city, sports etc [57, 58]. In all these applications, numerous sensors are distributed around the coverage space and then linked in chunks of mesh network with APs to communicate with the sensors and extend data to the coordinator/gateway or to another AP. The target is that all sensors in the network transmit their data through to the gateway which takes the data over to the Internet. If an AP is overloaded, data is lost, therefore, monitoring the network to identify locations where more APs are needed would reduce the risk of data loss.
2.2.7
Capacity and Coverage in Wireless Networks
In wireless networks, capacity also known as throughput is the maximum amount of data that can be transferred between network locations over a link or network path. Capacity is dependent on the network engineering, services rendered to subscriber and the rate of network usage. Shannon’s information theory states the amount of information a channel can carry as:
C=Blog2(1+S/N) (2.1) where C is the maximum capacity of the channel in bits/second, B is the bandwidth of the channel in Hertz, S is the signal power and N is the noise power, both in Watts. Equation (2.1) shows that the maximum rate at which information can be transmitted without any error is limited by the bandwidth, the signal level, and the noise level. It was shown in [59] that the communication distance to maximize network capacity depended on user density.
Coverage is the physical geographical area where the radio signal is usable. Coverage is dependent on the power settings which are Country dependent, antenna gain, and the physical environment. In any wireless network deployment, one major task is setting coverage and capacity goals. This is done by creating a predictive model that calculates how many access points (APs) that is needed and where to place them to satisfy those goals within the physical environment of the site. The accuracy of predictions is also verified by performing a manual site survey, and then making any adjustments as necessary. This of course equates to the traditional network strategy.
2.2.8
Capacity Enhancing Techniques
Capacity and hence coverage in any wireless network can be improved by buying more radio spectrum, making a more efficient use of available spectrum by applying more sophisti-cated technology that will increase the throughput capacity of each spectrum band within a given geographic area or by using a more effective topology in the form of cell densification that will allow for more and better intensive geographic reuse of spectrum. Network
densifi-cation is the current option and basically means adding more cell sites to increase the amount of available capacity. Cell sites, strategically placed in capacity-strained areas, add more capacity where it is most needed and also help offload traffic from surrounding sites. Urban areas and large public venues are primary candidates for network densification because of the high concentration of mobile users.
Radio Spectrum For Capacity Improvement
Equation (2.1) show a linear relationship between the bandwidth and the channel capacity, therefore increasing radio bandwidth will increase the capacity. Radio Spectrum (3Hz - 3THz) used for wireless communication is managed by Government and it is assigned through licensing. There are some licensed-exempt spectrum like Industrial, Scientific and Medical radio band (ISM) which are free to use. Spectrum are not readily available and when available it is auctioned by government agency at a very expensive rate [59]. The use of cognitive radio for spectrum expansion was discussed in [60]. The ISM spectrum is getting congested due to expanded usage and so it is prone to interferences.
Technologies for Capacity Improvement
Another approach to capacity enhancement is on the technology like use of additional antennas in the form of cell sectorisation or multiple antennas like Multiple Input Multiple Output (MIMO) [61]. As a general rule network capacity is proportional to the number of transmitters. Multiple antennas are used to create multiple cells or sectors, or to create multiple ‘MIMO layers’thereby re-using the spectral resource multiple times from the same cell site. Provided these are orthogonal and do not interfere with each other, capacity increases linearly. Significant spectrum efficiency gains can be achieved with MIMO but multiple antennas are required on both the base station as well as mobile device which is a very big challenge. Enhanced modulation and coding efficiency [62] is another technology approach to expanding spectrum. Coordinated Multipoint and Cloud radio access network (RAN) which involves joint signal processing at different sites to transform interference into useful signal [63] is another approach. A fast and low latency interconnection (like optic-fibre) between sites is required. Carrier Aggregation [64] allows devices to access multiple increments of spectrum, potentially in multiple bands, facilitates re-farming of existing spectrum and increases effective device bandwidth which can extend coverage. This approach does not directly increase available supply of capacity but just access to the available spectrum. Also device support is limited to specific band combinations and RF performance is less than a single band solution. Even though the use of more antennas give higher spectral efficiency, it incurs higher site costs and doubling the number of antennas does not necessarily double the spectral efficiency.
Improved Cell Topology For Capacity Improvement
The third main approach to capacity enhancement is by cell densification [65] which can be by adding more macrocells or by offloading of traffic from existing macr