VFAST Transactions on Education and Social Sciences
http://vfast.org/journals/index.php/VTSE@ 2015 ISSN(e): 2309-3951;ISSN(p): 2411-0221
Volume 11, Number 2, November-December, 2016
pp. 01–-09
SERVICE QUALITY, CUSTOMER SATISFACTION AND CUSTOMER
LOYALTY: AN EMPIRICAL STUDY ON BANKS IN INDIA
MUSTAFA RAZA RABBANI
1, FARAN AHMAD QADRI
2AND MOHAMMAD ISHFAQ
31
Department of Finance, College of Administration and Finance, Saudi Electronic University, Kingdom of Saudi Arabia.
Email:raza005@gmail.com
2
Department of Accounting, College of Business-Rabigh, King Abdulaziz University, Kingdom of Saudi Arabia.
Email: dr.faranahmad@gmail.com
3Department of Finance, College of Business-Rabigh, King Abdulaziz University, Kingdom of Saudi
Arabia.
Email: mishfaq60@yahoo.co.uk
Received November 2016, Accepted December 2016
ABSTRACT. Service quality is one of the most important factors behind customer satisfaction in commercial banks. Various studies revealed that service quality plays a decisive role in satisfaction of customers and satisfaction of customers to a great extent lead to the customer loyalty vis-a-vis profitability of banks. Against such a backdrop, an attempt has been made to examine the impact of service quality of the bank on customer satisfaction and impact of customer satisfaction on the customer loyalty. This study points out that satisfaction and service quality relationship is critical for commercial banks. The broad objective of the study is to identify the determinants of customer satisfaction in the context of public sector and private sector banks in India and to examine the relationship between customer satisfactions, service quality and customer loyalty of banks. An attempt has also been made to study the impact of satisfaction on the loyalty of the customers. For this purpose responses have been elicited through a pre-tested structured questionnaire from 568 customers of public sector and private sector banks located in NCR.
KEYWORDS: Customer satisfaction, Retail bank, Service quality, Efficiency factors
1. Introduction During the past decade or so the Indian banking sector has undergone major changes through the effect of liberalization, globalization along with the rapid technological development. It has created a dynamic and unstable environment. It is indispensable for Indian banks to shift their attention in delivering exceptional service quality for attracting new customers and retaining loyal customers. The link between service quality, customer satisfaction and loyalty has attracted the interest of many researchers. However results of those studies are somehow inconsistent. On one hand, there are studies that have revealed the direct impact of service quality on the loyalty of bank customers [6, 19, 20]. On the other hand, the majority of studies have found an indirect link between quality and customer loyalty [1]. Specifically, the aforementioned findings highlight the mediating effect of satisfaction on the relationship between quality and loyalty. Hence, the present study tries to characterize the critical link between service quality, customer satisfaction and customer loyalty in the Indian banking sector.
The Significance of the Study. Public Sector banks were enjoying monopoly status prior to the policy of liberalization. On implementation of Liberalization, Privatization and Globalization (LPG) during 1990’s, many new generations of private banks and foreign banks were tied in this sector and continuously showing their rapid growth together and contributed significantly to the economy of India. Due to this intensive competitive situation, it became necessary for all the banks to maintain improved service quality by providing technologically developed innovative service to satisfy customers as they often evaluate and compare all banking services being offered in the competitive market [3]. Any lack in the services or in the quality may cause dissatisfaction among customers and may lead to switch over to the competitors thereby causing a harmful condition to the organization. Admittedly, it is very important for the Indian banks’ customers to reexamine the existing service quality by the Indian banks and to make sure that they are able to satisfy customers and they maintain pace with the innovative services in the future.
Service Quality, Customer Satisfaction and Loyalty Programs in Banking Sector. Customers have special kind of behavior in different aspects like customers give priority to areas which include the fulfillment
of their expectations compared to their perception mean what they actually received. Literature suggests that in terms of quality, customers are less attracted towards tangibles compared to reliability of the service [13] and same applies to the banking service in India. To achieve better level of service quality bank managers should develop working lines on which service quality is refined to increase the customer satisfaction.
SERVQUAL (service quality model) can be used by bank managers to measure the service quality of banking sector. All the characteristics of this model are related directly with customer satisfaction. Empathy and Assurance are at the positive peak points while Tangibility is at the bottom level of this relation. Current competition trends in banking sector indicate that if customer is satisfied than bank will prosper more positively.
For planning loyalty programs bankers should keep in mind the factors and behaviors by giving positive response to consumers’ requirement on regular basis. Incentives and rewards should be offered to customers according to their expectations rather than on basis what is convenient to the bank. It is also imperative to determine the risks and realities of working with partner loyalty programs. For the increase in market share customers’ involvement is an important factor. Bank managers should work on all lines which will make their customers happy and satisfied in the long run.
Loyalty programs are important but research findings indicate that loyalty programs alone cannot be considered as sole factors for long term retention of customers with the bank. Banks should offer other benefits like product ranges and better communication which should inspire the customers in positive manner. Loyalty programs alone cannot guarantee the long run success.
Objectives of the Study
The broad objectives of the study are:
To investigate respondents’ demographics.
To investigate the relationship between service quality and customer satisfaction.
To investigate the relationship between customer satisfaction and customer loyalty.
The observations of the paper are based on an empirical survey conducted by the authors on the customers of State Bank of India, public sector banks, and ICICI bank from the private sector banks in the National Capital Region (NCR). The observations covered a period from January 1, 2013 to April 30, 2013. 2. Literature Review. According to Parasuraman [15] the perceived service quality is defined as a “global judgment, or attitude, relating to the superiority of the service” (p. 16) that results from the difference between customer expectations about the service and their perceptions about the actual service received [2]. It can be argued that there is a wide consensus among researchers that service quality consists of five dimensions namely, tangibles, reliability, responsiveness, assurance, and empathy [15, 16]. Specifically, tangibles reflect customer perceptions about the physical evidence of the service company and reliability is related to the accurate performance of the service. Moreover, responsiveness reflects employee’s willingness to help their customers while assurance is related to the behavior and expertise of employees. Empathy is linked to customer perceptions about the attention the service provider gives to the customers.
Even though the aforementioned five dimensions have been widely used to measure service quality, several researchers have criticized the validity of the SERVQUAL instrument. For example, Cronin and Taylor [9] indicated that service quality could be best measured based on three factors namely, expectations, performance and importance of several service characteristics such as equipment and service environment, employees appearance and performance and service delivery. In the context, of the banking sector, Gounaris [11] argued that the SERVQUAL model mostly assesses customer perceptions about employees and service environment while it does not account for other critical elements of the service quality such as product innovativeness and price. Hence, it based on the SERVQUAL model suggested that perceived service quality in the context of the banking sector should be consisted of six dimensions namely, employee competence, bank’s reliability, and product innovativeness, value for money, physical evidence and proximity convenience of the bank. Regardless of the way service quality has been measured, its impact on several aspects of consumer behavior is evident. Service quality influences strongly customers’ perceived value, satisfaction, re-visit as well as word-of-mouth intentions [10, 12, 17, 18]. As previously mentioned, most of the researchers agree that service quality impacts indirectly loyalty via satisfaction [4, 14, 8] whereas a number of studies have proved the direct impact of service quality on loyalty. Bloemer [6] revealed that the reliability and efficiency of a service impacts on the level of customers’ loyalty. Similarly, Bloemer [7] highlights that the relationship between service quality and loyalty is unclear and needs further investigation. Hence, the present study examines the impact of bank service quality factors (i.e. employee competence, bank’s reliability, and product innovativeness, value for money, physical evidence and proximity-convenience) on customers’ loyalty.
3. Research Methodology
Sample Design: The main focus of the study is Indian Banking Industry. The Indian Banking Industry comprises two major groups i.e. Public Sector Banks and Private Sector Banks. State bank of India among the Public Sector Bank and ICICI Bank among the Private Sector banks were chosen for the study.
Data source: Primary data was collected through a structured questionnaire from 568 respondents from SBI and ICICI Banks in the National Capital Region of Delhi. Also some secondary data was collected from various published and unpublished materials on the subject.
Sampling Unit: Questionnaire collected data on customers’ demographic background including age groups, gender, locations, income levels, families and educational backgrounds.
Sampling Method: Convenience Random Sampling.
Type of Questionnaire: Structured questionnaire with 5 point and 7 point likert scale from Strongly Disagree to Strongly Agree.
Pre-testing of Questionnaire: It was done among selected respondents on judgment basis and necessary corrections were made in the questionnaire, wherever required.
Sample Area: National Capital Region (NCR): Delhi, Gurgoan, Faridabad, Noida and Ghaziabad 4. Analysis of the Data and Findings of the study:
This section of the paper aims to provide an overview of findings and to discuss the results that have been explored during the study. It also examines the relationship among various factors like satisfaction and loyalty, service quality and satisfaction. Descriptive statistics have been used to carry out the data analysis[5]. The study has been broadly divided into two parts. The first part is regarding the general findings based on the questionnaire and the later part is the investigation where the researchers used cross-tabulation techniques to find out the relationship between the key factors and their impact on each other.
Respondents’ profile. The first part of the questionnaire comprises demographic feature of the respondents,
such as age, education, income, marital status, gender and working status as factors might influence their perception. For instance, no restrictions were made regarding age, sex, marital status, education and working status as the researchers wanted to have a broad idea regarding the impact of such factors on customer loyalty and satisfaction. Demographic profile of the respondents is presented below:
Table 1. Demographic profile of the customers
S. No. Demographics Frequency Percentage
1 Age Up to 25 years 63 11.1 26-35 years 300 52.8 36-50 years 124 21.8 Above 50 years 81 14.3 2 Gender Male 343 60.4 Female 225 39.6
3 Marital Status Married 274 48.2
Single 294 51.8 4 Education HSC/Matriculation 5 .9 Intermediate 60 10.6 Graduation 274 48.2 Post Graduation 201 35.4 Ph.D. 28 4.9 5 Annual Household Income ≤ 1 Lakh 43 7.6 ›1lakh-≤3 lakh 162 28.5
›3lakh-≤5 lakh 211 37.1
›5 lakh 152 26.8
6 Occupation Service: (Public Sector) 40 7.0
Service: (Private Sector) 217 38.2
Business 88 15.5
Profession 88 15.5
Student 98 17.3
House wife 37 6.5
Total 568 100
Table 1; discern that the sample respondents are mostly in the age group of 26-35 (52.8%). It is also evident from the Table 1 that 11.1% of the respondents are youngsters (below 25 years), followed by 21.8% were between 36-50 age group and 13.3% above 36-50 years. It can also be seen that the respondents comprised 60% male and 40% female. The above-mentioned proportion of males and females is in accordance with the present population of India, and therefore, can be said to reflect India’s population balance. Furthermore, a majority of the respondents were unmarried (51.8%), while the percentage of married respondents was 48.2%.
The majority of the respondents are graduates (48.2%), post graduates (35.4%) and 4.9% respondents are having PhD degree. This implies that the respondents had high literacy levels. With regard to employment status, the majority of the respondents were employees in private sector (28.2%), self employed (15.5%), and 15.5% respondents are professionals.
It is quite obvious that the employment level was high among the respondents. The majority of the respondents are having annual family income between Rs. 300,000 to 500,000 (37.1%), while 26.8% of them had income more than Rs. 500,000 and 28.2% of them are having annual income between 100,000 and 300,000, and 7.6% of the respondents are having annual family income less than 100,000.
Reliability Analysis
.
To examine the reliability of data we carried out Cronbach's Alpha Reliability test. Table 2 shows that the test scored as 0.888, with the positive relationship among all items considered for this study. This analysis suggests that the data is highly reliable.Table 2. Reliability Statistics
Evaluation of Bank Service Quality
:
Respondents’ evaluation regarding the bank service quality has been presented through the Table 3. Respondents were asked to evaluate the bank service quality, considering the service quality aspects, which they think most important to them.In the above Table 3 we can see that, a significant proportion of respondents 43.8 %, mentioned that quality of services provided by the bank is good and 14.6 % mentioned very good. Results also indicate that 23.8% respondents expressed moderate opinion. On the other hand 11.1% mentioned the bank service quality is bad, whereas 6.7% respondents feel that service quality is poor.
Reliability Statistics
Cronbach's Alpha Cronbach's Alpha Based
on Standardized Items
Number of Items
Table 3: Evaluation of Bank Service Quality
No Service quality of the bank % of respondents
1 Very Good 14
2 Good 44
3 Neither Good nor Bad 24
4 Bad 11
5 Poor 7
Overall satisfaction: In order to find out the level of satisfaction towards the bank the respondents were asked to express their overall satisfaction on the basis of service quality dimensions mentioned earlier. The findings are reported in Table 4.
Table 4: Level of satisfaction of the respondents
No Satisfaction Level % of respondents
1 Strongly Satisfied 16
2 Satisfied 55
3 Neither Satisfied nor Dissatisfied 10
4 Dissatisfied 13
5 Most Dissatisfied 6
It can be noted from the Table 4 that a significant proportion of the respondents (71%, out of which 16% articulated high satisfaction and 55% articulated satisfaction) expressed their satisfaction with the quality aspects of the banking services. On the other hand a considerable number of respondents (10 %) articulated neutral attitude towards the bank service, which means they were neither satisfied nor dissatisfied. The graph also reveals that 19% expressed their dissatisfaction with the banking services.
Investigating the relationship
:
In order to find out the relationship among the factors and also to find out the impact on each other a cross- tabulation procedure has been used as follows.Service quality and satisfaction
:
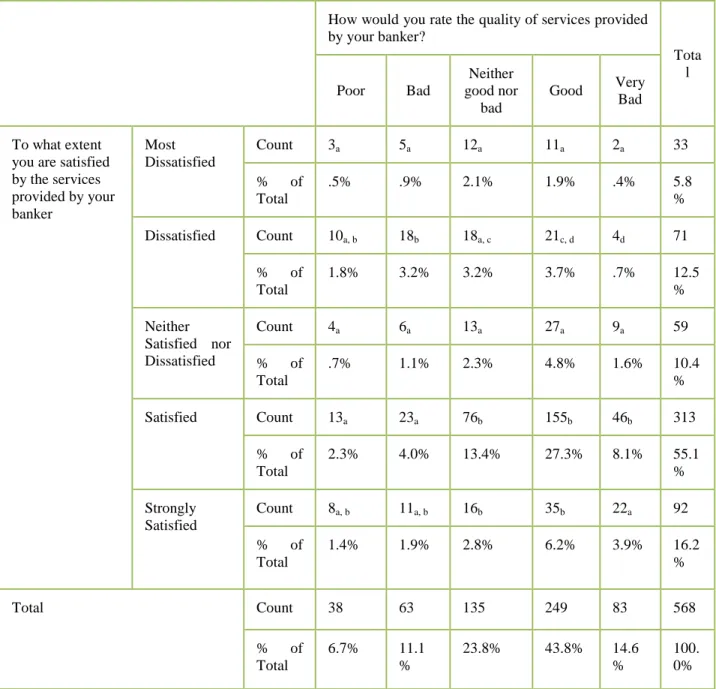
At first we tried to find out the relationship between service quality and satisfaction and also the impact of service quality in the formation process of satisfaction towards the commercial banks in India. The findings are presented below:The results of cross tabulation provide valuable information on complete agreement, i.e. the respondents whose perception of service quality is high or very high they also expressed their satisfaction (either highly satisfied or satisfied) towards the bank. On the other hand, those who experienced low service quality also expressed dissatisfaction towards the bank. From the cross tabulation it is revealed that 43.8% respondents pointed out that the service quality is good and at the same time they also mentioned they are satisfied with the bank (55.1). Again, 14.6% mentioned that the service quality is very good and at the same time they also expressed that they are highly satisfied (16.2%). Data also revealed that those who experienced low quality service (17.8%) they also expressed either neutral opinion or high dissatisfaction towards the bank. Apart from this, the respondents whose perception on service quality is medium (23.8%) also indicated neutral satisfaction levels. From the above results it can be concluded that the judgment towards the level of service quality (based on the service quality dimensions) have great impact on
satisfaction. Moreover, the respondents who have agreed with the service quality aspects they also express their overall satisfaction towards the bank. So, it can be argued that service quality plays an important role in the formation process of satisfaction.
Table 5: Cros-tabulation results between service quality and customer satisfaction
How would you rate the quality of services provided by your banker? Tota l Poor Bad Neither good nor bad Good Very Bad To what extent you are satisfied by the services provided by your banker Most Dissatisfied Count 3a 5a 12a 11a 2a 33 % of Total .5% .9% 2.1% 1.9% .4% 5.8 % Dissatisfied Count 10a, b 18b 18a, c 21c, d 4d 71 % of Total 1.8% 3.2% 3.2% 3.7% .7% 12.5 % Neither Satisfied nor Dissatisfied Count 4a 6a 13a 27a 9a 59 % of Total .7% 1.1% 2.3% 4.8% 1.6% 10.4 % Satisfied Count 13a 23a 76b 155b 46b 313 % of Total 2.3% 4.0% 13.4% 27.3% 8.1% 55.1 % Strongly Satisfied Count 8a, b 11a, b 16b 35b 22a 92 % of Total 1.4% 1.9% 2.8% 6.2% 3.9% 16.2 % Total Count 38 63 135 249 83 568 % of Total 6.7% 11.1 % 23.8% 43.8% 14.6 % 100. 0%
Loyalty Construct: In order to find out loyalty of the customers towards their bank two questions were included in the questionnaire. One question was related to the changes in policy and service charge. In this context the respondents were asked to express their opinion, if the bank will change its service charge or policy in that case whether they will bank with their present bank or not. From the Table 6 it is clear that a significant proportion of respondents (54.8%, out of which 9.2 % strongly agreed and 45.6% agreed) mentioned that they will continue banking with their existing banks even if the service charges or policies of the bank will change. On the other hand 26.1% expressed their disagreement and 19.2 % remained neutral. In this regard it can also be noted that satisfied customers tend to be loyal with the bank regardless of changes in service charge or policies. Further, in order to ascertain the customer’s loyalty the respondents were asked whether they will recommend their banks to others.
From the Table 7 it is clear that a considerable amount of respondents were interested to recommend their banks to others. The above Table 7 shows that considerable amount of respondents i.e. around 13.6% respondents expressed that they were extremely likely to recommend whereas 39.3% mentioned that they were likely to
recommend their bank to others. On the other hand 35.3% negated. Basically, the negative attitude comes from the dissatisfaction regarding service quality aspects. Thus the above Table 7 reveals that a significant number of
Table 6: Loyalty of the customers towards their bank
No Loyalty Construct % of respondents
1 Strongly Agree 9.2
2 Agree 45.6
3 Neither Agree nor Disagree 19.2
4 Disagree 23.6
5 Strongly Disagree 2.5
respondents are loyal towards their banks. This is due to the level of satisfaction. Admittedly, those who are satisfied with their banks tend to recommend to others and intend to continue with the same bank even if there is change in the service charge or banking policies.
Table 7: Recommendation of bank to others
No Service quality of the bank % of respondents
1 Extremely Likely 13.6
2 Likely 39.3
3 Neither Likely nor Unlikely 11.8
4 Unlikely 20.2
5 Not at all likely 15.1
Customer Satisfaction and Customer Loyalty
:
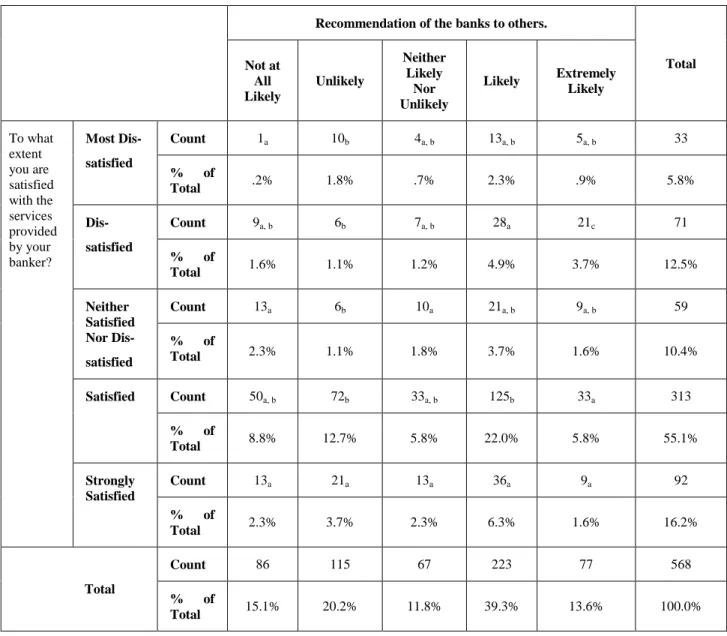
In order to find out whether there is any relationship between satisfaction and loyalty of customers the following cross-tabulation has been used. The cross-tabulation is based on respondents’ level of satisfaction and their intention to recommend the banks to others. Aforesaid Table 8 discerns that, respondents who are satisfied with the bank they were also interested to recommend the bank to others. Table 3 also reveals that as high as 71.3% satisfied customers (either strongly satisfied or satisfied) unanimously agreed to recommend their respective banks to others. On the other hand, 18.3 % dissatisfied respondents opined that they are not in favour of recommending their banks to others. The rest of the respondents expressed neutral opinion. From the above findings it can be concluded that there is a strong (positive) relationship between customer satisfaction and bank loyalty and satisfied customers are willing to continue with their existing banks as well as recommend the same to others.Table 8: Cross-tabulation of customer satisfaction and their willingness to recommend others
Recommendation of the banks to others.
Total Not at All Likely Unlikely Neither Likely Nor Unlikely Likely Extremely Likely To what extent you are satisfied with the services provided by your banker? Most Dis- satisfied Count 1a 10b 4a, b 13a, b 5a, b 33 % of Total .2% 1.8% .7% 2.3% .9% 5.8% Dis- satisfied Count 9a, b 6b 7a, b 28a 21c 71 % of Total 1.6% 1.1% 1.2% 4.9% 3.7% 12.5% Neither Satisfied Nor Dis- satisfied Count 13a 6b 10a 21a, b 9a, b 59 % of Total 2.3% 1.1% 1.8% 3.7% 1.6% 10.4% Satisfied Count 50a, b 72b 33a, b 125b 33a 313 % of Total 8.8% 12.7% 5.8% 22.0% 5.8% 55.1% Strongly Satisfied Count 13a 21a 13a 36a 9a 92 % of Total 2.3% 3.7% 2.3% 6.3% 1.6% 16.2% Total Count 86 115 67 223 77 568 % of Total 15.1% 20.2% 11.8% 39.3% 13.6% 100.0%
Conclusion This research study was conducted to find the impact of service quality, customer satisfaction and loyalty programs on customer’s loyalty in banking sector of India. Research indicates that service quality, customer satisfaction and loyalty programs are the important factors that can increase the loyalty of a customer towards its bank but customers do have some reservations about the loyalty programs in India. Research shows that loyalty programs do influence the customers’ loyalty nevertheless Indian banks are offering loyalty programs to their corporate customers and not to the general public. It is however clear from the analysis that general public do want loyalty programs with some kind of rewards given by their respective banks. When banks focus on customer loyalty, account holders will not only keep their accounts with the bank, but they will also feel comfortable referring to family and friends. Hence in order to be successful, banks should focus on building customer loyalty by offering quality products and by treating people how they want to be treated for better and greater customer satisfaction. For that reason banks should offer loyalty programs to retain customers because loyalty programs helps in developing strong relationships with all the customers that could directly or indirectly affect the success of banks.
REFERENCES
[1]. Amudha, R., and Viyaya Banu, C. (2007). Service Quality in Banking with Special Reference to ICICI Bank Ltd.
Tiruchirappalli District, Asia-Pacific Business Review, III (2). New Delhi.
[2]. Asubonteng, P., McCleary, K.J. and Swan, J.E. (1996), "SERVQUAL revisited: a critical review of service quality", Journal of Services Marketing, Vol. 10, No. 6, pp. 62-81.
[4].
Beerli, A., Martin, J. D., & Quintana, A. (2004). A model of customer loyalty in the retail banking market. European Journal of Marketing, 38(1/2), 253-275. http://dx.doi.org/10.1108/03090560410511221[5].
Black, K., (2012). Business Statistics: For Contemporary Decision Making, John Wiley India Edition. New Delhi[6]. Bloemer, J., Ruyter, K., Peters, P. (1998). Investigating Drivers of Bank Loyalty: The Complex Relationship Between Image, Service Quality and Satisfaction, International Journal of Bank Marketing 16: 276-286.
[7]. Bloemer, J., Ruyter, K., Wetzels, M. (1999). Linking Perceived Service Quality and Service Loyalty: A
Multi-dimensional Perspective, European Journal of Marketing 33: 1082-1106.
[8]. Caruana, A. (2002). Service Loyalty: The Effects of Service Quality and the Mediating Role of Customer Satisfaction, European Journal of Marketing 36: 811-828.
[9]. Cronin J. and Taylor S. (1992). Measuring Service Quality: A Reexamination and Extension, Journal of Marketing, Volume 56. Pp. 55-68.
[10]. Cronin, J.J., Brady, M.K., & Hult, G.T.M. (2000). Assessing the effects of quality, value, and customer satisfaction on consumer behavioral intentions in service environments. Journal of Retailing, 76(2), 193–218. [11]. Gounaris, S., Stathakopoulos, V., Athanassopoulos, A. (2003). Antecedents to Perceived Service Quality: An
Exploratory Study in the Banking Industry, International Journal of Bank Marketing 21: 168-190.
[12]. Harrison-Walker, J. (2001). The Measurement of Word-of-Mouth Communication and An Investigation of Service Quality and Customer Commitment as Potential Antecedents, Journal of Service Research 4: 60-75. [13]. Ishfaq, M. Qadri, F.A. Abusaleem, K.S.M. Al-Zayood, M. (2016), Measuring Quality of Service from
Consumers’ Perspectives: A Case of Healthcare Insurance in Saudi Arabia. Health Sci J. 2015, 10:1.
[14]. Lewis, R., & Soureli, M. (2006) “The antecedents of consumer loyalty in retail banking‟, Journal of consumer Behavior, vol. 5, pp. 15-31.
[15]. Parasuraman, A., Zeithaml, V. A., & Berry, L. L. (1988). SERVQUAL: A Multiple-Item Scale for
Measuring Consumer Perceptions Of Service Quality. Journal of Retailing , Volume 64, Number 1. pp.
12-37.
[16].
Parasuraman, A., Berry, L.L., Zeithaml, V.A., (1991). Perceived service quality as a customer based
performance measure: an empirical examination of organizational barriers using an extended service
quality model,
Human Resource Management
, Vol. 30 No. 3, Autumn, pp. 335-
364. .
[17]. Popli, G.S. and Rao, D.N. (2009). Marketing of Mutual Funds Through Banks In India. retrieved from:
http://ssrn.com/abstract=18872584
[18]. Yavas, U., Benkenstein, M., Stuhldreier, U. (2004). Relationships Between Service Quality and Behavioral Outcomes: A Study of Private Bank Customers in Germany, International Journal of Bank Marketing 22:144-157.
[19]. Zeithaml, V.A. (1988). Consumers’ perceptions of price, quality, and value: a means- end model and synthesis of evidence. Journal of Marketing, 52(July): 2-22. Antecedents of customer loyalty 925
[20]. Zeithaml, V.A., Parasuraman, A. and Berry, L. L. (1990). Delivering quality service: Balancing Customer perceptions and expectations, Free Press, New York.