...
O
PTIMIZING
D
ATA
-C
ENTER
TCO
WITH
S
CALE
-O
UT
P
ROCESSORS
...
P
ERFORMANCE AND TOTAL COST OF OWNERSHIP(TCO)
ARE KEY OPTIMIZATION METRICS IN LARGE-
SCALE DATA CENTERS. A
CCORDING TO THESE METRICS,
DATA CENTERS DESIGNED WITH CONVENTIONAL SERVER PROCESSORS ARE INEFFICIENT. R
ECENTLY INTRODUCED PROCESSORS BASED ON LOW-
POWER CORES CAN IMPROVE BOTH THROUGHPUT AND ENERGY EFFICIENCY COMPARED TO CONVENTIONAL SERVER CHIPS.
H
OWEVER,
A SPECIALIZEDS
CALE-O
UTP
ROCESSOR(SOP)
ARCHITECTURE MAXIMIZES ON-
CHIP COMPUTING DENSITY TO DELIVER THE HIGHEST PERFORMANCE PERTCO
AND PERFORMANCE PER WATT AT THE DATA-
CENTER LEVEL.
...
We are in the midst of an infor-mation revolution, driven by ubiquitous access to vast data stores via a variety of richly networked platforms. Data centers are the workhorses powering this revolution. Companies leading the transformation to the digital universe, such as Google, Microsoft, and Facebook, rely on networks of megascale data centers to provide search, social connec-tivity, media streaming, and a growing num-ber of other offerings to large, distributed audiences. A scale-out data center powering cloud services can house tens of thousands of servers that are necessary for high scalabil-ity, availabilscalabil-ity, and resilience.1The massive scale of such data centers requires an enormous capital outlay for infra-structure and hardware, often exceeding $100 million per data center.2Similarly ex-pansive are the power requirements, typically in the range of 5 to 15 MW per data center, totaling millions of dollars in annual operat-ing costs. With demand for information services skyrocketing around the globe,
efficiency has become a paramount concern in the design and operation of large-scale data centers.
To reduce infrastructure, hardware, and energy costs, data-center operators target high computing density and power effi-ciency. Total cost of ownership (TCO) is an optimization metric that considers the costs of real estate, power delivery and cool-ing infrastructure, hardware acquisition costs, and operating expenses. Because server acquisition and power costs constitute the two largest TCO components,3servers pres-ent a prime optimization target in the quest for more efficient data centers. In addition to cost, performance is also critical in scale-out data centers designed to service thou-sands of concurrent requests with real-time constraints. The ratio of performance to TCO (performance per dollar of ownership expense) is thus an appropriate metric for evaluating different data-center designs.
Scale-out workloads prevalent in large-scale data centers rely on in-memory
Pejman Lotfi-Kamran
Babak Falsafi
EPFL
Chrysostomos Nicopoulos
Yiannakis Sazeides
University of Cyprus
Boris Grot
EPFL
Damien Hardy
University of Cyprus
...processing and massive parallelism to guaran-tee low response latency and high throughput. Although processors ultimately determine a server’s performance characteristics, they contribute just a fraction of the overall pur-chase price and power burden in a server node. Memory, disk, networking equipment, power provisioning, and cooling all contrib-ute substantially to acquisition and operating costs. Moreover, these components are less energy proportional than modern processors, meaning their power requirements don’t scale down well as the server load drops. Thus, maximizing the benefit from the TCO investment requires getting high utili-zation from the entire server, not just the processor.
To achieve high server utilization, data centers must employ processors that can fully leverage the available bandwidth to memory and I/O. Conventional server pro-cessors use powerful cores designed for a broad range of workloads, including scien-tific, gaming, and media processing. As a re-sult, they deliver good performance across the workload range, but they fail to maxi-mize either performance or efficiency on memory-intensive scale-out applications. Emerging server processors, on the other hand, employ simpler core microarchitec-tures that improve efficiency but fall short of maximizing performance. What the in-dustry needs are server processors that jointly optimize for performance, energy, and TCO.
With this in mind, we developed a method-ology for designing performance-density-optimal server chips called Scale-Out Processors (SOPs). Our SOP methodology improves data-center efficiency through a many-core organization tuned to the demands of scale-out workloads.
Today’s server processors
Multicore processors common today are well-suited for massively parallel scale-out workloads running in data centers. First, they improve throughput per chip over single-core designs. Second, they amortize on-chip and board-level resources among multiple hard-ware threads, thereby lowering both cost and power consumption per unit of work (that is, per thread).
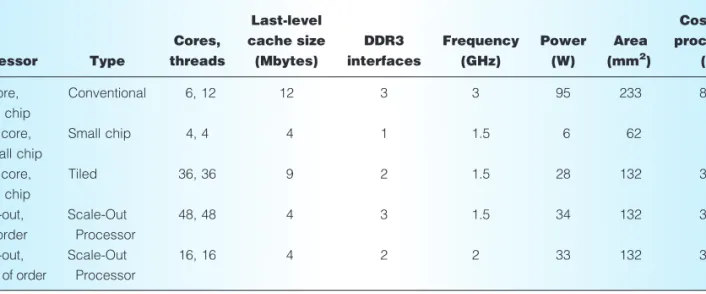
Table 1 summarizes the principal charac-teristics of today’s server processors. Existing data centers are built with server-class designs from Intel and AMD. A representative pro-cessor is Intel’s Xeon 5670,4a mid-range design that integrates six powerful dual-threaded cores and a spacious 12-Mbyte last-level cache (LLC). The Xeon 5670 con-sumes 95 W at a maximum frequency of 3 GHz. The combination of powerful cores and relatively large chip size leads us to clas-sify conventional server processors asbig-core, big-chipdesigns.
Recently, several companies have intro-duced processors featuring simpler core microarchitectures that specifically target
Table 1. Server chip characteristics. The first three processors are existing designs, and the last two processors are proposed designs.
Processor Type Cores, threads Last-level cache size (Mbytes) DDR3 interfaces Frequency (GHz) Power (W) Area (mm2) Cost per processor ($) Big core, big chip Conventional 6, 12 12 3 3 95 233 800 Small core, small chip Small chip 4, 4 4 1 1.5 6 62 95 Small core, big chip Tiled 36, 36 9 2 1.5 28 132 300 Scale-out, in order Scale-Out Processor 48, 48 4 3 1.5 34 132 320 Scale-out, out of order Scale-Out Processor 16, 16 4 2 2 33 132 320
...
scale-out data centers. Research has shown simple-core designs to be well-matched to the demands of many scale-out workloads, which spend a high fraction of their time accessing memory and have moderate com-putational intensity.5 Two design para-digms have emerged in this space: one type features a few small cores on a small chip (small core, small chip); the other inte-grates many small cores on a bigger chip (small core, big chip).
Companies including Calxeda, Marvell, and SeaMicro market small-core, small-chip processors targeted at data centers. Despite the differences in the core organization and even the instruction set architecture (ISA)—Calxeda’s and Marvell’s designs are powered by ARM, whereas SeaMicro uses an x86-based Atom processor—the chips are surprisingly similar in their feature set: all have four hardware contexts, dual-issue cores, a clock speed in the range of 1.1 to 1.6 GHz, and power consumption of 5 to 10 W. We use the Calxeda design as a rep-resentative configuration, featuring four Cortex-A9 cores, a 4-Mbyte LLC, and an on-die memory controller.6At 1.5 GHz, our model estimates a peak power con-sumption of 6 W.
A processor representative of the small-core, big-chip design philosophy is Tilera’s Tile-Gx3036. This server-class processor fea-tures 36 simple cores and a 9-Mbyte LLC in a tiled organization.7Each tile integrates a
core, a slice of the shared LLC, and a router. Accesses to the distributed LLC’s remote banks require a traversal of the on-chip interconnect, implemented as a 2D mesh network with a single-cycle per-hop delay. Operating at 1.5 GHz, the Tilera-like tiled design draws approximately 28 W of power at peak load.
To understand the efficiency implications of these diverse processor architectures, we use a combination of analytic models and simulation-based studies, employing a full-system server simulation infrastructure, to esti-mate their performance, area, and power char-acteristics. Our workloads are taken from CloudSuite (http://parsa.epfl.ch/cloudsuite), a collection of representative scale-out appli-cations that includes web search, data serv-ing, and MapReduce.
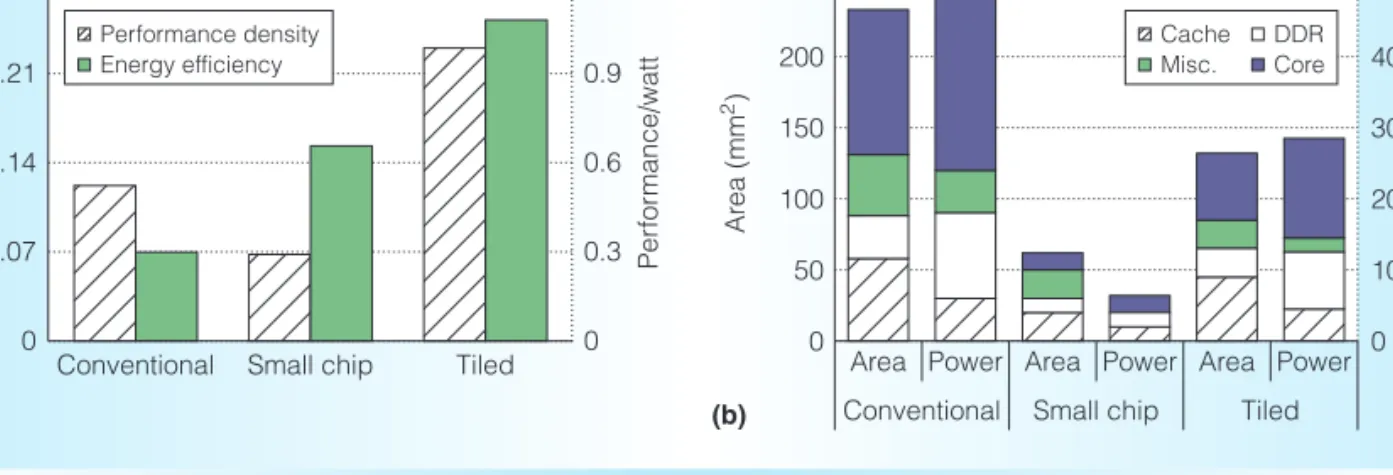
Figure 1a compares the designs along two dimensions: performance density and energy efficiency. Performance density, expressed as performance per mm2, measures the process-or’s ability to effectively utilize the chip real estate. Energy efficiency, in units of perfor-mance per watt, indicates the processor’s ability to convert energy into useful work.
The small-core, small-chip processor offers a 2.2improvement in energy effi-ciency over a conventional big-core design, thanks to the former’s simpler core micro-architecture. However, the small-chip design has 45 percent lower performance density than the conventional one. To better
(a) (b) 0 0.3 0.6 0.9 1.2 0 0.07 0.14 0.21 0.28
Conventional Small chip Tiled
Per for mance/watt Per for mance/mm 2 Performance density Energy efficiency Power (watt) Cache DDR Misc. Core 0 10 20 30 40 50 0 50 100 150 200 250
Area Power Area Power Area Power
Conventional Small chip Tiled
Ar
ea (mm
2)
95
Figure 1. Efficiency, area, and power of today’s server processors: performance density and energy efficiency (a); processor area and power breakdown (b). We use a combination of analytic models and simulation-based studies to estimate the performance, area, and power characteristics.
understand the trends, Figure 1b shows a breakdown of the respective processors’ area and power budgets. The data reveals that while the cores in the conventional server processor take up 44 percent of the chip area, the small-chip design commits just 20 percent of the chip to compute, with the remainder of the area going to the LLC, I/O, and auxiliary circuitry. In terms of power, the six conventional cores consume 71 W of the 95-W power budget (75 per-cent), whereas the four simpler cores in the small-chip organization dissipate just 2.4 W (38 percent of total chip power) under full load. As with the area, the relative energy cost of the cache and peripheral circuitry in the small-chip design is greater than in the conventional design (62 percent and 25 per-cent of the respective chips’ power budgets). The most-efficient design point is the small-core, big-chip tiled processor, which surpasses both conventional and small-chip alternatives by more than 88 percent in per-formance density, and 65 percent in energy efficiency. The cores in the tiled processor take up 36 percent of the chip real estate, nearly doubling the fraction of the area dedi-cated to execution resources as compared to the small-chip design. The fraction of the power devoted to execution resources increases to 48 percent compared to 38 per-cent in the small-chip design.
Our results corroborate earlier studies that identify efficiency benefits stemming from the use of lower-complexity cores as com-pared to those used in conventional server processors.8,9 However, our findings also identify an important, yet unsurprising, trend: the use of simpler cores by themselves is insufficient for maximizing processor effi-ciency, and the chip-level organization must be considered. More specifically, a larger chip that integrates many cores is necessary to amortize the area and power expense of uncore resources, such as cache and off-chip interfaces, by multiplexing them among the cores.
Scale-Out Processors
To maximize silicon efficiency on scale-out workloads, we examined the characteris-tics of a suite of representative scale-out applications and the demands they place on
processor resources. Our findings, consistent with prior work,10,11indicate that
large LLCs are not beneficial for cap-turing data-center applications’ enor-mous data footprint;
the active instruction footprint greatly exceeds the Level-1 (L1) caches’ capac-ity, but can be accommodated with a 2- to 4-Mbyte secondary cache; and scale-out workloads have virtually no
thread-to-thread communication, requir-ing minimal on-chip coherence and communication infrastructure.
Driven by these observations, we devel-oped the SOP design methodology that extends the small-core, big-chip design space by optimizing the on-chip cache capacity, core count, interconnect delay, and number of interfaces to the off-chip memory in a way that maximizes computing density and throughput.12
At the heart of an SOP is a coarse-grained building block called apod—a stand-alone multicore server. Each pod features a mod-estly sized 2- to 4-Mbyte LLC for capturing the active instruction footprint and com-monly accessed data structures. The small LLC size reduces the cache access time and leaves more chip area for the cores. To further reduce the latency of performance-critical LLC accesses, SOPs use a high-bandwidth crossbar interconnect instead of a multihop point-to-point network. The number of cores in a pod is empirically cho-sen in a way that maximizes cache utilization without causing thrashing or penalizing interconnect area and delay.
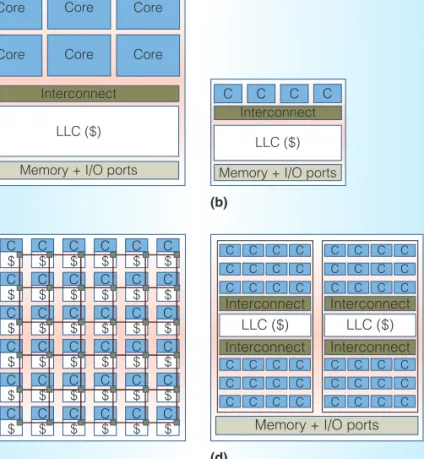
The SOP architecture achieves scalability through tiling at the pod granularity up to the available area, power, or memory band-width limit. The multiple pods share the off-chip interfaces to reduce cost and maxi-mize bandwidth utilization. The pod-based tiling strategy reduces chip-level complexity and provides a technology-scalable architec-ture that preserves each pod’s optimality across technology generations. Figure 2 com-pares the SOP chip architecture to conven-tional, small-chip, and tiled designs.
Compared to a tiled design, an SOP increases the number of cores integrated on
chip by 33 percent, from 36 to 48, within the same area budget. SOPs achieve this computing-density improvement by reduc-ing the LLC capacity from 9 to 4 Mbytes, freeing up chip area for the cores. The result-ing SOP devotes 47 percent of the chip area to the cores, up from 36 percent in the tiled processor. Our evaluation shows that the per-core performance in the SOP design is com-parable to that in a tiled one; although the SOP’s smaller LLC capacity has a dampen-ing effect on sdampen-ingle-threaded performance, the lower access delay in the crossbar-based SOP compensates for the higher miss ratio by accelerating fetches of performance-critical instructions. The bottom line is that the SOP design improves chip-level perfor-mance (that is, throughput) by 33 percent over the tiled processor. Finally, the SOP design’s peak power consumption is higher than that of the tiled processor owing to
the former’s greater on-chip computing capac-ity. However, as our results demonstrate, the SOP’s greater chip-level processing capability is beneficial from a TCO perspective despite the increased power draw at the chip level.
Methodology
We now describe the cost models, server hardware features, workloads, and simulation infrastructure used in evaluating the various chip organizations at the data-center level.
TCO model
Large-scale data centers employ high-density server racks to reduce the space foot-print and improve cost efficiency. A stan-dard rack can accommodate up to 42 1U (one-rack-unit) servers, with each server integrating one or more processors, multiple DRAM DIMMs, disk- or flash-based stor-age nodes, and a network interface. Servers in a rack share the power distribution infra-structure and network interfaces with the rest of the data center. The number of racks in a large-scale data center is com-monly constrained by the available power budget.
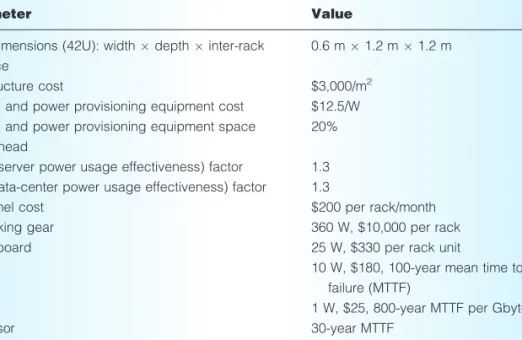
Our TCO analysis, derived using EETCO,13 considers four major expense categories. Table 2 further details the key parameters.
Data-center infrastructure. This includes the land, building, and power provisioning and cooling equipment with a 15-year deprecia-tion schedule. The data-center area is primar-ily determined by the IT (rack) area, with cooling and power provisioning equipment factored in. We estimate the cost of this equipment per watt of critical power.
Server and networking hardware. Server hardware includes processors, memory, disks, and motherboards. We also account for the networking gear at the data center’s edge, aggregation, and core layers and as-sume that the cost scales with the number of racks. The amortization schedule is three years for server hardware, and four years for networking equipment.
Power. This is predominantly determined by the servers, including fans and power (a)
(c)
(b)
Interconnect
Memory + I/O ports LLC ($)
C C C C
(d) Interconnect
Memory + I/O ports LLC ($) Core Core Core Core Core Core C $ C $ C $ C $ C $ C $ C $ C $ C $ C $ C $ C $ C $ C $ C $ C $ C $ C $ C $ C $ C $ C $ C $ C $ C $ C $ C $ C $ C $ C $ C $ C $ C $ C $ C $ C $
Memory + I/O ports
Memory + I/O ports Interconnect LLC ($) C C C C C C C C C C C C Interconnect C C C C C C C C C C C C LLC ($) Interconnect C C C C C C C C C C C C Interconnect C C C C C C C C C C C C
Figure 2. Comparison of server processor organizations: conventional (a), small chip (b), tiled (c), and Scale Out (d). The Scale-Out design achieves the highest performance density through modestly sized caches and many cores in a multi-pod organization.
supplies, networking gear, and cooling equip-ment. The electricity cost is $0.07/KWh.
Maintenance. This includes costs for repair-ing faulty equipment, determined by its mean time to failure (MTTF), and the sal-aries of the personnel.
Server processors
We evaluate a number of data-center server processor designs, as summarized in Table 1. We use publicly available data from the open web andMicroprocessor Report
(http://www.mpronline.com/index.php) to estimate core and chip area, power, and cost. We supplement this information with Cacti 6 for cache area and power profiles, and we use measurements of commercial server processors’ die micrographs to estimate the area of on-chip memory and I/O inter-faces. We detail many aspects of the method-ology in our International Symposium on Computer Architecture (ISCA) 2012 paper.12
Baseline parameters. To make the analysis tractable and reduce variability due to differ-ences in the ISA, we model ARM-based cores for all but the conventional processor designs. We based both the tiled and SOP in-order configurations on the Cortex-A8, a dual-issue in-order core clocked at 1.5 GHz. The small-chip design uses a
more aggressive dual-issue out-of-order core, similar to an ARM Cortex-A9, which is rep-resentative of existing products in the small-chip processor design space. For the conven-tional design, we model a custom four-wide large-window core running at 3 GHz.
At the chip level, we model the target processors’ associated cache configurations, interconnect topologies, and memory inter-faces. Our simulations reflect important run-time artifacts of these structures, such as interconnect delays, bank contention, and off-die bandwidth limitations.
Effect of higher-complexity cores. Although the low-complexity out-of-order and in-order cores are attractive from an area- and energy-efficiency perspective, their lower per-formance could be unacceptable for applica-tions that demand fast response times and have nontrivial computational components (for example, web search8). To study the ef-fect of higher-performance cores on data-center efficiency, we also evaluate an SOP organization based on an ARM Cortex-A15, a triple-issue core clocked at 2 GHz. Compared to the baseline dual-issue in-order core, a three-way out-of-in-order core delivers 81 percent higher single-threaded performance, on average, across our work-load suite, while requiring 3.5 the area and more than 3the power per core.
Table 2. Total cost of ownership (TCO) parameters.
Parameter Value
Rack dimensions (42U): widthdepthinter-rack
space
0.6 m1.2 m1.2 m
Infrastructure cost $3,000/m2
Cooling and power provisioning equipment cost $12.5/W
Cooling and power provisioning equipment space overhead
20%
SPUE (server power usage effectiveness) factor 1.3
PUE (data-center power usage effectiveness) factor 1.3
Personnel cost $200 per rack/month
Networking gear 360 W, $10,000 per rack
Motherboard 25 W, $330 per rack unit
Disk 10 W, $180, 100-year mean time to
failure (MTTF)
DRAM 1 W, $25, 800-year MTTF per Gbyte
Processor 30-year MTTF
Effect of chip size. The results in Figure 1 suggest that small-core designs on a larger chip improve performance density and en-ergy efficiency as compared to small-chip organizations. To better understand the ef-fect of chip size on data-center efficiency, we extend the evaluation space of tiled and SOP processors with additional designs fea-turing twice the core, cache, and memory interfaces. These ‘‘2’’ designs approxi-mately match the area of the Xeon-based conventional processor considered in this study.
Processor price estimation. We estimated the price for the conventional processor by pick-ing the lowest price ($800) among online vendors for the target Xeon 5670 processor. Prices for tiled ($300) and small-chip ($95) designs are sourced from the November 2011Microprocessor Reportand correspond to Tilera Tile-Gx3036 and Calxeda ECX-1000, respectively.
To compute the cost for the various SOP and 2tiled designs, we used the Cadence InCyte Chip Estimation tool. We estimated the production volume of the Tilera Gx-3036 processor to be 200,000 units, given a selling price of $300 and a 50-percent margin. We used this production volume to estimate each processor type’s selling price, considering nonrecurring engineering (NRE) costs, mask and production costs, yield, other expense categories, and a 50-percent profit margin. Although we used these estimates for the majority of the stud-ies, we also considered the sensitivity of dif-ferent designs to processor price.
Workloads and simulation infrastructure
We took our workloads, which included Data Serving, MapReduce, SAT Solver, Web FrontEnd, and Web Search, from CloudSuite. For the Web FrontEnd workload, we used the e-banking option from SPECweb2009 in place of its open-source counterpart from CloudSuite, because SPECweb2009 exhibits better performance scalability at high core counts. Functionally, all these applications have similar characteristics— namely, they operate on huge data sets that are split across a large number of nodes into memory-resident shards, the nodes
service a large number of completely inde-pendent requests that don’t share state, and the internode connectivity is used only for high-level task management and coordina-tion.11 Two of the workloads—SAT Solver and MapReduce—are batch, whereas the rest are latency sensitive and are tuned to meet the response-time objectives.
We estimated the various processor designs’ performance using the Flexus full-system simulation.14Our performance met-ric is the product of UIPC (a ratio of com-mitted user instructions over the sum of both user and system cycles)and processor frequency. UIPC is a more accurate perfor-mance metric in full-system evaluation than total IPC due to the contribution of I/O and spin locks in the operating system to the execution time.14
Because of space constraints, we only present aggregate results across all workloads. We averaged performance using a harmonic mean.
Experimental setup
For all experiments, we assume a fixed data-center power budget of 20 MW and a power limit of 17 kW per rack. We evaluated lower-density racks rated at 6.6 kW, but we found the trends to be similar across the two rack configurations. Therefore, for space considerations, we present only one set of results.
To compare the different server architec-tures’ performance and TCO, we start with a rack power budget and subtract all power costs at both the rack and board level, excluding the processors. The per-rack costs include network gear, cooling (fans), and power conversion. At the 1U server level, we account for the motherboard, two disks, and memory (model parameter) power. The remaining power budget is divided by each evaluated processor chip’s peak power to determine the number of processors per server. We then estimate data-center mance as the product of per-processor perfor-mance (using the data collected in simulation) and the number of processors in each 1U server, the number of servers in a rack, and the number of racks in the data center.
Finally, we make no assumptions about what the optimal amount of memory per
server is, which in practice varies for different workloads. Instead, we model three server configurations—with 32, 64, and 128 Gbytes of memory per 1U. One simplifying assumption we make is that the amount of memory per 1U is independent of the chip design. Underlying this assumption are the observations that the data is predominantly read-only, and is partitioned for high par-allelism, allowing performance to scale with more cores and sockets until bottle-necked by the bandwidth of the memory interfaces. Our studies account for band-width limitations.
Evaluation
We examined the various processor designs’ performance and TCO, relative efficiency, and sensitivity to processor price.
Performance and TCO
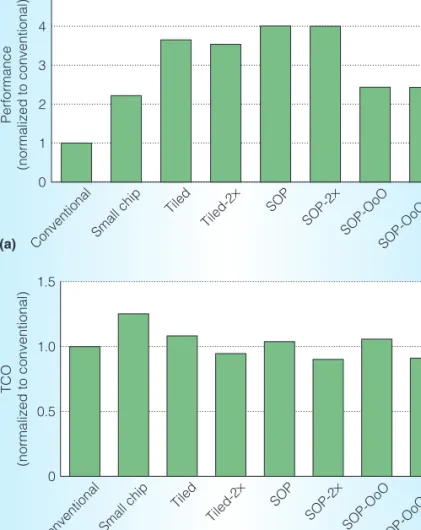
We first compare data-center perfor-mance and TCO for various processor designs, assuming 64 Gbytes of memory per 1U server. Figure 3 presents the results. In general, we observe significant dispar-ity in data-center performance across the processor range, stemming from the different capabilities and energy profiles of the various processor architectures. Highly integrated processors based on small cores, namely tiled and SOP, deliver the highest perfor-mance at the data-center level. The tiled small-core, big-chip architecture improves aggregate performance by a factor of 3.6 over conventional and 1.6 over small-chip designs. The tiled design is superior, thanks to a combination of efficient core microarch-itectures and high chip-level integration— attributes that help amortize the power of both chip- and node-level resources among many cores, affording more power for execu-tion resources.
The highest performance is delivered by the SOP with in-order cores, a small-core, big-chip design with the highest performance density, which improves data-center perfor-mance by an additional 10 percent over the tiled processor. The SOP design effectively translates its performance-density advantage into a performance advantage by better amortizing fixed-power overheads among its many cores, ultimately affording more
power for the execution resources at the rack level.
The SOP design based on out-of-order cores sacrifices 39 percent of the throughput at the data-center level compared to the in-order design. However, higher core complex-ity might be justified for workloads that de-mand tight latency guarantees and have a nontrivial computational component. Even with higher-complexity cores, the SOP archi-tecture attains better data-center performance than either the conventional or small-chip alternatives.
The differences in TCO among the dif-ferent designs aren’t as pronounced as the
(a) 0 1 2 3 4 5 Performance (normalized to conventional)
ConventionalSmall chip Tiled Tiled-2 × SOP SOP-2 × SOP-OoO SOP-OoO-2 × (b) 0 0.5 1.0 1.5 TCO (normalized to conventional)
ConventionalSmall chip Tiled Tiled-2 × SOP SOP-2 × SOP-OoO SOP-OoO-2 ×
Figure 3. Data-center performance and TCO for various server processors normalized to a design based on the conventional processor: data-center performance (higher is better) (a); data-center TCO (lower is better) (b). Differences in processors’ organizations result in large performance differences at the data-center level. Meanwhile, processor choice has a modest effect on data-center TCO as other costs dominate.
differences in performance, because process-ors contribute only a fraction (19 to 39 per-cent) to the overall data-center acquisition and power budget. Nevertheless, one impor-tant trend worth highlighting is that al-though small-chip designs are significantly less expensive and more energy efficient (by a factor of 8 and 2.2, respectively) than conventional processors on a per-unit basis, a small-chip design has a 25 percent higher TCO at the data-center level. The reason for this apparent paradox is that the small-chip design’s limited computing capabilities necessitate as many as 32 sockets per 1U server (versus 2 for conventional) to saturate the available power budget. The ac-quisition costs of such a large number of chips negate the differences in unit price and energy efficiency, emphasizing the need to consider TCO in assessing data-center efficiency.
Relative efficiency
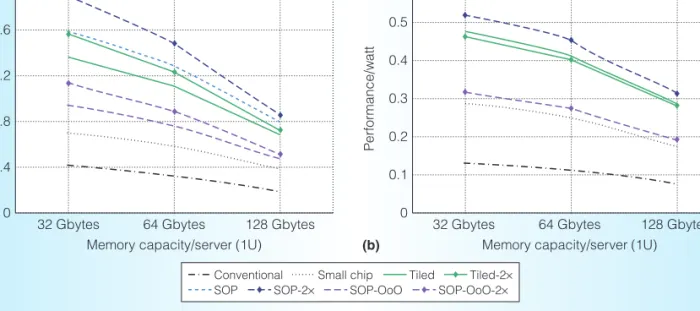
We next examine the combined effects of performance, energy efficiency, and TCO by assessing the various designs on data-center performance/TCO and performance/watt. Figure 4 presents the results as memory capacity varies from 32 to 128 Gbytes per 1U server.
With 64 Gbytes of memory per 1U server, we observe the following trends:
The small-chip design improves performance/watt by 2.2over the con-ventional processor, but its performance/ TCO advantage is just 1.8due to the high processor acquisition costs. A data center based on the tiled design
improves performance per TCO by a factor of 3.4 over conventional and 1.9 over small-chip designs. Energy effi-ciency is improved by 3.6and 1.6, respectively, underscoring the combined benefits of aggressive integration and an efficient core microarchitecture. SOP designs with an in-order core
fur-ther improve performance/TCO by 14 percent and performance/watt by 10 percent over tiled processors through a more efficient use of chip real estate. Tiled and SOP designs with twice the
resources (Tiled-2and SOP-2) im-prove TCO by 11 to 15 percent over their baseline counterparts by reducing the number of processor chips, thereby lowering acquisition costs.
The SOP design with out-of-order cores achieves 40 percent lower per-formance/TCO than the design based 0.4 0.8 1.2 1.6 0.1 0.2 0.3 0.4 0.5 2.0 0 P e rf ormance/T C O 64 Gbytes 128 Gbytes
Memory capacity/server (1U)
32 Gbytes 64 Gbytes 128 Gbytes
Memory capacity/server (1U) 32 Gbytes (a) 0.6 0 P erf ormance/w a tt (b)
Conventional Small chip Tiled Tiled-2×
SOP SOP-2× SOP-OoO SOP-OoO-2×
Figure 4. Data-center efficiency for different server processors: performance/TCO (a); performance/watt (b). Data is not normalized. Small-core, big-chip designs (that is, scale out and tiled) are the most efficient.
on in-order cores. The more aggressive out-of-order microarchitecture is re-sponsible for each core’s lower energy and area efficiency, resulting in lower throughput at the chip level. When the TCO premium is justified, which might be the case for profit-generating latency-sensitive applications (such as web search), the out-of-order SOP de-sign offers a 2.3performance/TCO advantage (2.4in performance/watt) over the conventional server processor. Although the earlier discussion focuses on servers with 64 Gbytes of memory, the trends are similar with other memory config-urations. In general, servers with more mem-ory lower the performance-to-TCO ratio, as memory adds to the server cost while dimin-ishing the processor power budget. The op-posite is true for servers with less memory, in which the choice of processor has a greater effect on both cost and performance.
The key result of our study—that highly integrated server processors are beneficial from a TCO perspective—is philosophically similar to the observations made by Karidis et al., who noted that high-capacity servers are effective in lowering the cost of computation.15
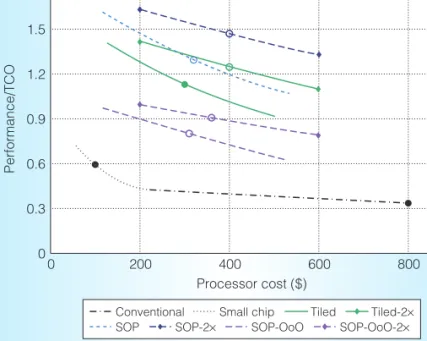
Sensitivity to processor price
Figure 5 shows the effect of varying the processor price on the relative efficiency (performance/TCO) of the different designs, assuming 64 Gbytes of memory per 1U server. For each processor type, except con-ventional, we assume an application-specific integrated circuit (ASIC) design in 40-nm technology, and we compute the price as a function of market size, ranging from 40K to 2M units. For the conventional design, we linearly sweep the price from $800 (known market price) down to $200, with the latter being the lowest considered price among area-equal Tiled-2and SOP-2designs.
In general, we observe that the price of larger chips has less impact on the data-center TCO compared to that of smaller chips because it takes few large chips to pop-ulate a server due to power constraints. In contrast, the small-chip design is highly sen-sitive to unit price, owing to the sheer
volume of chips required per 1U server. For instance, the respective numbers of chips per server in conventional versus small-chip designs differ by a factor of 16.
A consistent trend in our study is that, from a TCO perspective, bigger chips are preferable to smaller ones, as seen in the curves for the various tiled and SOP designs. Although the larger chip area of the ‘‘2’’ designs adds expense, the price difference is modest (around 16 percent or $50 per chip), because NRE and design costs domi-nate production costs. Furthermore, the increased cost is offset by the reduction in the number of required chips.
S
cale-Out Processors extend the advan-tages of emerging small-core, big-chip architectures, providing good energy effi-ciency via simple core microarchitectures, and maximizing the TCO investment by fully utilizing server hardware via abundant execution resources. In the near term, SOPs will be able to deliver performance and TCO gains in a nondisruptive manner by fully leveraging existing software stacks. Further out, demands for greater perfor-mance and energy efficiency could necessitate0 0.3 0.6 0.9 1.2 1.5 1.8 0 200 400 600 800 Performance/TCO Processor cost ($)
Conventional Small chip Tiled Tiled-2×
SOP SOP-2× SOP-OoO SOP-OoO-2×
Figure 5. Relationship between the price per processor and the TCO. Solid circles indicate known prices; unfilled circles show estimated prices based on a production volume of 200K units.
even higher degrees of specialization, requir-ing a disruptive change to the programmrequir-ing model. Our ongoing research effectively targets both near- and long-term data-center efficiency challenges through integration, specialization, and approximation—the new ‘‘ISA’’ of the 21st century. MICRO Acknowledgments
We thank Sachin Idgunji and Emre Ozer, both affiliated with ARM during the work described here, for their contributions to the article. We thank the EuroCloud project partners for inspiring the Scale-Out Processors. This work was partially supported by Euro-Cloud, project 247779 of the European Com-mission 7th RTD Framework Programme— Information and Communication Technologies: Computing Systems.
...
References
1. U. Ho¨lzle and L.A. Barroso,The Datacenter as a Computer: An Introduction to the De-sign of Warehouse-Scale Machines, Mor-gan and Claypool Publishers, 2009. 2. SAVVIS, ‘‘SAVVIS Sells Assets Related to
Two Data Centers for $200 Million,’’ June 2007.
3. J. Hamilton, ‘‘Overall Data Center Costs,’’ blog, 18 Sept. 2010; http://perspectives.mvdirona. com/2010/09/18/OverallDataCenterCosts. aspx.
4. T.P. Morgan, ‘‘Facebook’s Open Hardware: Does It Compute?’’The Register, 8 Apr. 2011; http://www.theregister.co.uk/2011/ 04/08/open_compute_server_comment, 2011.
5. M. Berezecki et al., ‘‘Many-Core Key-Value Store,’’Proc. Int’l Green Computing Conf. and Workshops,IEEE CS, 2011, doi:10.1109/ IGCC.2011.6008565.
6. Calxeda, ‘‘Calxeda EnergyCore ECX-1000 Series,’’ May 2012; http://www.calxeda.com/ wp-content/uploads/2012/06/ECX1000-Product-Brief-612.pdf.
7. Tilera, ‘‘TILE-Gx 3036 Specifications,’’ 2011, http://www.tilera.com/sites/default/files/ productbriefs/ Tile-Gx%203036%20SB012-01.pdf.
8. V.J. Reddi et al., ‘‘Web Search Using Mobile Cores: Quantifying and Mitigating the Price of Efficiency,’’Proc. 37th Ann. Int’l Symp.
Computer Architecture (ISCA 10), ACM, 2010, pp. 314-325.
9. K. Lim et al., ‘‘Understanding and Designing New Server Architectures for Emerging Warehouse-Computing Environments,’’Proc. 35th Ann. Int’l Symp. Computer Architecture
(ISCA 08), IEEE CS, 2008, pp. 315-326. 10. N. Hardavellas et al., ‘‘Toward Dark Silicon
in Servers,’’IEEE Micro,July/Aug. 2011, pp. 6-15.
11. M. Ferdman et al., ‘‘Clearing the Clouds: A Study of Emerging Scale-Out Workloads on Modern Hardware,’’ Proc. 17th Int’l Conf. Architectural Support for Program-ming Languages and Operating Systems
(ASPLOS 12), ACM, 2012, pp. 37-48. 12. P. Lotfi-Kamran et al., ‘‘Scale-Out
Process-ors,’’Proc. 39th Ann. Int’l Symp. Computer Architecture (ISCA 12), IEEE CS, 2012, pp. 500-511.
13. D. Hardy et al., ‘‘EETCO: A Tool to Estimate and Explore the Implications of Datacenter Design Choices on the TCO and the Envi-ronmental Impact,’’ Proc. 1st Workshop Energy-Efficient Computing for a Sustain-able World,2011; http://eurocloudserver. com/wp-content/uploads/EESC2011.pdf. 14. T. Wenisch et al., ‘‘SimFlex: Statistical
Sam-pling of Computer System Simulation,’’
IEEE Micro,July/Aug. 2006, pp. 18-31. 15. J. Karidis, J.E. Moreira, and J. Moreno,
‘‘True Value: Assessing and Optimizing the Cost of Computing at the Data Center Level,’’ Proc. 6th ACM Conf. Computing Frontiers,ACM, 2009, pp. 185-192.
Boris Grot is a postdoctoral researcher at EPFL (E´cole Polytechnique Fe´de´rale de Lausanne). His research interests include processor architectures, memory systems, and interconnection networks for high-throughput, energy-aware computing. Grot has a PhD in computer science from the University of Texas at Austin. He is a member of IEEE and the ACM.
Damien Hardy is a postdoctoral researcher at the University of Cyprus. His research interests include computer architecture, re-liability, embedded and real-time systems, and data center modeling. Hardy has a PhD in computer science from the University of Rennes, France.
Pejman Lotfi-Kamran is a fifth-year PhD candidate at EPFL. His research interests include processor architecture and intercon-nection networks for high-throughput and energy-efficient data centers. Lotfi-Kamran has an MSc in computer architecture from the University of Tehran. He is a member of IEEE and the ACM.
Babak Falsafi is a professor of computer and communication sciences at EPFL, and the founding director of EcoCloud, an interdisciplinary research center targeting robust, economic, and environmentally friendly cloud technologies. Falsafi has a PhD in computer science from the Uni-versity of WisconsinMadison. He is a fellow of IEEE and a senior member of the ACM.
Chrysostomos Nicopoulos is a lecturer in the Department of Electrical and Computer Engineering at the University of Cyprus. His research interests include networks on chip
(NoCs), computer architecture, multi- and many-core microprocessor and system de-sign, and architectural support for massively parallel computing. Nicopoulos has a PhD in electrical engineering from Pennsylvania State University. He is a member of IEEE and the ACM.
Yiannakis Sazeidesis an associate professor in the Department of Computer Science at the University of Cyprus. His research focuses on computer architectures, particu-larly reliability, data-center modeling, mem-ory hierarchy, temperature, and analysis of dynamic program behavior. Sazeides has a PhD in electrical engineering from the University of WisconsinMadison. He is a member of IEEE.
Direct questions and comments about this article to Boris Grot, EPFL IC ISIM PARSA, INJ 238 (Batiment INJ), Station 14, CH 1015, Lausanne, Switzerland; [email protected].